 🏷️ Likely Rental
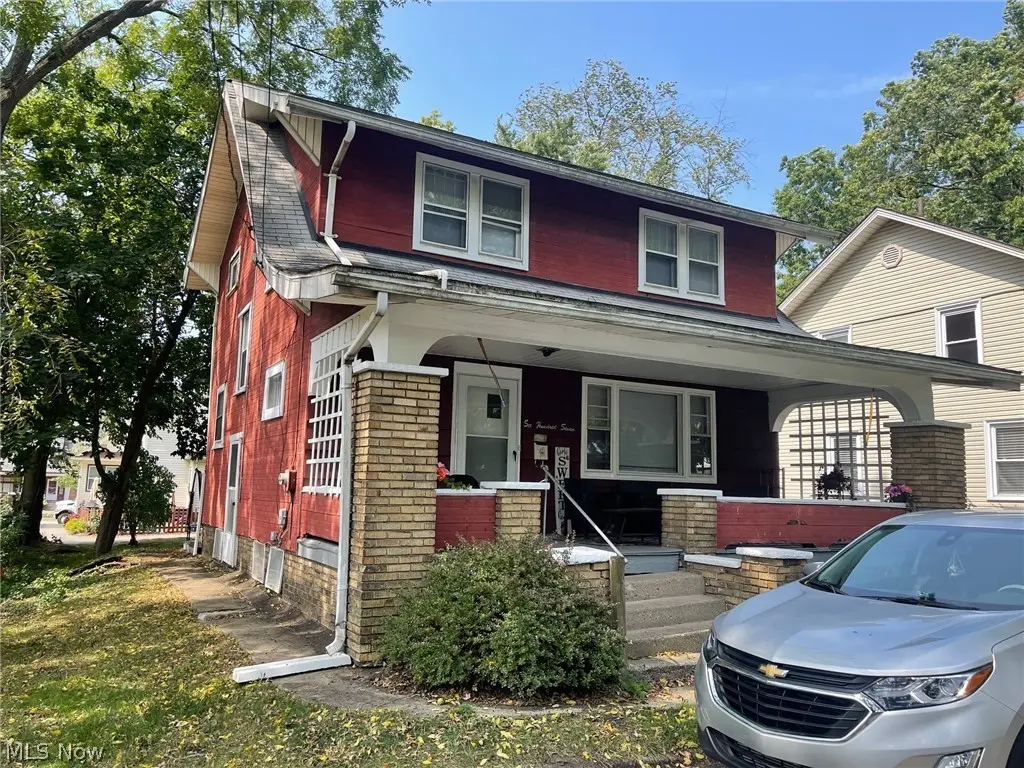
607 Rosemont Ct NW · Canton, OH
Flood risk 1/10 · Minimal
- FEMA flood zone
- X (unshaded)
- Chance of flooding over 30 yrs
- 0.0%
- Est. flood insurance / yr
- $473 – $860
Fire risk 1/10 · Minimal
- Est. fire insurance / yr
- $713 – $1,323
Heat risk 3/10 · Minor
- Hot days now (above 96°F)
- 7 days/yr
- Hot days in 30 yrs
- 17 days/yr
Wind risk 1/10 · Minimal
- Chance of severe wind over 30 yrs
- —
Air-quality risk 2/10 · Minimal
- Unhealthy air days now
- 0 days/yr
- Unhealthy air days in 30 yrs
- 1 days/yr
Risk factors via First Street. Map © Google.
Why this score? — see what drove the B+ grade
The composite is a weighted blend of 9 inputs, each scored 0–100. Each bar is that input's sub-score; the figure is the points it added to the 100-point composite (weight × sub-score).
- Cash flow +30.0/30.0
- ARV discount +15.0/15.0
- DSCR +10.0/10.0
- 1% rule +8.3/10.0
- Rent growth +4.2/5.0
- Livability +3.6/5.0
- Condition / age +2.5/5.0
- Schools +1.7/10.0
- Appreciation +0.0/10.0
$78,000
🖨 Deal sheet 📄 Offer letter ✓ Due diligence
Listing remarks MLS
Investors! 1,352 sf two-story home with three bedrooms. Large front porch. Tenant occupied $1,050 monthly rent.
Key facts
- Large front porch
- 4,599 sq ft lot
- Built 1922
Tags
Neighborhood map
What this means for you Summary
Snapshot
- This is a 3-bed/1.0-bath single-family listed at $78k.
Deal economics
- At list price, monthly cash flow is $291 ($3k/yr) — positive.
- The deal already cash-flows at list — no discount required.
- Meets the 1% rule at list price ($1k rent vs $78k).
- Recommended offer: $77k (1.5% below list) — sets the bar for market timing.
- Cap rate 10.8% vs local median 5.1% in Canton — top-decile yield for the area; either an underpriced asset or a hidden risk that comps aren't pricing in. Stress-test before assuming the spread holds.
Location & tenants
- Location reads 71/100 on livability (#441 in OH) — a middle-class / working-renter tenant base. Strengths: commute A+, cost of living A+, housing A; Watch: crime F, employment F.
- Canton City (urban): math 17% / reading 26% proficiency, ranked #627 of 656 in OH (top 96%) — low school quality limits family demand, transient renter base, plan for 1-2y turnover; 76% free/reduced lunch — lower-income household profile, screen leases tightly.
- Market conditions: Rents rising fast (+6.7%/yr); 119 active listings in the ZIP; 26 comparable units currently listed for rent nearby; rentals at typical pace (median 21d on market — plan ~3-4 weeks tenant-placement turnaround); 528 units permitted in Stark County in 2024 (84 in 5+ unit buildings).
Forward outlook
- Local home prices are declining (-3.0%/yr); year-one equity from $539 of loan paydown is wiped out by about $2k of value loss. Plan a longer hold.
- Stark County population projected to shrink 8% by 2050 — rents likely to lag national; underwrite the cash flow, not the appreciation.
- At projected returns (-3.0% appreciation + 6.7% rent growth), your $22k cash investment doubles in ~6 years — after that, you're playing with house money.
Negotiation context
- It's been on market 16 days — a 2% lower offer ($77k) is reasonable based on typical stale-listing flexibility.
- 2 sale attempts with the ask held roughly flat each time — persistent listings suggest the price (not the market) is what's stuck; bring a comps-based counter.
- Current owner paid $10k; list at $78k implies a 643% gain — meaningful room to come down on a strong offer.
Risks & watch-outs
- Watch-outs: built in 1922 — expect roof / HVAC / electrical / plumbing capex.
Questions for the listing agent
- Built in 1922 — when were the roof, HVAC, electrical panel, plumbing, and water heater last replaced?
- Is there a deadline driving the sale (1031 exchange, divorce, estate, relocation)? That informs how much negotiation room exists.
- Crime grade is F in this area — have there been break-ins, vandalism, or insurance claims at this property in the last 3 years? What carrier currently insures it and at what premium?
- What's the average days-on-market for RENTAL listings here right now (not sales)? A rising rental-DOM trend means longer vacancies and softer asking-rent achievability than the comps imply.
- What's the recent tenant-quality profile in this submarket — average credit score on applications, eviction rate, late-payment / NSF rate, and stable-employment percentage? A property-management company in the area should have these aggregated.
- How much new for-sale + rental construction is in the pipeline within 1–3 miles? Heavy new supply typically softens prices + rents 12–24 months out; constrained supply supports both.
Investment metrics
- 1% rule
- 1.33% ✓
- Cap rate
- 10.78%
- Cash-on-cash
- 16.01%
- DSCR
- 1.71
- GRM
- 6.3
CMA / ARV
- ARV (median comp)
- $103,177
- List price
- $78,000
- Delta
- -24.40%
- Verdict
- UNDERPRICED
- Comps
- 20 within 1.0 mi
Show comp detail 12 sales within ~0.75 mi
| Address | Dist | Beds/Ba | Sqft | Sold | Price | $/sf | Match |
|---|---|---|---|---|---|---|---|
| 354 Clarendon Ave NW | 0.15mi | 2/1.0 (-1) | 1,317 (-3%) | 0mo | $93,500 | $71 | 83 |
| 2322 9th St NW | 0.27mi | 3/2.0 | 1,296 (-4%) | 1mo | $75,000 | $58 | 76 |
| 824 Smith Ave NW | 0.30mi | 3/1.0 | 1,264 (-6%) | 0mo | $126,000 | $100 | 75 |
| 519 Columbus Ave NW | 0.13mi | 3/2.0 | 1,228 (-9%) | 2mo | $105,000 | $86 | 73 |
| 222 Montrose Ave NW | 0.65mi | 3/1.0 | 1,368 (+1%) | 1mo | $175,000 | $128 | 67 |
| 345 Roslyn Ave NW | 0.44mi | 4/2.0 (+1) | 1,296 (-4%) | 1mo | $145,900 | $113 | 63 |
| 3014 2nd St NW | 0.36mi | 3/1.0 | 1,200 (-11%) | 2mo | $95,000 | $79 | 62 |
| 2227 7th St SW | 0.70mi | 3/1.0 | 1,314 (-3%) | 2mo | $55,000 | $42 | 62 |
| 609 Lincoln Ave NW | 0.54mi | 4/1.0 (+1) | 1,442 (+7%) | 2mo | $93,000 | $64 | 57 |
| 3000 14th St NW | 0.58mi | 3/1.5 | 1,505 (+11%) | 1mo | $155,000 | $103 | 52 |
| 3115 2nd St NW | 0.39mi | 2/1.5 (-1) | 1,160 (-14%) | 1mo | $130,000 | $112 | 50 |
| 1437 Deville Ave NW | 0.74mi | 3/2.0 | 1,170 (-14%) | 0mo | $174,000 | $149 | 39 |
Match score weights: distance 35% · size 25% · config 20% · recency 20%. Top-matched comps best support the ARV.
Projected returns pro-forma
-3.0% appreciation · 6.73% rent growth · sell at horizon
- IRR
- 11.0%
- Equity multiple
- 1.46×
- Total profit
- $9,969
- Equity at exit
- $11,630
- IRR
- 22.9%
- Equity multiple
- 3.31×
- Total profit
- $50,509
- Equity at exit
- $6,744
Cash invested: $21,840 (down + closing). Projections, not guarantees.
Landlord ↔ Tenant lean methodology
- Overall (STATE)
- 73 Landlord-Friendly
- State Ohio
- 73 Landlord-Friendly · R+6
- County
- — inherits STATE
- City
- — inherits STATE
ZIP-level market 44708
- Rents YoY
- 6.7%
- Active inventory
- 119
- Price-to-rent
- 6.3×
Monthly cashflow live
- Estimated rent
- $1,037 high interval (Pro) →
- Mortgage (P&I)
- −$409
- Tax from tax record
- −$86 /mo · $1,035/yr
- Insurance
- −$32
- HOA
- −$0
- Vacancy / Maint / Mgmt
- −$218
- Net cashflow
- $291
Break-even live
UW: 25.0% down · 7.5% · 30yr · 1.5% tax · 5.0% vac · 8.0% maint · 8.0% mgmt
Financing live
Cash to close
- Down payment
- $19,500
- Closing costs
- $2,340
- Reserves months
- —
- Total cash needed
- —
Loan-product check · same deal, 3 products live
Conventional
25% down · 7.5% · 30yr
- Down + closing
- —
- Monthly P&I
- —
- Monthly cashflow
- —
- DSCR
- —
- Eligible?
- —
Personal DTI + credit; lowest rate.
DSCR
20% down · 8.5% · 30yr
- Down + closing
- —
- Monthly P&I
- —
- Monthly cashflow
- —
- DSCR
- —
- Eligible?
- —
No personal income docs; deal must DSCR.
Hard money
10% down · 12.0% · 12mo
- Down + closing
- —
- Monthly P&I
- —
- Monthly cashflow
- —
- DSCR
- —
- Eligible?
- —
Short-term bridge; refi at stabilization.
Rent comps 26 comps
| Address | Beds | Baths | Sqft | Rent | $/sqft | DOM | Units | Dist |
|---|---|---|---|---|---|---|---|---|
| 2525 6th St NW Unit NA Canton, OH | 2.0 | 1.0 | 950 | $700 | $0.74 | 43d | 1 | 0.06mi |
| 521 Columbus Ave NW Canton, OH | 2.0 | 1.0 | 900 | $775 | $0.86 | 21d | 1 | 0.12mi |
| 521 Columbus Ave NW Unit 2 Canton, OH | 2.0 | 1.0 | 900 | $875 | $0.97 | 43d | 1 | 0.12mi |
| 2510 10th St NW Canton, OH | 3.0 | 1.5 | 1468 | $1,175 | $0.80 | 21d | 1 | 0.20mi |
| 1005 Broad Ave NW Unit 100 Canton, OH | 2.0 | 1.0 | 1200 | $850 | $0.71 | 21d | 1 | 0.23mi |
| 1005 Broad Ave NW Unit 201 Canton, OH | 3.0 | 1.0 | 1200 | $800 | $0.67 | 21d | 1 | 0.23mi |
| 3034 12th St NW Canton, OH | 2.0 | 1.0 | 1724 | $1,125 | $0.65 | 21d | 1 | 0.42mi |
| 2237 Tuscarawas St W Canton, OH | 2.0 | 1.0 | 1035 | $700 | $0.68 | 21d | 1 | 0.44mi |
| 2237 Tuscarawas St W Unit 7 Canton, OH | 2.0 | 1.0 | 1035 | $725 | $0.70 | 43d | 1 | 0.44mi |
| 2316 2nd St SW Canton, OH | 3.0 | 1.0 | 1125 | $1,095 | $0.97 | 43d | 1 | 0.49mi |
| 202 Smith Ave SW Canton, OH | 2.0 | 1.0 | 1236 | $995 | $0.81 | 43d | 1 | 0.52mi |
| 900 Roslyn Ave SW Canton, OH | 3.0 | 1.0 | 1320 | $1,175 | $0.89 | 13d | 1 | 0.87mi |
| 2901 17th St NW Canton, OH | 2.0 | 1.0 | 1000 | $885 | $0.89 | 21d | 1 | 0.88mi |
| 1014 Roslyn Ave SW Canton, OH | 3.0 | 1.0 | 1128 | $1,150 | $1.02 | 21d | 1 | 0.95mi |
| 1023 Harrison Ave SW Canton, OH | 3.0 | 1.0 | 1224 | $1,250 | $1.02 | 21d | 1 | 0.95mi |
| 1117 Arlington Ave SW Canton, OH | 3.0 | 1.0 | 1240 | $1,200 | $0.97 | 13d | 1 | 0.98mi |
| 1137 7th St NW Canton, OH | 3.0 | 1.0 | 1736 | $1,095 | $0.63 | 43d | 1 | 0.99mi |
| 1421 Piper Ct NW Canton, OH | 3.0 | 1.5 | 1311 | $995 | $0.76 | 21d | 1 | 1.11mi |
| 1016 2nd St NW Canton, OH | 1.0–3.0 | 1.0–2.0 | 916 | $1,050 | $1.15 | 13d | 20 | 1.12mi |
| 1241 Bedford Ave SW Canton, OH | 3.0 | 2.0 | 1152 | $1,200 | $1.04 | 13d | 1 | 1.13mi |
| 1100 5th St SW Canton, OH | 4.0 | 1.0 | 1397 | $1,200 | $0.86 | 43d | 1 | 1.14mi |
| 1216 14th St NW Canton, OH | 3.0 | 1.0 | 1352 | $1,100 | $0.81 | 21d | 1 | 1.15mi |
| 1229 Lawn Ave SW Canton, OH | 2.0 | 1.0 | 936 | $950 | $1.01 | 43d | 1 | 1.18mi |
| 1224 15th St NW Unit 1 Canton, OH | 2.0 | 1.0 | 900 | $749 | $0.83 | 21d | 1 | 1.19mi |
| 1008 14th St NW Canton, OH | 3.0 | 1.5 | 1100 | $898 | $0.82 | 21d | 1 | 1.29mi |
| 1380 Garfield Ave SW Canton, OH | 2.0 | 1.0 | 1212 | $995 | $0.82 | 21d | 1 | 1.48mi |
Listing history 5 events
-
2026-05-08status Pending 111-char remark
Show marketing remark (111 chars)
Investors! 1,352 sf two-story home with three bedrooms. Large front porch. Tenant occupied $1,050 monthly rent.
-
2026-04-22$78,000 Active 111-char remark
Show marketing remark (111 chars)
Investors! 1,352 sf two-story home with three bedrooms. Large front porch. Tenant occupied $1,050 monthly rent.
-
2026-03-26historical
-
2025-09-24$100,000 Active
-
1986-04-01soldstatus $10,500
ⓘ Source: listings_history table (triggers on properties + properties_extension) + one-shot
backfill from property_details.listing_events for pre-trigger history.
Tax reassessment forecast OH · Partial reset (capped growth)
- Current annual tax
- $1,035 · $86/mo
- Projected year-2 tax
- $1,126 · $94/mo
- Expected delta
- +$91/yr (+$8/mo · 8.8%)
ⓘ Screening estimate from a state-policy table — verify with the county assessor before closing.
Climate risk First Street
- Flood 1/10 Low FEMA zone X (unshaded) · 0% chance over 30 yrs
- Wildfire 1/10 Low
- Heat 3/10 Moderate 7 d/yr ≥96°F today · 17 d/yr by 30 yrs out
- Wind 1/10 Low
- Air quality 2/10 Low 0 unhealthy d/yr today · 1 by 30 yrs out
Nearby sold comps map
Loading sold comps map…
Walkable amenities ~0.75 mi
Loading nearby amenities…
Taxation est. · year 1
- Rental income
- $12,444
- − Mortgage interest
- −$4,369
- − Property taxes
- −$1,035
- − Insurance
- −$390
- − Repairs & maintenance
- −$996
- − Management
- −$996
- − Depreciation
- −$2,269
- Taxable income
- $2,390
- Est. tax owed @ 24.0%
- −$574
- After-tax cash flow
- $2,924/yr
For passive investors: Depreciation is non-cash, so a rental often shows a tax loss while cash-flowing — sheltering income. Rental losses are passive: they offset passive income freely, and up to $25,000/yr can offset ordinary (W-2) income if you actively participate and your MAGI is under $100k (phasing out to $0 by $150k); unused losses carry forward. On sale, claimed depreciation is recaptured at up to 25%, and gains may owe capital-gains tax (a 1031 exchange can defer both). Figures are a year-1 estimate at your 24.0% rate — not tax advice; consult a CPA.
Schools (NCES district)
- District
- Canton City
- NCES district ID
- 3904371
- Math proficiency
- 17% ▼ -17.00%
- Reading proficiency
- 26% ▼ -12.00%
- Median HH income
- $28,825
- Composite
- 17.1/100
- National rank
- #9116
- State rank
- #627 of 656 in OH
Livability — Canton
- Score
- 71/100
- State rank
- #441
- US rank
- #7259
Category grades
Schools grade is shown separately in the Schools card above.
Census & demographics
- Census place
- Canton, OH
- County
- Stark County · 272,865 people
- City population
- 103,614
- Metro
- Canton-Massillon, OH
- Population (ZIP)
- 24,285
- Household income
- $63,706
- Rent vs Own
- Severe rent burden
- 725.0
Population outlook (Stark County) Hauer SSP2
- Today (2025)
- 373,708 people
- By 2030
- 371,245 · -0.7%
- By 2040
- 361,331 · -3.3%
- By 2050
- 345,290 · -7.6%
- By 2075
- 302,669 · -19.0%
- By 2100
- 238,870 · -36.1%
Race, ethnicity, and origin ACS 2023
- Neighborhood character
- Predominantly White (80%)
- Race & ethnicity
- White 80% Black 8% Two or more races 8% Hispanic / Latino 4% Asian 3%
- Common ancestry
- Italian 8% Romanian 2% Slovak 2%
- Foreign-born
- 4% · Canada, South Korea, Vietnam
- Languages at home
- 95% English-only · Spanish 2% Other Indo-European 1% Tagalog/Filipino 1%
Political lean MEDSL · Stark
- 2024 margin
- Strong R (+21.9) · D 38.6% · R 60.5%
- 2008→2024 swing
- -27.4pp toward R · 2008: 5.5pp · 2024: -21.9pp
- All cycles
- 2024: R+21.9 2020: R+18.5 2016: R+17.4 2012: R+0.4 2008: D+5.5
Not yet ingested
- Civics
- —
Market trends
- HPI YoY
- ▼ -168.35%
- Current HPI
- 206.298
- Rent YoY
- ▲ 6.73%
- Metro
- Canton-Massillon, OH
- State GDP YoY
- ▲ 1.98%
- F500 in state
- 48
Industry mix (Fortune 500 HQ in OH)
| Industry | F500 HQs | Revenue |
|---|---|---|
| Insurance | 3 | $145B |
|
||
| Industrial Machinery | 3 | $49B |
|
||
| Financial Services | 3 | $24B |
|
||
| Consumer Goods | 2 | $93B |
|
||
| Aerospace / Defense | 2 | $47B |
|
||
| Utilities | 2 | $33B |
|
||
Price history
+642.9% since first listed5 events — show timeline
- 2026-05-08 Pending — MLSNOW
- 2026-04-22 Listed $78,000 MLSNOW
- 2026-03-26 Listing Removed — MLSNOW
- 2025-09-24 Listed $100,000 MLSNOW
- 1986-04-01 Sold (Public Records) $10,500 Public Records
Property tax history
+3.5%/yrLatest (2024): $1,035 · -10.6% YoY. Source: county tax records.
Cash-flow waterfall
monthlySold comps — $/sqft
last 12 mo · ≤1 miLoading sold comps…