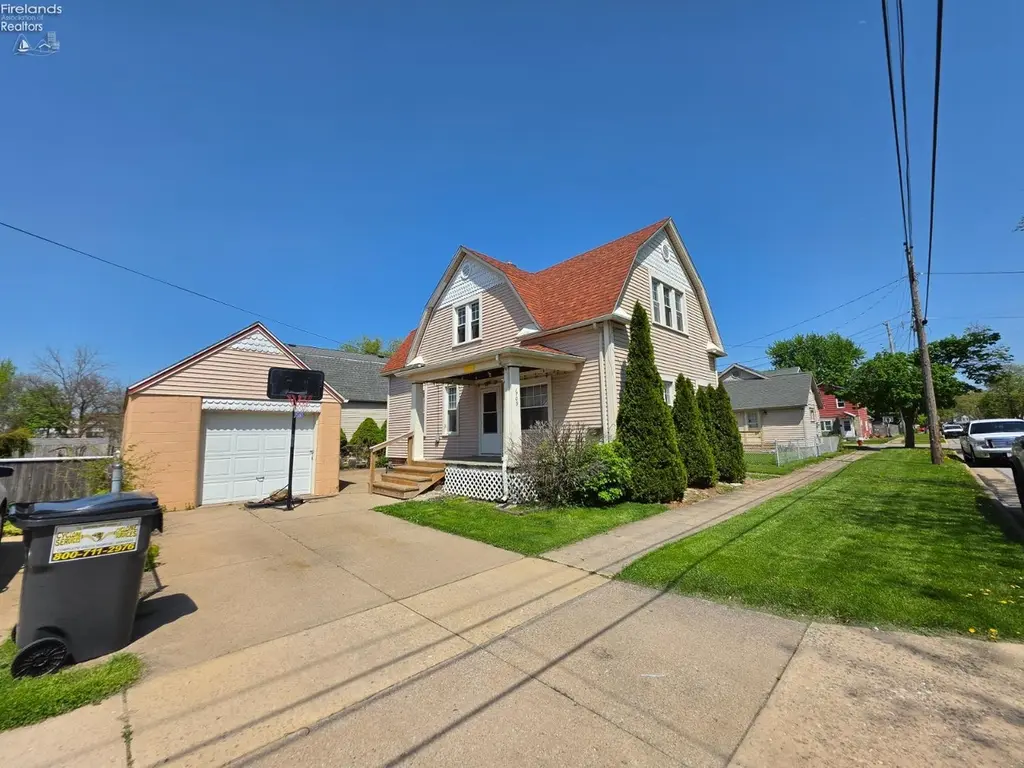
1709 Sandusky St · Sandusky, OH
Flood risk 1/10 · Minimal
- FEMA flood zone
- X (unshaded)
- Chance of flooding over 30 yrs
- 0.0%
- Est. flood insurance / yr
- $473 – $860
Fire risk 1/10 · Minimal
- Est. fire insurance / yr
- $713 – $1,323
Heat risk 3/10 · Minor
- Hot days now (above 94°F)
- 7 days/yr
- Hot days in 30 yrs
- 16 days/yr
Wind risk 2/10 · Minimal
- Chance of severe wind over 30 yrs
- —
Air-quality risk 2/10 · Minimal
- Unhealthy air days now
- 1 days/yr
- Unhealthy air days in 30 yrs
- 2 days/yr
Risk factors via First Street. Map © Google.
Why this score? — see what drove the C- grade
The composite is a weighted blend of 9 inputs, each scored 0–100. Each bar is that input's sub-score; the figure is the points it added to the 100-point composite (weight × sub-score).
- Cash flow +20.5/30.0
- ARV discount +8.3/15.0
- DSCR +6.5/10.0
- 1% rule +4.7/10.0
- Livability +4.2/5.0
- Rent growth +2.5/5.0
- Schools +2.5/10.0
- Condition / age +2.5/5.0
- Appreciation +0.0/10.0
$170,000
🖨 Deal sheet 📄 Offer letter ✓ Due diligence
Listing remarks
Welcome to 1709 Sandusky St in Sandusky, Ohio! This spacious 4-bedroom, 2-bath home offers a flexible layout with plenty of room! The main floor features 2 bedrooms, a full bathroom, a comfortable living room, and a dining room perfect for everyday living and entertaining. Upstairs, you'll find an additional family room, 2 more bedrooms, and a second full bathroom creating an ideal setup for larger households, guests, or separate living space. Next door vacant lot at 5 Sandusky St is available to bundle with 1709 Sandusky St for expanded options perfect for additional parking, a private yard, or development. (MLS #20261718)Currently arranged to act as 2 separate living spaces, there is 1 d
Key facts
- Main-floor unit
- Separate entrances
- Upper-level unit
Tags
Property features AI
Exterior
- Parking: Off-street paved parking; One garage space
- Utilities: Public water; Public sewer
- Home design: Single-family residence; Residential property
- Construction: Vinyl siding
- Exterior features: Asphalt roof; Shed on the property
Interior
- Bathrooms: Two full bathrooms
- Heating & cooling: Natural gas heating; Radiant heat
- Interior features: Total of 8 rooms; Basement laundry
- Laundry & utility: Laundry located in the basement
Neighborhood map
What this means for you Summary
Snapshot
- This is a 4-bed/2.0-bath single-family listed at $170k.
Deal economics
- At list price, monthly cash flow is $223 ($3k/yr) — positive.
- The deal already cash-flows at list — no discount required.
- To meet the 1% rule (rent ≥ 1% of price), the offer needs to be $164k (3.4% below list).
- Recommended offer: $164k (3.4% below list) — sets the bar for 1% rule.
- Cap rate 7.9% vs local median 5.4% in Sandusky — top-decile yield for the area; either an underpriced asset or a hidden risk that comps aren't pricing in. Stress-test before assuming the spread holds.
Location & tenants
- Location reads 83/100 on livability (#63 in OH, #929 nationally) — a professional / high-income tenant draw. Strengths: commute A+, cost of living A+, housing A+; Watch: crime D-, employment F.
- Sandusky City (town): math 24% / reading 37% proficiency, ranked #583 of 656 in OH (top 89%) — families likely to look elsewhere, expect single-tenant / working-renter base with shorter leases; 71% free/reduced lunch — lower-income household profile, screen leases tightly.
- Market conditions: 209 active listings in the ZIP; 1 comparable units currently listed for rent nearby; 128 units permitted in Erie County in 2024 (5 in 5+ unit buildings).
- This rent runs 32% of the median local income ($62k/yr) — at the standard rent-burdened threshold; future hikes will face affordability resistance.
Forward outlook
- Local home prices are declining (-3.0%/yr); year-one equity from $1k of loan paydown is wiped out by about $5k of value loss. Plan a longer hold.
- Erie County population projected at -15% by 2050 — secular population decline; favor cash flow + early exit over multi-decade hold.
Negotiation context
- It's been on market 56 days — a 3% lower offer ($165k) is reasonable based on typical stale-listing flexibility.
- Current owner paid $35k; list at $170k implies a 386% gain — meaningful room to come down on a strong offer.
Risks & watch-outs
- Watch-outs: built in 1950 — expect roof / HVAC / electrical / plumbing capex.
Questions for the listing agent
- It's been on market 56 days. Have you received any prior offers? Is the seller open to a 3% concession, seller financing, or rate buy-down credit?
- Built in 1950 — when were the roof, HVAC, electrical panel, plumbing, and water heater last replaced?
- Is there a deadline driving the sale (1031 exchange, divorce, estate, relocation)? That informs how much negotiation room exists.
- Crime grade is D in this area — have there been break-ins, vandalism, or insurance claims at this property in the last 3 years? What carrier currently insures it and at what premium?
- What's the average days-on-market for RENTAL listings here right now (not sales)? A rising rental-DOM trend means longer vacancies and softer asking-rent achievability than the comps imply.
- What's the recent tenant-quality profile in this submarket — average credit score on applications, eviction rate, late-payment / NSF rate, and stable-employment percentage? A property-management company in the area should have these aggregated.
- How much new for-sale + rental construction is in the pipeline within 1–3 miles? Heavy new supply typically softens prices + rents 12–24 months out; constrained supply supports both.
Investment metrics
- 1% rule
- 0.97% ✗
- Cap rate
- 7.87%
- Cash-on-cash
- 5.62%
- DSCR
- 1.25
- GRM
- 8.6
CMA / ARV
- ARV (median comp)
- $173,238
- List price
- $170,000
- Delta
- -1.87%
- Verdict
- FAIR
- Comps
- 20 within 1.0 mi
Show comp detail 12 sales within ~0.75 mi
| Address | Dist | Beds/Ba | Sqft | Sold | Price | $/sf | Match |
|---|---|---|---|---|---|---|---|
| 1017 Putnam St | 0.18mi | 3/2.0 (-1) | 1,704 (+0%) | 6mo | $110,000 | $65 | 81 |
| 533 Putnam St | 0.30mi | 3/1.5 (-1) | 1,738 (+2%) | 2mo | $137,000 | $79 | 74 |
| 1342 Camp St | 0.19mi | 4/2.0 | 1,555 (-9%) | 4mo | $211,500 | $136 | 73 |
| 1813 Sandusky St | 0.09mi | 4/1.0 | 1,553 (-9%) | 6mo | $118,000 | $76 | 72 |
| 1308 W Madison St | 0.30mi | 4/1.0 | 1,572 (-8%) | 2mo | $137,400 | $87 | 68 |
| 921 Polk St | 0.44mi | 5/1.5 (+1) | 1,680 (-1%) | 4mo | $195,000 | $116 | 67 |
| 1014 Jay St | 0.28mi | 3/2.0 (-1) | 1,590 (-7%) | 8mo | $155,000 | $97 | 64 |
| 927 W Adams St | 0.58mi | 5/2.0 (+1) | 1,792 (+5%) | 4mo | $159,000 | $89 | 56 |
| 808 Fulton St | 0.65mi | 3/1.0 (-1) | 1,784 (+5%) | 0mo | $179,500 | $101 | 52 |
| 1112 W Osborne St | 0.37mi | 3/1.0 (-1) | 1,509 (-11%) | 10mo | $148,500 | $98 | 47 |
| 325 Mcdonough St | 0.56mi | 3/1.5 (-1) | 1,506 (-12%) | 1mo | $175,500 | $117 | 47 |
| 1608 Pierce St | 0.46mi | 3/1.5 (-1) | 1,464 (-14%) | 8mo | $90,000 | $61 | 42 |
Match score weights: distance 35% · size 25% · config 20% · recency 20%. Top-matched comps best support the ARV.
Projected returns pro-forma
-3.0% appreciation · 3.0% rent growth · sell at horizon
- IRR
- -7.6%
- Equity multiple
- 0.72×
- Total profit
- $-13,393
- Equity at exit
- $25,348
- IRR
- 1.9%
- Equity multiple
- 1.14×
- Total profit
- $6,461
- Equity at exit
- $14,698
Cash invested: $47,600 (down + closing). Projections, not guarantees.
Landlord ↔ Tenant lean methodology
- Overall (STATE)
- 73 Landlord-Friendly
- State Ohio
- 73 Landlord-Friendly · R+6
- County
- — inherits STATE
- City
- — inherits STATE
ZIP-level market 44870
- Active inventory
- 209
- Price-to-rent
- 8.6×
Monthly cashflow live
- Estimated rent
- $1,642 medium interval (Pro) →
- Mortgage (P&I)
- −$891
- Tax from tax record
- −$112 /mo · $1,341/yr
- Insurance
- −$71
- HOA
- −$0
- Vacancy / Maint / Mgmt
- −$345
- Net cashflow
- $223
Break-even live
UW: 25.0% down · 7.5% · 30yr · 1.5% tax · 5.0% vac · 8.0% maint · 8.0% mgmt
Financing live
Cash to close
- Down payment
- $42,500
- Closing costs
- $5,100
- Reserves months
- —
- Total cash needed
- —
Loan-product check · same deal, 3 products live
Conventional
25% down · 7.5% · 30yr
- Down + closing
- —
- Monthly P&I
- —
- Monthly cashflow
- —
- DSCR
- —
- Eligible?
- —
Personal DTI + credit; lowest rate.
DSCR
20% down · 8.5% · 30yr
- Down + closing
- —
- Monthly P&I
- —
- Monthly cashflow
- —
- DSCR
- —
- Eligible?
- —
No personal income docs; deal must DSCR.
Hard money
10% down · 12.0% · 12mo
- Down + closing
- —
- Monthly P&I
- —
- Monthly cashflow
- —
- DSCR
- —
- Eligible?
- —
Short-term bridge; refi at stabilization.
Rent comps 1 comps
| Address | Beds | Baths | Sqft | Rent | $/sqft | DOM | Units | Dist |
|---|---|---|---|---|---|---|---|---|
| 1032 Perry St Sandusky, OH | 4.0 | 2.5 | 1845 | $850 | $0.46 | 43d | 1 | 1.40mi |
Listing history 17 events
-
2026-06-19days on market $170,000 Active 56 DOM
-
2026-06-18days on market $170,000 Active 55 DOM
-
2026-06-17days on market $170,000 Active 54 DOM
-
2026-06-16days on market $170,000 Active 53 DOM
-
2026-06-15days on market $170,000 Active 52 DOM
-
2026-06-14days on market $170,000 Active 50 DOM
-
2026-06-12days on market $170,000 Active 49 DOM
-
2026-06-09days on market $170,000 Active 46 DOM
-
2026-06-08days on market $170,000 Active 45 DOM
-
2026-06-07days on market $170,000 Active 44 DOM
-
2026-06-03days on market $170,000 Active 40 DOM
-
2026-06-02days on market $170,000 Active 39 DOM
-
2026-06-01days on market $170,000 Active 38 DOM
-
2026-05-31days on market $170,000 Active 37 DOM
-
2026-05-30days on market $170,000 Active 36 DOM
-
2026-04-24$170,000 Active 1184-char remark
-
1996-02-23soldstatus $35,000
ⓘ Source: listings_history table (triggers on properties + properties_extension) + one-shot
backfill from property_details.listing_events for pre-trigger history.
Tax reassessment forecast OH · Partial reset (capped growth)
- Current annual tax
- $1,341 · $112/mo
- Projected year-2 tax
- $1,997 · $166/mo
- Expected delta
- +$655/yr (+$55/mo · 48.8%)
ⓘ Screening estimate from a state-policy table — verify with the county assessor before closing.
Climate risk First Street
- Flood 1/10 Low FEMA zone X (unshaded) · 0% chance over 30 yrs
- Wildfire 1/10 Low
- Heat 3/10 Moderate 7 d/yr ≥94°F today · 16 d/yr by 30 yrs out
- Wind 2/10 Low
- Air quality 2/10 Low 1 unhealthy d/yr today · 2 by 30 yrs out
Nearby sold comps map
Loading sold comps map…
Walkable amenities ~0.75 mi
Loading nearby amenities…
Taxation est. · year 1
- Rental income
- $19,700
- − Mortgage interest
- −$9,523
- − Property taxes
- −$1,341
- − Insurance
- −$850
- − Repairs & maintenance
- −$1,576
- − Management
- −$1,576
- − Depreciation
- −$4,945
- Taxable loss
- −$111
- Est. tax savings @ 24.0%
- +$27
- After-tax cash flow
- $2,701/yr
For passive investors: Depreciation is non-cash, so a rental often shows a tax loss while cash-flowing — sheltering income. Rental losses are passive: they offset passive income freely, and up to $25,000/yr can offset ordinary (W-2) income if you actively participate and your MAGI is under $100k (phasing out to $0 by $150k); unused losses carry forward. On sale, claimed depreciation is recaptured at up to 25%, and gains may owe capital-gains tax (a 1031 exchange can defer both). Figures are a year-1 estimate at your 24.0% rate — not tax advice; consult a CPA.
Schools (NCES district)
- District
- Sandusky City
- NCES district ID
- 3904474
- Math proficiency
- 24% ▼ -17.00%
- Reading proficiency
- 37% ▼ -9.00%
- Median HH income
- $34,583
- Composite
- 25.1/100
- National rank
- #7532
- State rank
- #583 of 656 in OH
Livability — Sandusky
- Score
- 83/100
- State rank
- #63
- US rank
- #929
Category grades
Schools grade is shown separately in the Schools card above.
Census & demographics
- Census place
- Sandusky, OH
- County
- Erie County · 39,883 people
- City population
- 39,883
- Metro
- Sandusky, OH
- Population (ZIP)
- 39,883
- Household income
- $62,082
- Rent vs Own
- Severe rent burden
- 1602.0
Population outlook (Erie County) Hauer SSP2
- Today (2025)
- 73,204 people
- By 2030
- 71,341 · -2.5%
- By 2040
- 66,771 · -8.8%
- By 2050
- 62,512 · -14.6%
- By 2075
- 56,154 · -23.3%
- By 2100
- 49,045 · -33.0%
Race, ethnicity, and origin ACS 2023
- Neighborhood character
- Predominantly White (72%)
- Race & ethnicity
- White 72% Black 15% Two or more races 8% Hispanic / Latino 5%
- Common ancestry
- Romanian 3% Slovak 2% Subsaharan African 1%
- Foreign-born
- 1% · Canada
- Languages at home
- 96% English-only · Spanish 2%
Political lean MEDSL · Erie
- 2024 margin
- R (+14.1) · D 42.5% · R 56.6%
- 2008→2024 swing
- -28.0pp toward R · 2008: 13.9pp · 2024: -14.1pp
- All cycles
- 2024: R+14.1 2020: R+11.6 2016: R+9.8 2012: D+11.3 2008: D+13.9
Not yet ingested
- Civics
- —
Market trends
- HPI YoY
- ▼ -151.99%
- Current HPI
- 209.6383
- Rent YoY
- —
- Metro
- Sandusky, OH
- State GDP YoY
- ▲ 1.98%
- F500 in state
- 48
Industry mix (Fortune 500 HQ in OH)
| Industry | F500 HQs | Revenue |
|---|---|---|
| Insurance | 3 | $145B |
|
||
| Industrial Machinery | 3 | $49B |
|
||
| Financial Services | 3 | $24B |
|
||
| Consumer Goods | 2 | $93B |
|
||
| Aerospace / Defense | 2 | $47B |
|
||
| Utilities | 2 | $33B |
|
||
Price history
+385.7% since first listed2 events — show timeline
- 2026-04-24 Listed $170,000 FAOR
- 1996-02-23 Sold (Public Records) $35,000 Public Records
Property tax history
+0.4%/yrLatest (2025): $1,341 · -1.0% YoY. Source: county tax records.
Cash-flow waterfall
monthlySold comps — $/sqft
last 12 mo · ≤1 miLoading sold comps…