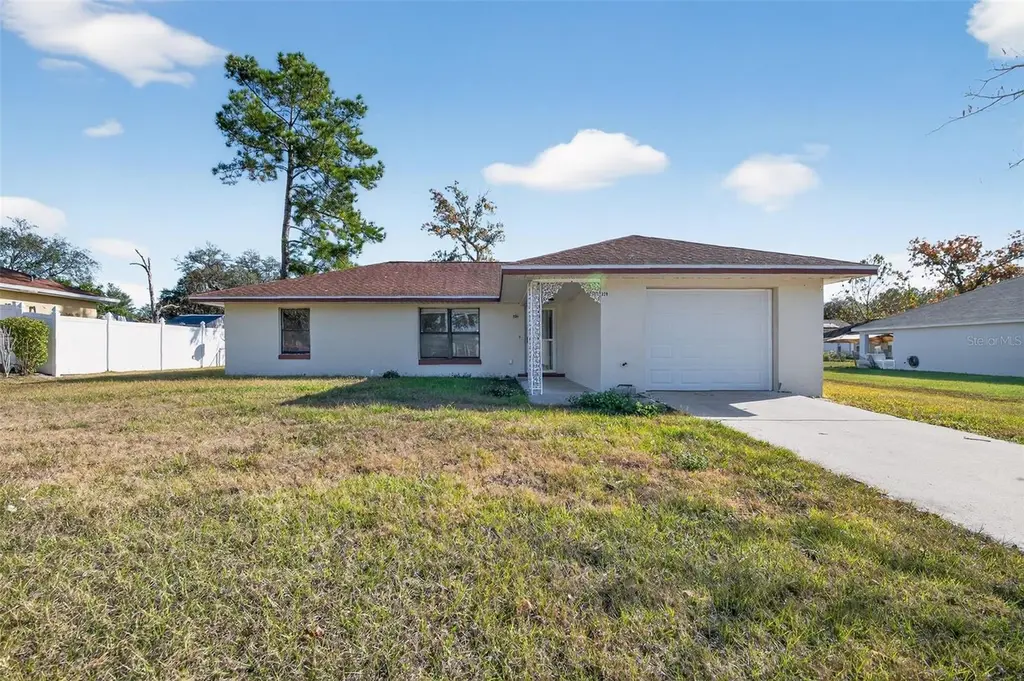
329 Marion Oaks Crse · Marion Oaks, FL
Flood risk 1/10 · Minimal
- FEMA flood zone
- X (unshaded)
- Chance of flooding over 30 yrs
- 0.0%
- Est. flood insurance / yr
- $507 – $1,088
Fire risk 4/10 · Minor
- Est. fire insurance / yr
- $947 – $1,759
Heat risk 8/10 · Major
- Hot days now (above 108°F)
- 7 days/yr
- Hot days in 30 yrs
- 22 days/yr
Wind risk 9/10 · Severe
- Chance of severe wind over 30 yrs
- 99.0%
Air-quality risk 3/10 · Minor
- Unhealthy air days now
- 2 days/yr
- Unhealthy air days in 30 yrs
- 4 days/yr
Risk factors via First Street. Map © Google.
Why this score? — see what drove the C grade
The composite is a weighted blend of 9 inputs, each scored 0–100. Each bar is that input's sub-score; the figure is the points it added to the 100-point composite (weight × sub-score).
- Cash flow +20.2/30.0
- ARV discount +15.0/15.0
- DSCR +6.4/10.0
- 1% rule +5.5/10.0
- Schools +3.6/10.0
- Livability +2.5/5.0
- Condition / age +2.5/5.0
- Rent growth +2.3/5.0
- Appreciation +0.0/10.0
$175,000
🖨 Deal sheet 📄 Offer letter ✓ Due diligence
Listing remarks MLS
Make us an offer we cant refuse. Seller says, sell. This home offers a fantastic floorplan on a great lot, ready for your vision. Featuring a new roof and garage door, its a perfect canvas for your updates and personalization. With 3 bedrooms and 2 baths the layout provides plenty of space, while the location in desirable Marion Oaks adds unbeatable value. Bring your creativity and make this property shine--Whether as a starter home, investment property, or forever place.
Key facts
- Great lot
- Garage door
- New roof
Tags
Neighborhood map
What this means for you Summary
Snapshot
- This is a 3-bed/2.0-bath single-family listed at $175k.
Deal economics
- At list price, monthly cash flow is $221 ($3k/yr) — positive.
- The deal already cash-flows at list — no discount required.
- Meets the 1% rule at list price ($2k rent vs $175k).
- Recommended offer: $154k (12.0% below list) — sets the bar for market timing.
- Cap rate 7.8% vs local median 4.8% in Marion Oaks — top-decile yield for the area; either an underpriced asset or a hidden risk that comps aren't pricing in. Stress-test before assuming the spread holds.
Location & tenants
- Location reads: area grade C — affects rentability + tenant quality, not the cash-flow math above.
- Marion (rural): math 42% / reading 43% proficiency, ranked #61 of 73 in FL (top 84%) — families likely to look elsewhere, expect single-tenant / working-renter base with shorter leases; 61% free/reduced lunch — lower-income household profile, screen leases tightly.
- Market conditions: Rents soft (-0.7%/yr); 1355 active listings in the ZIP; 17 comparable units currently listed for rent nearby; rentals leasing fast (median 14d on market — plan ~1-2 weeks tenant-placement turnaround); 7,071 units permitted in Marion County in 2024 (534 in 5+ unit buildings).
- This rent runs 30% of the median local income ($72k/yr) — at the standard rent-burdened threshold; future hikes will face affordability resistance.
Forward outlook
- Local home prices are declining (-3.0%/yr); year-one equity from $1k of loan paydown is wiped out by about $5k of value loss. Plan a longer hold.
- Marion County population projected at +13% by 2050 — modest demand growth; plan on rents tracking national, not racing it.
Negotiation context
- It's been on market 183 days — a 12% lower offer ($154k) is reasonable based on typical stale-listing flexibility.
- Current owner paid $112k; list at $175k implies a 56% gain — meaningful room to come down on a strong offer.
Risks & watch-outs
- Climate carrying-cost: severe wind risk, 99% chance of damaging wind over 30y; extreme-heat days projected 7→22/yr by 2055 (HVAC capex compounding) — expect insurance premiums to compound above CPI over the hold.
Questions for the listing agent
- It's been on market 183 days. Have you received any prior offers? Is the seller open to a 12% concession, seller financing, or rate buy-down credit?
- Why hasn't it sold? Are there any deal-killer items the seller is aware of (foundation, flood, title, zoning, code violations)?
- Is there a deadline driving the sale (1031 exchange, divorce, estate, relocation)? That informs how much negotiation room exists.
- What's the average days-on-market for RENTAL listings here right now (not sales)? A rising rental-DOM trend means longer vacancies and softer asking-rent achievability than the comps imply.
- What's the recent tenant-quality profile in this submarket — average credit score on applications, eviction rate, late-payment / NSF rate, and stable-employment percentage? A property-management company in the area should have these aggregated.
- How much new for-sale + rental construction is in the pipeline within 1–3 miles? Heavy new supply typically softens prices + rents 12–24 months out; constrained supply supports both.
Investment metrics
- 1% rule
- 1.05% ✓
- Cap rate
- 7.81%
- Cash-on-cash
- 5.40%
- DSCR
- 1.24
- GRM
- 8.0
CMA / ARV
- ARV (median comp)
- $231,383
- List price
- $175,000
- Delta
- -24.37%
- Verdict
- UNDERPRICED
- Comps
- 20 within 1.0 mi
Show comp detail 9 sales within ~0.75 mi
| Address | Dist | Beds/Ba | Sqft | Sold | Price | $/sf | Match |
|---|---|---|---|---|---|---|---|
| 4756 SW 143rd Loop | 0.18mi | 3/2.0 | 1,228 (+6%) | 23mo | $276,000 | $225 | 62 |
| 14425 SW 38th Terrace Rd | 0.62mi | 3/1.0 | 1,044 (-10%) | 1mo | $165,000 | $158 | 51 |
| 15068 SW 43rd Ct | 0.57mi | 3/2.0 | 1,246 (+8%) | 16mo | $250,000 | $201 | 47 |
| 14540 SW 35th Terrace Rd | 0.70mi | 3/2.0 | 1,104 (-4%) | 18mo | $199,000 | $180 | 45 |
| 14746 SW 41st Avenue Rd | 0.47mi | 3/1.0 | 1,044 (-10%) | 16mo | $215,000 | $206 | 45 |
| 173 Marion Oaks Ln | 0.56mi | 2/2.0 (-1) | 1,289 (+12%) | 15mo | $159,000 | $123 | 37 |
| 14040 SW 48th Avenue Rd | 0.55mi | 3/2.0 | 1,324 (+15%) | 20mo | $250,000 | $189 | 33 |
| 15298 SW 43rd Avenue Rd | 0.72mi | 3/2.0 | 1,315 (+14%) | 15mo | $256,400 | $195 | 31 |
| 14530 SW 35th Terrace Rd | 0.69mi | 2/2.0 (-1) | 1,325 (+15%) | 18mo | $199,000 | $150 | 23 |
Match score weights: distance 35% · size 25% · config 20% · recency 20%. Top-matched comps best support the ARV.
Projected returns pro-forma
-3.0% appreciation · 0.0% rent growth · sell at horizon
- IRR
- -11.4%
- Equity multiple
- 0.60×
- Total profit
- $-19,635
- Equity at exit
- $26,093
- IRR
- -7.3%
- Equity multiple
- 0.60×
- Total profit
- $-19,583
- Equity at exit
- $15,131
Cash invested: $49,000 (down + closing). Projections, not guarantees.
Landlord ↔ Tenant lean methodology
- Overall (STATE)
- 87 Strongly Landlord-Friendly
- State Florida
- 87 Strongly Landlord-Friendly · R+3
- County
- — inherits STATE
- City
- — inherits STATE
ZIP-level market 34473
- Home prices YoY
- -16.8%
- Rents YoY
- -0.7%
- Active inventory
- 1355
- Price-to-rent
- 8.0×
Monthly cashflow live
- Estimated rent
- $1,830 high interval (Pro) →
- Mortgage (P&I)
- −$918
- Tax from tax record
- −$235 /mo · $2,816/yr
- Insurance
- −$73
- HOA
- −$0
- Vacancy / Maint / Mgmt
- −$384
- Net cashflow
- $221
Break-even live
UW: 25.0% down · 7.5% · 30yr · 1.5% tax · 5.0% vac · 8.0% maint · 8.0% mgmt
Financing live
Cash to close
- Down payment
- $43,750
- Closing costs
- $5,250
- Reserves months
- —
- Total cash needed
- —
Loan-product check · same deal, 3 products live
Conventional
25% down · 7.5% · 30yr
- Down + closing
- —
- Monthly P&I
- —
- Monthly cashflow
- —
- DSCR
- —
- Eligible?
- —
Personal DTI + credit; lowest rate.
DSCR
20% down · 8.5% · 30yr
- Down + closing
- —
- Monthly P&I
- —
- Monthly cashflow
- —
- DSCR
- —
- Eligible?
- —
No personal income docs; deal must DSCR.
Hard money
10% down · 12.0% · 12mo
- Down + closing
- —
- Monthly P&I
- —
- Monthly cashflow
- —
- DSCR
- —
- Eligible?
- —
Short-term bridge; refi at stabilization.
Rent comps 17 comps
| Address | Beds | Baths | Sqft | Rent | $/sqft | DOM | Units | Dist |
|---|---|---|---|---|---|---|---|---|
| 14614 SW 46th Ct Ocala, FL | 3.0 | 2.0 | 1200 | $1,800 | $1.50 | 21d | 1 | 0.14mi |
| 14525 SW 42nd Terrace Rd Ocala, FL | 3.0 | 2.0 | 1344 | $1,850 | $1.38 | 13d | 1 | 0.24mi |
| 4309 SW 143rd Lane Rd Ocala, FL | 3.0 | 2.0 | 1238 | $1,799 | $1.45 | 13d | 1 | 0.33mi |
| 14193 SW 44th Ct Ocala, FL | 3.0 | 2.0 | 1449 | $1,599 | $1.10 | 13d | 1 | 0.39mi |
| 14965 SW 48th Ave Ocala, FL | 4.0 | 2.0 | 1342 | $1,700 | $1.27 | 13d | 1 | 0.55mi |
| 251 Marion Oaks Crse Ocala, FL | 3.0 | 2.0 | 1373 | $1,795 | $1.31 | 21d | 1 | 0.57mi |
| 15018 SW 48th Ave Ocala, FL | 3.0 | 2.0 | 1413 | $1,625 | $1.15 | 13d | 1 | 0.58mi |
| 15095 SW 51st Ter Ocala, FL | 3.0 | 2.0 | 1196 | $1,500 | $1.25 | 13d | 1 | 0.77mi |
| 14430 SW 34th Terrace Rd Ocala, FL | 2.0 | 2.0 | 1025 | $1,350 | $1.32 | 13d | 1 | 0.78mi |
| 13805 SW 43rd Cir Ocala, FL | 4.0 | 2.0 | 1494 | $1,800 | $1.20 | 21d | 1 | 0.82mi |
| 4004 SW 138th Pl Ocala, FL | 3.0 | 2.0 | 1348 | $1,695 | $1.26 | 21d | 1 | 0.83mi |
| 13731 SW 40th Cir Ocala, FL | 3.0 | 2.0 | 1463 | $1,695 | $1.16 | 13d | 1 | 0.95mi |
| 14856 SW 35th Cir Ocala, FL | 2.0 | 2.0 | 1036 | $1,450 | $1.40 | 13d | 1 | 0.98mi |
| 3567 SW 151st St Ocala, FL | 2.0 | 2.0 | 1126 | $1,450 | $1.29 | 21d | 1 | 1.10mi |
| 5541 SW 153rd Street Rd Ocala, FL | 3.0 | 2.0 | 1357 | $1,700 | $1.25 | 13d | 1 | 1.13mi |
| 3313 SW 147th St Ocala, FL | 2.0 | 2.0 | 1121 | $1,400 | $1.25 | 21d | 1 | 1.18mi |
| 14257 SW 60th Ter #1 Ocala, FL | 3.0 | 2.0 | 1215 | $2,400 | $1.98 | 13d | 1 | 1.33mi |
Listing history 21 events
-
2026-06-18days on market $175,000 Active 183 DOM
-
2026-06-17days on market $175,000 Active 182 DOM
-
2026-06-16days on market $175,000 Active 181 DOM
-
2026-06-15days on market $175,000 Active 180 DOM
-
2026-06-14days on market $175,000 Active 178 DOM
-
2026-06-13pricedays on market $175,000 Active 177 DOM
-
2026-06-10days on market $199,990 Active 175 DOM
-
2026-06-09days on market $199,990 Active 174 DOM
-
2026-06-08days on market $199,990 Active 173 DOM
-
2026-06-07days on market $199,990 Active 172 DOM
-
2026-06-03days on market $199,990 Active 168 DOM
-
2026-06-02days on market $199,990 Active 167 DOM
-
2026-05-31days on market $199,990 Active 165 DOM
-
2026-05-30days on market $199,990 Active 164 DOM
-
2026-04-29price $199,990 476-char remark
Show marketing remark (476 chars)
Make us an offer we cant refuse. Seller says, sell. This home offers a fantastic floorplan on a great lot, ready for your vision. Featuring a new roof and garage door, its a perfect canvas for your updates and personalization. With 3 bedrooms and 2 baths the layout provides plenty of space, while the location in desirable Marion Oaks adds unbeatable value. Bring your creativity and make this property shine--Whether as a starter home, investment property, or forever place.
-
2026-03-10price $214,990 476-char remark
Show marketing remark (476 chars)
Make us an offer we cant refuse. Seller says, sell. This home offers a fantastic floorplan on a great lot, ready for your vision. Featuring a new roof and garage door, its a perfect canvas for your updates and personalization. With 3 bedrooms and 2 baths the layout provides plenty of space, while the location in desirable Marion Oaks adds unbeatable value. Bring your creativity and make this property shine--Whether as a starter home, investment property, or forever place.
-
2026-02-09price $224,990 476-char remark
Show marketing remark (476 chars)
Make us an offer we cant refuse. Seller says, sell. This home offers a fantastic floorplan on a great lot, ready for your vision. Featuring a new roof and garage door, its a perfect canvas for your updates and personalization. With 3 bedrooms and 2 baths the layout provides plenty of space, while the location in desirable Marion Oaks adds unbeatable value. Bring your creativity and make this property shine--Whether as a starter home, investment property, or forever place.
-
2025-12-17$230,000 Active 476-char remark
Show marketing remark (476 chars)
Make us an offer we cant refuse. Seller says, sell. This home offers a fantastic floorplan on a great lot, ready for your vision. Featuring a new roof and garage door, its a perfect canvas for your updates and personalization. With 3 bedrooms and 2 baths the layout provides plenty of space, while the location in desirable Marion Oaks adds unbeatable value. Bring your creativity and make this property shine--Whether as a starter home, investment property, or forever place.
-
2006-02-13soldstatus $112,000
-
2005-03-23soldstatus $84,000
-
2001-05-25soldstatus $43,000
ⓘ Source: listings_history table (triggers on properties + properties_extension) + one-shot
backfill from property_details.listing_events for pre-trigger history.
Tax reassessment forecast FL · Resets to sale price
- Current annual tax
- $2,816 · $235/mo
- Projected year-2 tax
- $2,816 · $235/mo
- Expected delta
- $0/yr ($0/mo · 0.0%)
ⓘ Screening estimate from a state-policy table — verify with the county assessor before closing.
Climate risk First Street
- Flood 1/10 Low FEMA zone X (unshaded) · 0% chance over 30 yrs
- Wildfire 4/10 Moderate
- Heat 8/10 Severe 7 d/yr ≥108°F today · 22 d/yr by 30 yrs out
- Wind 9/10 Extreme 99% chance of damaging wind over 30 yrs
- Air quality 3/10 Moderate 2 unhealthy d/yr today · 4 by 30 yrs out
Nearby sold comps map
Loading sold comps map…
Walkable amenities ~0.75 mi
Loading nearby amenities…
Taxation est. · year 1
- Rental income
- $21,963
- − Mortgage interest
- −$9,803
- − Property taxes
- −$2,816
- − Insurance
- −$875
- − Repairs & maintenance
- −$1,757
- − Management
- −$1,757
- − Depreciation
- −$5,091
- Taxable loss
- −$136
- Est. tax savings @ 24.0%
- +$33
- After-tax cash flow
- $2,680/yr
For passive investors: Depreciation is non-cash, so a rental often shows a tax loss while cash-flowing — sheltering income. Rental losses are passive: they offset passive income freely, and up to $25,000/yr can offset ordinary (W-2) income if you actively participate and your MAGI is under $100k (phasing out to $0 by $150k); unused losses carry forward. On sale, claimed depreciation is recaptured at up to 25%, and gains may owe capital-gains tax (a 1031 exchange can defer both). Figures are a year-1 estimate at your 24.0% rate — not tax advice; consult a CPA.
Schools (NCES district)
- District
- Marion
- NCES district ID
- 1201260
- Math proficiency
- 42% ▼ -7.00%
- Reading proficiency
- 43% ▼ -4.00%
- Median HH income
- $40,015
- Composite
- 35.61/100
- National rank
- #4890
- State rank
- #61 of 73 in FL
Livability — Marion Oaks
No livability data for this city. (Only ~50 U.S. cities are tracked.)
Census & demographics
- Census place
- Marion Oaks, FL
- County
- Marion County · 315,796 people
- City population
- 25,030
- Metro
- Ocala, FL
- Population (ZIP)
- 26,813
- Household income
- $72,366
- Rent vs Own
- Severe rent burden
- 228.0
Population outlook (Marion County) Hauer SSP2
- Today (2025)
- 365,905 people
- By 2030
- 376,768 · +3.0%
- By 2040
- 396,555 · +8.4%
- By 2050
- 412,723 · +12.8%
- By 2075
- 446,090 · +21.9%
- By 2100
- 436,193 · +19.2%
Race, ethnicity, and origin ACS 2023
- Neighborhood character
- Diverse neighborhood (Simpson 0.69)
- Race & ethnicity
- White 34% Black 33% Hispanic / Latino 29% Two or more races 19% Asian 1%
- Hispanic origin (detail)
- Mexican 1% Puerto Rican 17% Cuban 3%
- Common ancestry
- Hispanic 3% Portuguese 2% Romanian 1%
- Foreign-born
- 17% · Canada, Jamaica
- Languages at home
- 67% English-only · Spanish 27% French/Haitian/Cajun 4% Other Indo-European 1%
Political lean MEDSL · Marion
- 2024 margin
- Solid R (+31.6) · D 33.8% · R 65.5%
- 2008→2024 swing
- -20.0pp toward R · 2008: -11.6pp · 2024: -31.6pp
- All cycles
- 2024: R+31.6 2020: R+25.9 2016: R+26.2 2012: R+16.2 2008: R+11.6
Not yet ingested
- Civics
- —
Market trends
- HPI YoY
- ▼ -45.25%
- Current HPI
- 224.3536
- Rent YoY
- ▼ -0.67%
- Metro
- Ocala, FL
- State GDP YoY
- ▲ 3.28%
- F500 in state
- 36
Industry mix (Fortune 500 HQ in FL)
| Industry | F500 HQs | Revenue |
|---|---|---|
| Industrial Technology | 2 | $29B |
|
||
| Insurance | 2 | $17B |
|
||
| Retail | 1 | $60B |
|
||
| Technology Distribution | 1 | $58B |
|
||
| Homebuilding | 1 | $35B |
|
||
| Technology Manufacturing | 1 | $35B |
|
||
Price history
+365.1% since first listed7 events — show timeline
- 2026-04-29 Price Changed $199,990 Stellar MLS as Distributed by MLS Grid
- 2026-03-10 Price Changed $214,990 Stellar MLS as Distributed by MLS Grid
- 2026-02-09 Price Changed $224,990 Stellar MLS as Distributed by MLS Grid
- 2025-12-17 Listed $230,000 Stellar MLS as Distributed by MLS Grid
- 2006-02-13 Sold (Public Records) $112,000 Public Records
- 2005-03-23 Sold (Public Records) $84,000 Public Records
- 2001-05-25 Sold (Public Records) $43,000 Public Records
Property tax history
+8.7%/yrLatest (2025): $2,816 · +13.7% YoY. Source: county tax records.
Cash-flow waterfall
monthlySold comps — $/sqft
last 12 mo · ≤1 miLoading sold comps…