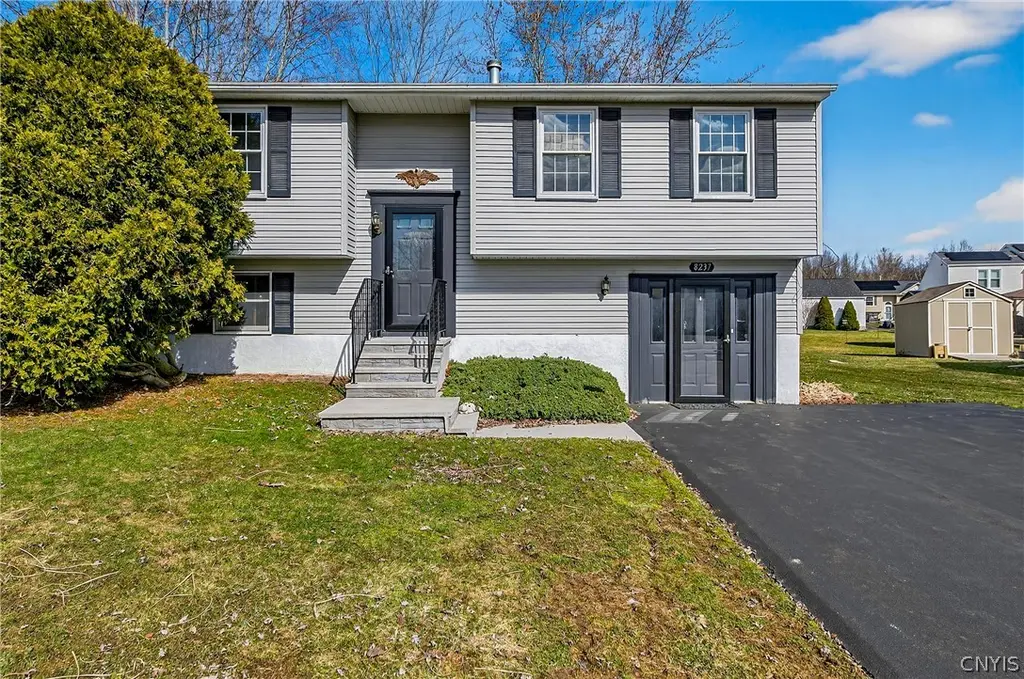
8237 Mantova Dr · North Syracuse, NY
Flood risk 1/10 · Minimal
- FEMA flood zone
- X (unshaded)
- Chance of flooding over 30 yrs
- 0.0%
- Est. flood insurance / yr
- $473 – $860
Fire risk 2/10 · Minimal
- Est. fire insurance / yr
- $691 – $1,283
Heat risk 3/10 · Minor
- Hot days now (above 95°F)
- 7 days/yr
- Hot days in 30 yrs
- 16 days/yr
Wind risk 1/10 · Minimal
- Chance of severe wind over 30 yrs
- 0.0%
Air-quality risk 2/10 · Minimal
- Unhealthy air days now
- 1 days/yr
- Unhealthy air days in 30 yrs
- 1 days/yr
Risk factors via First Street. Map © Google.
Why this score? — see what drove the C grade
The composite is a weighted blend of 9 inputs, each scored 0–100. Each bar is that input's sub-score; the figure is the points it added to the 100-point composite (weight × sub-score).
- Cash flow +19.1/30.0
- ARV discount +14.2/15.0
- DSCR +6.0/10.0
- 1% rule +5.4/10.0
- Schools +4.2/10.0
- Livability +3.6/5.0
- Rent growth +2.5/5.0
- Condition / age +2.5/5.0
- Appreciation +0.0/10.0
$265,000
🖨 Deal sheet 📄 Offer letter ✓ Due diligence
Listing remarks
Lovingly maintained by its original owner, this spacious 4-bedroom, 2 full bath raised ranch offers flexibility, comfort, and room to fit a variety of lifestyles. The pride of ownership is evident throughout, making this a home that has truly been cherished for years. The main level features hardwood floors, a bright and spacious family room, an inviting kitchen with rich dark cabinetry, granite countertops, and newer appliances, along with three bedrooms and a full bath. The lower level has been thoughtfully configured to offer exceptional versatility. Previously used as an in-law suite, this space includes a bedroom, sitting area, small kitchenette, full bath with stand-up shower, full la
Key facts
- Inviting kitchen
- In-law suite
- Bright family room
Tags
Neighborhood map
What this means for you Summary
Snapshot
- This is a 3-bed/1.0-bath single-family listed at $265k.
Deal economics
- At list price, monthly cash flow is $282 ($3k/yr) — positive.
- The deal already cash-flows at list — no discount required.
- Meets the 1% rule at list price ($3k rent vs $265k).
- Recommended offer: $261k (1.5% below list) — sets the bar for market timing.
- Cap rate 7.6% vs local median 5.1% in North Syracuse — top-decile yield for the area; either an underpriced asset or a hidden risk that comps aren't pricing in. Stress-test before assuming the spread holds.
Location & tenants
- Location reads 72/100 on livability (#379 in NY) — a middle-class / working-renter tenant base. Strengths: housing A+, health & safety A+, cost of living A; Watch: schools C-, crime D, amenities F.
- North Syracuse Central School District (suburban): math 45% / reading 50% proficiency, ranked #402 of 590 in NY (top 68%) — families likely to look elsewhere, expect single-tenant / working-renter base with shorter leases.
- Market conditions: 63 active listings in the ZIP; 4 comparable units currently listed for rent nearby; rentals at typical pace (median 21d on market — plan ~3-4 weeks tenant-placement turnaround); 616 units permitted in Onondaga County in 2024 (256 in 5+ unit buildings).
Forward outlook
- Local home prices are declining (-3.0%/yr); year-one equity from $2k of loan paydown is wiped out by about $8k of value loss. Plan a longer hold.
- Onondaga County population projected to shrink 9% by 2050 — rents likely to lag national; underwrite the cash flow, not the appreciation.
Negotiation context
- It's been on market 21 days — a 2% lower offer ($261k) is reasonable based on typical stale-listing flexibility.
Questions for the listing agent
- Is there a deadline driving the sale (1031 exchange, divorce, estate, relocation)? That informs how much negotiation room exists.
- Crime grade is D in this area — have there been break-ins, vandalism, or insurance claims at this property in the last 3 years? What carrier currently insures it and at what premium?
- What's the average days-on-market for RENTAL listings here right now (not sales)? A rising rental-DOM trend means longer vacancies and softer asking-rent achievability than the comps imply.
- What's the recent tenant-quality profile in this submarket — average credit score on applications, eviction rate, late-payment / NSF rate, and stable-employment percentage? A property-management company in the area should have these aggregated.
- How much new for-sale + rental construction is in the pipeline within 1–3 miles? Heavy new supply typically softens prices + rents 12–24 months out; constrained supply supports both.
Investment metrics
- 1% rule
- 1.04% ✓
- Cap rate
- 7.57%
- Cash-on-cash
- 4.56%
- DSCR
- 1.20
- GRM
- 8.0
CMA / ARV
- ARV (on-the-fly)
- $311,712
- Comps found
- 12
Show comp detail 12 sales within ~0.75 mi
| Address | Dist | Beds/Ba | Sqft | Sold | Price | $/sf | Match |
|---|---|---|---|---|---|---|---|
| 8237 Mantova Dr | 0.00mi | 4/2.0 (+1) | 1,632 (0%) | 0mo | $268,250 | $164 | 91 |
| 5317 Fortuna Pkwy | 0.15mi | 3/2.5 | 1,520 (-7%) | 4mo | $300,000 | $197 | 73 |
| 8046 Bamm Hollow Rd | 0.42mi | 3/1.5 | 1,552 (-5%) | 1mo | $315,000 | $203 | 69 |
| 8221 Lucchesi Dr | 0.25mi | 3/2.0 | 1,500 (-8%) | 5mo | $270,000 | $180 | 66 |
| 8025 Bamm Hollow Rd | 0.44mi | 3/2.0 | 1,700 (+4%) | 4mo | $300,000 | $176 | 65 |
| 8104 Maple Rd | 0.75mi | 3/1.0 | 1,660 (+2%) | 0mo | $295,000 | $178 | 62 |
| 5722 Boulia Dr | 0.21mi | 4/2.0 (+1) | 1,856 (+14%) | 2mo | $355,000 | $191 | 57 |
| 5182 Novara Ln | 0.52mi | 3/1.5 | 1,794 (+10%) | 1mo | $370,000 | $206 | 57 |
| 8133 Duncowing Ln | 0.40mi | 4/2.0 (+1) | 1,520 (-7%) | 6mo | $250,000 | $164 | 56 |
| 8175 Caughdenoy Rd | 0.56mi | 3/1.5 | 1,468 (-10%) | 3mo | $280,900 | $191 | 52 |
| 8196 Rizzo Dr | 0.51mi | 4/1.5 (+1) | 1,404 (-14%) | 2mo | $330,000 | $235 | 44 |
| 5496 Tobin Path | 0.62mi | 3/2.0 | 1,400 (-14%) | 1mo | $410,000 | $293 | 42 |
Match score weights: distance 35% · size 25% · config 20% · recency 20%. Top-matched comps best support the ARV.
Projected returns pro-forma
-3.0% appreciation · 3.0% rent growth · sell at horizon
- IRR
- -9.2%
- Equity multiple
- 0.66×
- Total profit
- $-24,918
- Equity at exit
- $39,512
- IRR
- 0.3%
- Equity multiple
- 1.02×
- Total profit
- $1,716
- Equity at exit
- $22,912
Cash invested: $74,200 (down + closing). Projections, not guarantees.
Landlord ↔ Tenant lean methodology
- Overall (STATE)
- 15 Strongly Tenant-Friendly
- State New York
- 15 Strongly Tenant-Friendly · D+10
- County
- — inherits STATE
- City
- — inherits STATE
ZIP-level market 13041
- Active inventory
- 63
- Price-to-rent
- 8.0×
Monthly cashflow live
- Estimated rent
- $2,743 medium interval (Pro) →
- Mortgage (P&I)
- −$1,390
- Tax from tax record
- −$385 /mo · $4,624/yr
- Insurance
- −$110
- HOA
- −$0
- Vacancy / Maint / Mgmt
- −$576
- Net cashflow
- $282
Break-even live
UW: 25.0% down · 7.5% · 30yr · 1.5% tax · 5.0% vac · 8.0% maint · 8.0% mgmt
Financing live
Cash to close
- Down payment
- $66,250
- Closing costs
- $7,950
- Reserves months
- —
- Total cash needed
- —
Loan-product check · same deal, 3 products live
Conventional
25% down · 7.5% · 30yr
- Down + closing
- —
- Monthly P&I
- —
- Monthly cashflow
- —
- DSCR
- —
- Eligible?
- —
Personal DTI + credit; lowest rate.
DSCR
20% down · 8.5% · 30yr
- Down + closing
- —
- Monthly P&I
- —
- Monthly cashflow
- —
- DSCR
- —
- Eligible?
- —
No personal income docs; deal must DSCR.
Hard money
10% down · 12.0% · 12mo
- Down + closing
- —
- Monthly P&I
- —
- Monthly cashflow
- —
- DSCR
- —
- Eligible?
- —
Short-term bridge; refi at stabilization.
Rent comps 4 comps
| Address | Beds | Baths | Sqft | Rent | $/sqft | DOM | Units | Dist |
|---|---|---|---|---|---|---|---|---|
| 8244 Mantova Dr Clay, NY | 3.0 | 2.0 | 1560 | $2,800 | $1.79 | 44d | 1 | 0.06mi |
| 5472 Alfreton Dr Clay, NY | 3.0 | 2.0 | 1328 | $2,800 | $2.11 | 21d | 1 | 0.59mi |
| 8091 Weblank Way Clay, NY | 3.0 | 1.5 | 1150 | $2,200 | $1.91 | 21d | 1 | 0.76mi |
| 8587 Caughdenoy Rd Clay, NY | 3.0 | 1.0 | 1128 | $2,500 | $2.22 | 21d | 1 | 1.43mi |
Listing history 3 events
-
2026-04-16status Pending
-
2026-04-01historical Active Under Contract
-
2026-03-26$265,000 Active
ⓘ Source: listings_history table (triggers on properties + properties_extension) + one-shot
backfill from property_details.listing_events for pre-trigger history.
Tax reassessment forecast NY · Partial reset (capped growth)
- Current annual tax
- $4,624 · $385/mo
- Projected year-2 tax
- $4,624 · $385/mo
- Expected delta
- $0/yr ($0/mo · 0.0%)
ⓘ Screening estimate from a state-policy table — verify with the county assessor before closing.
Climate risk First Street
- Flood 1/10 Low FEMA zone X (unshaded) · 0% chance over 30 yrs
- Wildfire 2/10 Low
- Heat 3/10 Moderate 7 d/yr ≥95°F today · 16 d/yr by 30 yrs out
- Wind 1/10 Low 0% chance of damaging wind over 30 yrs
- Air quality 2/10 Low 1 unhealthy d/yr today · 1 by 30 yrs out
Nearby sold comps map
Loading sold comps map…
Walkable amenities ~0.75 mi
Loading nearby amenities…
Taxation est. · year 1
- Rental income
- $32,920
- − Mortgage interest
- −$14,844
- − Property taxes
- −$4,624
- − Insurance
- −$1,325
- − Repairs & maintenance
- −$2,634
- − Management
- −$2,634
- − Depreciation
- −$7,709
- Taxable loss
- −$849
- Est. tax savings @ 24.0%
- +$204
- After-tax cash flow
- $3,586/yr
For passive investors: Depreciation is non-cash, so a rental often shows a tax loss while cash-flowing — sheltering income. Rental losses are passive: they offset passive income freely, and up to $25,000/yr can offset ordinary (W-2) income if you actively participate and your MAGI is under $100k (phasing out to $0 by $150k); unused losses carry forward. On sale, claimed depreciation is recaptured at up to 25%, and gains may owe capital-gains tax (a 1031 exchange can defer both). Figures are a year-1 estimate at your 24.0% rate — not tax advice; consult a CPA.
Schools (NCES district)
- District
- North Syracuse Central School District
- NCES district ID
- 3621210
- Math proficiency
- 45% ▼ -9.00%
- Reading proficiency
- 50% ▲ 1.00%
- Median HH income
- $62,904
- Composite
- 41.93/100
- National rank
- #3356
- State rank
- #402 of 590 in NY
Livability — North Syracuse
- Score
- 72/100
- State rank
- #379
- US rank
- #6513
Category grades
Schools grade is shown separately in the Schools card above.
Census & demographics
- City population
- 20,185
- Population (ZIP)
- 12,094
Population outlook (Onondaga County) Hauer SSP2
- Today (2025)
- 467,894 people
- By 2030
- 463,381 · -1.0%
- By 2040
- 447,697 · -4.3%
- By 2050
- 426,399 · -8.9%
- By 2075
- 373,661 · -20.1%
- By 2100
- 307,967 · -34.2%
Race, ethnicity, and origin ACS 2023
- Neighborhood character
- Predominantly White (83%)
- Race & ethnicity
- White 83% Two or more races 10% Black 3% Asian 3% Hispanic / Latino 2%
- Common ancestry
- Romanian 7% Lithuanian 3% Slovak 2%
- Foreign-born
- 8% · Canada, China, Vietnam
- Languages at home
- 89% English-only · Other Indo-European 4% Tagalog/Filipino 3% French/Haitian/Cajun 1%
Political lean MEDSL · Onondaga
- 2024 margin
- D (+17.3) · D 58.6% · R 41.4%
- 2008→2024 swing
- -3.0pp toward R · 2008: 20.3pp · 2024: 17.3pp
- All cycles
- 2024: D+17.3 2020: D+20.6 2016: D+12.8 2012: D+21.1 2008: D+20.3
Not yet ingested
- Civics
- —
Market trends
- HPI YoY
- ▼ -235.12%
- Current HPI
- 326.7838
- Rent YoY
- —
- Metro
- —
- State GDP YoY
- ▲ 2.60%
- F500 in state
- 92
Industry mix (Fortune 500 HQ in NY)
| Industry | F500 HQs | Revenue |
|---|---|---|
| Financial Services | 10 | $950B |
|
||
| Consumer Goods | 9 | $162B |
|
||
| Insurance | 4 | $225B |
|
||
| Telecommunications | 2 | $144B |
|
||
| Pharmaceuticals | 2 | $112B |
|
||
| Media / Entertainment | 2 | $69B |
|
||
Price history
3 events — show timeline
- 2026-04-16 Pending — CNYIS
- 2026-04-01 Contingent — CNYIS
- 2026-03-26 Listed $265,000 CNYIS
Property tax history
+5.7%/yrLatest (2025): $4,624 · +1.4% YoY. Source: county tax records.
Cash-flow waterfall
monthlySold comps — $/sqft
last 12 mo · ≤1 miLoading sold comps…