359 Pontius Rd · Orange, MI
Flood risk 1/10 · Minimal
- FEMA flood zone
- —
- Chance of flooding over 30 yrs
- 0.0%
- Est. flood insurance / yr
- —
Fire risk 4/10 · Minor
- Est. fire insurance / yr
- $784 – $1,456
Heat risk 1/10 · Minimal
- Hot days now (above 93°F)
- 7 days/yr
- Hot days in 30 yrs
- 13 days/yr
Wind risk 1/10 · Minimal
- Chance of severe wind over 30 yrs
- —
Air-quality risk 2/10 · Minimal
- Unhealthy air days now
- 0 days/yr
- Unhealthy air days in 30 yrs
- 1 days/yr
Risk factors via First Street. Map © Google.
Why this score? — see what drove the D+ grade
The composite is a weighted blend of 9 inputs, each scored 0–100. Each bar is that input's sub-score; the figure is the points it added to the 100-point composite (weight × sub-score).
- ARV discount +15.0/15.0
- Cash flow +14.1/30.0
- DSCR +4.3/10.0
- 1% rule +2.9/10.0
- Schools +2.6/10.0
- Rent growth +2.5/5.0
- Livability +2.5/5.0
- Condition / age +2.5/5.0
- Appreciation +0.0/10.0
$159,900
🖨 Deal sheet 📄 Offer letter ✓ Due diligence
Listing remarks MLS
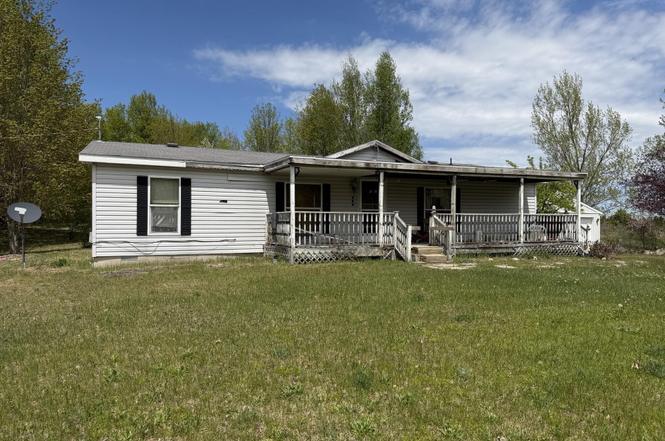
Wonderful opportunity to own your home on 4.2 beautiful acres in Kalkaska! This 3 bedroom, 2 full bath awaits you. Two car garage and plenty of space to sprawl out! Close to everything you could want. Selling as is. Seller has never lived in the property.
Key facts
- 4.2 acres
- 4.2 acre lot
- 2 garage spots
Tags
Property features AI
Finance
- Other: Lot approximately 4.2 acres; Irregular lot shape; Primary residence use
Exterior
- Parking: Detached garage; Driveway; 2 garage spaces
- Utilities: Septic tank
- Home design: Manufactured home; Ranch style; One level; Built in 1998
- Construction: Vinyl siding; Shingle roof; Built in 1998
- Exterior features: Front and back yard; Rural and wooded views; Dirt road access
Interior
- Kitchen: Kitchen (15.2 x 7.5)
- Bedrooms: 3 bedrooms (Primary bedroom on main level)
- Bathrooms: 2 full bathrooms
- Heating & cooling: Propane heating; Cooling system present
- Interior features: Entry on main level; 6 total rooms; No basement
- Laundry & utility: Main-level laundry room
Neighborhood map
What this means for you Summary
Snapshot
- This is a 3-bed/2.0-bath single-family listed at $160k.
Deal economics
- At list price, monthly cash flow is $22 ($270/yr) — positive.
- The deal already cash-flows at list — no discount required.
- To meet the 1% rule (rent ≥ 1% of price), the offer needs to be $127k (20.8% below list).
- Recommended offer: $127k (20.8% below list) — sets the bar for 1% rule.
Location & tenants
- Location reads: area grade D — affects rentability + tenant quality, not the cash-flow math above.
- Kalkaska Public Schools (town): math 24% / reading 38% proficiency, ranked #356 of 540 in MI (top 66%) — families likely to look elsewhere, expect single-tenant / working-renter base with shorter leases.
- Market conditions: 165 active listings in the ZIP; 38 units permitted in Kalkaska County in 2024 (0 in 5+ unit buildings).
Forward outlook
- Local home prices are declining (-3.0%/yr); year-one equity from $1k of loan paydown is wiped out by about $5k of value loss. Plan a longer hold.
- Kalkaska County population projected to shrink 9% by 2050 — rents likely to lag national; underwrite the cash flow, not the appreciation.
Negotiation context
- It's been on market 22 days — a 2% lower offer ($158k) is reasonable based on typical stale-listing flexibility.
- 2 sale attempts with the ask held roughly flat each time — persistent listings suggest the price (not the market) is what's stuck; bring a comps-based counter.
Questions for the listing agent
- Is there a deadline driving the sale (1031 exchange, divorce, estate, relocation)? That informs how much negotiation room exists.
- The area grade is low — what's the realistic commute time and amenity access for the typical tenant pool here? Any planned neighborhood developments (good or bad) we should know about?
- What's the average days-on-market for RENTAL listings here right now (not sales)? A rising rental-DOM trend means longer vacancies and softer asking-rent achievability than the comps imply.
- What's the recent tenant-quality profile in this submarket — average credit score on applications, eviction rate, late-payment / NSF rate, and stable-employment percentage? A property-management company in the area should have these aggregated.
- How much new for-sale + rental construction is in the pipeline within 1–3 miles? Heavy new supply typically softens prices + rents 12–24 months out; constrained supply supports both.
Investment metrics
- 1% rule
- 0.79% ✗
- Cap rate
- 6.46%
- Cash-on-cash
- 0.60%
- DSCR
- 1.03
- GRM
- 10.5
CMA / ARV
- ARV (on-the-fly)
- $230,880
- Comps found
- 1
Show comp detail 1 sale within ~0.75 mi
| Address | Dist | Beds/Ba | Sqft | Sold | Price | $/sf | Match |
|---|---|---|---|---|---|---|---|
| 170 SE Pontius Rd | 0.22mi | 2/1.0 (-1) | 1,060 (-15%) | 7mo | $196,500 | $185 | 50 |
Match score weights: distance 35% · size 25% · config 20% · recency 20%. Top-matched comps best support the ARV.
Projected returns pro-forma
-3.0% appreciation · 3.0% rent growth · sell at horizon
- IRR
- -15.4%
- Equity multiple
- 0.45×
- Total profit
- $-24,538
- Equity at exit
- $23,842
- IRR
- -6.9%
- Equity multiple
- 0.56×
- Total profit
- $-19,762
- Equity at exit
- $13,825
Cash invested: $44,772 (down + closing). Projections, not guarantees.
Landlord ↔ Tenant lean methodology
- Overall (STATE)
- 62 Landlord-Friendly
- State Michigan
- 62 Landlord-Friendly · EVEN
- County
- — inherits STATE
- City
- — inherits STATE
ZIP-level market 49646
- Active inventory
- 165
- Price-to-rent
- 10.5×
Monthly cashflow live
- Estimated rent
- $1,267 medium interval (Pro) →
- Mortgage (P&I)
- −$839
- Tax from tax record
- −$73 /mo · $881/yr
- Insurance
- −$67
- HOA
- −$0
- Vacancy / Maint / Mgmt
- −$266
- Net cashflow
- $22
Break-even live
UW: 25.0% down · 7.5% · 30yr · 1.5% tax · 5.0% vac · 8.0% maint · 8.0% mgmt
Financing live
Cash to close
- Down payment
- $39,975
- Closing costs
- $4,797
- Reserves months
- —
- Total cash needed
- —
Loan-product check · same deal, 3 products live
Conventional
25% down · 7.5% · 30yr
- Down + closing
- —
- Monthly P&I
- —
- Monthly cashflow
- —
- DSCR
- —
- Eligible?
- —
Personal DTI + credit; lowest rate.
DSCR
20% down · 8.5% · 30yr
- Down + closing
- —
- Monthly P&I
- —
- Monthly cashflow
- —
- DSCR
- —
- Eligible?
- —
No personal income docs; deal must DSCR.
Hard money
10% down · 12.0% · 12mo
- Down + closing
- —
- Monthly P&I
- —
- Monthly cashflow
- —
- DSCR
- —
- Eligible?
- —
Short-term bridge; refi at stabilization.
Listing history 17 events
-
2026-06-18days on market $159,900 Active 22 DOM
-
2026-06-17days on market $159,900 Active 21 DOM
-
2026-06-16days on market $159,900 Active 20 DOM
-
2026-06-15days on market $159,900 Active 19 DOM
-
2026-06-13days on market $159,900 Active 17 DOM
-
2026-06-12days on market $159,900 Active 16 DOM
-
2026-06-09days on market $159,900 Active 13 DOM
-
2026-06-08days on market $159,900 Active 12 DOM
-
2026-06-07days on market $159,900 Active 11 DOM
-
2026-06-07days on market $159,900 Active 10 DOM
-
2026-06-04days on market $159,900 Active 7 DOM
-
2026-06-02days on market $159,900 Active 6 DOM
-
2026-06-01days on market $159,900 Active 5 DOM
-
2026-05-31days on market $159,900 Active 4 DOM
-
2026-05-31days on market $159,900 Active 3 DOM
-
2026-05-27$159,900 Active 255-char remark
Show marketing remark (255 chars)
Wonderful opportunity to own your home on 4.2 beautiful acres in Kalkaska! This 3 bedroom, 2 full bath awaits you. Two car garage and plenty of space to sprawl out! Close to everything you could want. Selling as is. Seller has never lived in the property.
-
2026-05-24$159,900 Active
ⓘ Source: listings_history table (triggers on properties + properties_extension) + one-shot
backfill from property_details.listing_events for pre-trigger history.
Tax reassessment forecast MI · Partial reset (capped growth)
- Current annual tax
- $881 · $73/mo
- Projected year-2 tax
- $1,672 · $139/mo
- Expected delta
- +$791/yr (+$66/mo · 89.7%)
ⓘ Screening estimate from a state-policy table — verify with the county assessor before closing.
Climate risk First Street
- Flood 1/10 Low 0% chance over 30 yrs
- Wildfire 4/10 Moderate
- Heat 1/10 Low 7 d/yr ≥93°F today · 13 d/yr by 30 yrs out
- Wind 1/10 Low
- Air quality 2/10 Low 0 unhealthy d/yr today · 1 by 30 yrs out
Nearby sold comps map
Loading sold comps map…
Walkable amenities ~0.75 mi
Loading nearby amenities…
Taxation est. · year 1
- Rental income
- $15,206
- − Mortgage interest
- −$8,957
- − Property taxes
- −$881
- − Insurance
- −$800
- − Repairs & maintenance
- −$1,216
- − Management
- −$1,216
- − Depreciation
- −$4,652
- Taxable loss
- −$2,516
- Est. tax savings @ 24.0%
- +$604
- After-tax cash flow
- $874/yr
For passive investors: Depreciation is non-cash, so a rental often shows a tax loss while cash-flowing — sheltering income. Rental losses are passive: they offset passive income freely, and up to $25,000/yr can offset ordinary (W-2) income if you actively participate and your MAGI is under $100k (phasing out to $0 by $150k); unused losses carry forward. On sale, claimed depreciation is recaptured at up to 25%, and gains may owe capital-gains tax (a 1031 exchange can defer both). Figures are a year-1 estimate at your 24.0% rate — not tax advice; consult a CPA.
Schools (NCES district)
- District
- Kalkaska Public Schools
- NCES district ID
- 2620050
- Math proficiency
- 24% ▼ -8.00%
- Reading proficiency
- 38% ▬ 0.00%
- Median HH income
- $40,055
- Composite
- 26.03/100
- National rank
- #7308
- State rank
- #356 of 540 in MI
Livability — Orange
No livability data for this city. (Only ~50 U.S. cities are tracked.)
Census & demographics
- Population (ZIP)
- 8,573
Population outlook (Kalkaska County) Hauer SSP2
- Today (2025)
- 17,359 people
- By 2030
- 17,222 · -0.8%
- By 2040
- 16,643 · -4.1%
- By 2050
- 15,810 · -8.9%
- By 2075
- 13,772 · -20.7%
- By 2100
- 10,976 · -36.8%
Race, ethnicity, and origin ACS 2023
- Neighborhood character
- Predominantly White (91%)
- Race & ethnicity
- White 91% Two or more races 4% Hispanic / Latino 3%
- Common ancestry
- Romanian 6% Lithuanian 3% Iranian 3%
- Foreign-born
- 1% · Canada
- Languages at home
- 97% English-only · Spanish 2% Other Indo-European 1%
Political lean MEDSL · Kalkaska
- 2024 margin
- Solid R (+42.9) · D 27.8% · R 70.7% · Other 1.5%
- 2008→2024 swing
- -34.1pp toward R · 2008: -8.8pp · 2024: -42.9pp
- All cycles
- 2024: R+42.9 2020: R+41.7 2016: R+44.1 2012: R+19.7 2008: R+8.8
Not yet ingested
- Civics
- —
Market trends
- HPI YoY
- ▼ -158.61%
- Current HPI
- 290.8403
- Rent YoY
- —
- Metro
- —
- State GDP YoY
- ▲ 1.37%
- F500 in state
- 28
Industry mix (Fortune 500 HQ in MI)
| Industry | F500 HQs | Revenue |
|---|---|---|
| Automotive Parts | 3 | $48B |
|
||
| Automotive | 2 | $372B |
|
||
| Chemicals | 1 | $45B |
|
||
| Automotive Retail | 1 | $29B |
|
||
| Healthcare / Medical Devices | 1 | $23B |
|
||
| Automotive Technology | 1 | $20B |
|
||
Price history
+0.0% since first listed2 events — show timeline
- 2026-05-27 Listed $159,900 REALCOMP
- 2026-05-24 Listed $159,900 Greater Lansing AoR
Property tax history
+2.3%/yrLatest (2025): $881 · +0.9% YoY. Source: county tax records.
Cash-flow waterfall
monthlySold comps — $/sqft
last 12 mo · ≤1 miLoading sold comps…