 Duplex
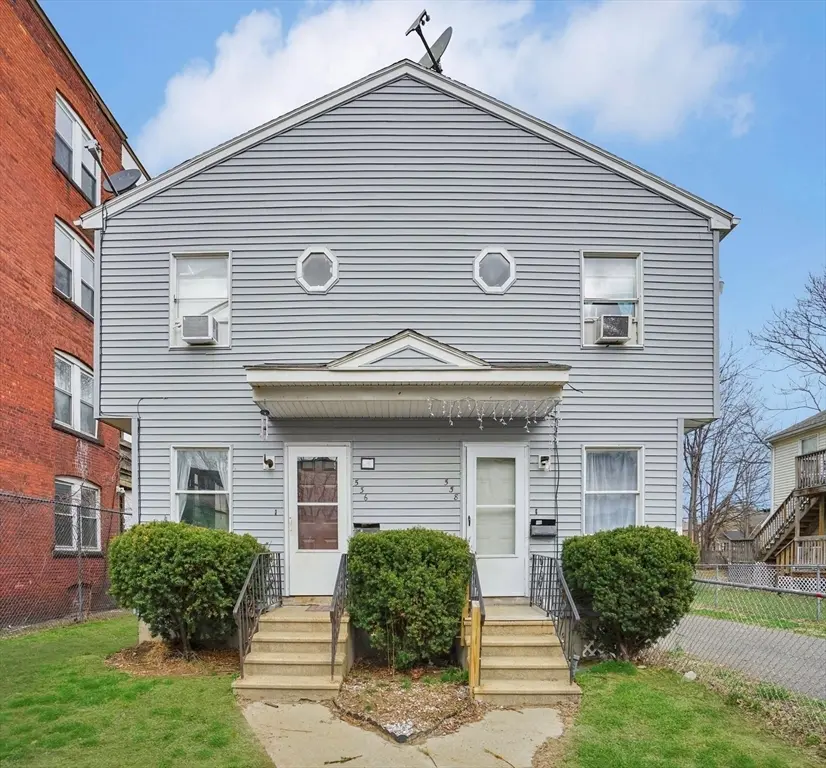
536-538 Union St · Springfield, MA
Flood risk No data
- FEMA flood zone
- —
- Chance of flooding over 30 yrs
- —
- Est. flood insurance / yr
- —
Fire risk No data
- Est. fire insurance / yr
- —
Heat risk No data
- Hot days now (above threshold)
- —
- Hot days in 30 yrs
- —
Wind risk No data
- Chance of severe wind over 30 yrs
- —
Air-quality risk No data
- Unhealthy air days now
- —
- Unhealthy air days in 30 yrs
- —
Risk factors via First Street. Map © Google.
Why this score? — see what drove the D grade
The composite is a weighted blend of 9 inputs, each scored 0–100. Each bar is that input's sub-score; the figure is the points it added to the 100-point composite (weight × sub-score).
- Cash flow +18.4/30.0
- DSCR +5.8/10.0
- 1% rule +4.9/10.0
- Livability +3.7/5.0
- Rent growth +2.5/5.0
- Condition / age +2.2/5.0
- Schools +1.6/10.0
- ARV discount +1.2/15.0
- Appreciation +0.0/10.0
$379,900
🖨 Deal sheet 📄 Offer letter ✓ Due diligence
Multi-family units
County records classify this as Multi-Family (2-4 Unit). Listing-text estimate: 2 units. confirmed
Listing remarks MLS
A chance to own a modern duplex (built in 1988) featuring three bedrooms and 1.5 baths on each side with gas heat and hot water, public water and sewer, and full separate basements on each side. Vinyl sided exterior and a flat lot with150 ft deep back yard with plenty of room for parking and room for gardening or recreation. Both units need cosmetics and redecorating, but with a little elbow grease, this home can shine again. With some work this can be a great owner occupied or investment property!
Key facts
- Deep back yard
- Vinyl sided exterior
- Flat lot
Tags
Neighborhood map
What this means for you Summary
Snapshot
- This is a 2 × 3-bed/1.5-bath units multifamily listed at $380k. Condition is rated fair.
Deal economics
- At list price, monthly cash flow is $354 ($4k/yr) — positive. Per door: $177/mo.
- The deal already cash-flows at list — no discount required.
- To meet the 1% rule (rent ≥ 1% of price), the offer needs to be $377k (0.7% below list).
- Recommended offer: $357k (6.0% below list) — sets the bar for market timing.
- Cap rate 7.4% vs local median 5.1% in Springfield — top-decile yield for the area; either an underpriced asset or a hidden risk that comps aren't pricing in. Stress-test before assuming the spread holds.
Location & tenants
- Location reads 73/100 on livability (#97 in MA) — a middle-class / working-renter tenant base. Strengths: commute A+, health & safety A+, amenities A; Watch: schools D, crime F, employment D-.
- Springfield (urban): math 13% / reading 25% proficiency, ranked #296 of 302 in MA (top 98%) — low school quality limits family demand, transient renter base, plan for 1-2y turnover; 81% free/reduced lunch — lower-income household profile, screen leases tightly.
- Market conditions: 32 active listings in the ZIP; 4 comparable units currently listed for rent nearby; rentals lingering (median 44d on market — plan ~5-8 weeks vacancy on turnover, expect pricing pressure); 75% of comp listings sitting > 30 days — soft ceiling on asking rent; 453 units permitted in Hampden County in 2024 (116 in 5+ unit buildings).
- At $3,771/mo this rent would consume 93% of the median local household income ($48k/yr) (locally 1322% of renters already pay >50% of income on rent) — very limited rent-growth headroom before tenants either downsize or default.
Forward outlook
- Local home prices are declining (-3.0%/yr); year-one equity from $3k of loan paydown is wiped out by about $11k of value loss. Plan a longer hold.
- Hampden County population projected at +5% by 2050 — modest demand growth; plan on rents tracking national, not racing it.
Negotiation context
- It's been on market 71 days — a 6% lower offer ($357k) is reasonable based on typical stale-listing flexibility.
- 3 sale attempts since 27y ago with the ask held roughly flat each time — persistent listings suggest the price (not the market) is what's stuck; bring a comps-based counter.
- Current owner paid $102k; list at $380k implies a 272% gain — meaningful room to come down on a strong offer.
Questions for the listing agent
- It's been on market 71 days. Have you received any prior offers? Is the seller open to a 6% concession, seller financing, or rate buy-down credit?
- Can we see the unit-by-unit rent roll, current vacancy, and any below-market leases? What's the average tenancy length?
- What capital expenditures (roof, boiler, parking lot, exteriors) have been made in the last 5 years, and what's planned in the next 2?
- Have any recent inspections been done? Can we get a copy of the seller's disclosures and any deferred-maintenance estimates?
- Why hasn't it sold? Are there any deal-killer items the seller is aware of (foundation, flood, title, zoning, code violations)?
- Is there a deadline driving the sale (1031 exchange, divorce, estate, relocation)? That informs how much negotiation room exists.
- Schools are D-rated, which usually means shorter tenancies and higher turnover. Who's the typical renter profile here, and what's been the actual vacancy rate?
- Crime grade is F in this area — have there been break-ins, vandalism, or insurance claims at this property in the last 3 years? What carrier currently insures it and at what premium?
- The area grade is low — what's the realistic commute time and amenity access for the typical tenant pool here? Any planned neighborhood developments (good or bad) we should know about?
- What's the average days-on-market for RENTAL listings here right now (not sales)? A rising rental-DOM trend means longer vacancies and softer asking-rent achievability than the comps imply.
- What's the recent tenant-quality profile in this submarket — average credit score on applications, eviction rate, late-payment / NSF rate, and stable-employment percentage? A property-management company in the area should have these aggregated.
- How much new apartment / multifamily construction is in the pipeline within 1–3 miles? Heavy new supply (>2% of stock underway) typically softens rents 12–24 months out; light construction supports rent growth.
Investment metrics
- 1% rule
- 0.99% ✗
- Cap rate
- 7.41%
- Cash-on-cash
- 3.99%
- DSCR
- 1.18
- GRM
- 8.4
CMA / ARV
- ARV (median comp)
- $333,190
- List price
- $379,900
- Delta
- 14.02%
- Verdict
- OVERPRICED
- Comps
- 20 within 1.0 mi
Show comp detail 10 sales within ~0.75 mi
| Address | Dist | Beds/Ba | Sqft | Sold | Price | $/sf | Match |
|---|---|---|---|---|---|---|---|
| 10 Monroe | 0.20mi | 6/3.0 | 1,910 (-0%) | 10mo | $385,000 | $202 | 81 |
| 58-60 Pendleton Ave | 0.17mi | 6/2.0 | 1,920 (0%) | 9mo | $385,000 | $201 | 81 |
| 705-707 Union St | 0.32mi | 6/3.0 | 1,920 (0%) | 7mo | $395,000 | $206 | 79 |
| 145 Quincy St | 0.21mi | 6/2.0 | 1,788 (-7%) | 7mo | $265,000 | $148 | 69 |
| 70-72 Manhattan St | 0.62mi | 5/3.0 (-1) | 1,872 (-2%) | 4mo | $410,000 | $219 | 59 |
| 20 Florida St | 0.28mi | 6/3.0 | 2,067 (+8%) | 23mo | $350,000 | $169 | 55 |
| 184-186 Marion St | 0.66mi | 6/3.0 | 2,048 (+7%) | 7mo | $485,000 | $237 | 53 |
| 31-33 Hayden Ave | 0.61mi | 6/3.0 | 2,028 (+6%) | 22mo | $295,000 | $145 | 44 |
| 287 Walnut St | 0.44mi | 7/2.0 (+1) | 2,096 (+9%) | 14mo | $410,000 | $196 | 43 |
| 14 Girard Ave | 0.73mi | 6/3.5 | 2,191 (+14%) | 20mo | $341,000 | $156 | 24 |
Match score weights: distance 35% · size 25% · config 20% · recency 20%. Top-matched comps best support the ARV.
Projected returns pro-forma
-3.0% appreciation · 3.0% rent growth · sell at horizon
- IRR
- -10.0%
- Equity multiple
- 0.63×
- Total profit
- $-38,977
- Equity at exit
- $56,644
- IRR
- -0.6%
- Equity multiple
- 0.96×
- Total profit
- $-4,703
- Equity at exit
- $32,847
Cash invested: $106,372 (down + closing). Projections, not guarantees.
Landlord ↔ Tenant lean methodology
- Overall (STATE)
- 20 Strongly Tenant-Friendly
- State Massachusetts
- 20 Strongly Tenant-Friendly · D+15
- County
- — inherits STATE
- City
- — inherits STATE
ZIP-level market 01109
- Home prices YoY
- -22.8%
- Active inventory
- 32
- Price-to-rent
- 16.8×
Monthly cashflow live
- Estimated rent
- $3,771 high interval (Pro) →
- Mortgage (P&I)
- −$1,992
- Tax est. 1.5%
- −$475 /mo · $5,698/yr
- Insurance
- −$158
- HOA
- −$0
- Vacancy / Maint / Mgmt
- −$792
- Net cashflow
- $354
Break-even live
2-unit breakdown (identical units grouped — click to expand)
| Units | Beds | Baths | Est. rent |
|---|---|---|---|
| 2× units | 3 | 1.5 | $3,772 |
| #1 | 3 | 1.5 | $1,886 |
| #2 | 3 | 1.5 | $1,886 |
| Total (2 units) | $3,771 | ||
UW: 25.0% down · 7.5% · 30yr · 1.5% tax · 5.0% vac · 8.0% maint · 8.0% mgmt
Financing live
Cash to close
- Down payment
- $94,975
- Closing costs
- $11,397
- Reserves months
- —
- Total cash needed
- —
Loan-product check · same deal, 3 products live
Conventional
25% down · 7.5% · 30yr
- Down + closing
- —
- Monthly P&I
- —
- Monthly cashflow
- —
- DSCR
- —
- Eligible?
- —
Personal DTI + credit; lowest rate.
DSCR
20% down · 8.5% · 30yr
- Down + closing
- —
- Monthly P&I
- —
- Monthly cashflow
- —
- DSCR
- —
- Eligible?
- —
No personal income docs; deal must DSCR.
Hard money
10% down · 12.0% · 12mo
- Down + closing
- —
- Monthly P&I
- —
- Monthly cashflow
- —
- DSCR
- —
- Eligible?
- —
Short-term bridge; refi at stabilization.
Rent comps 4 comps
| Address | Beds | Baths | Sqft | Rent | $/sqft | DOM | Units | Dist |
|---|---|---|---|---|---|---|---|---|
| 296 Hancock St Springfield, MA | 6.0 | 2.0 | 2000 | $2,900 | $1.45 | 43d | 1 | 0.54mi |
| 41 Clarendon St Unit 2 Springfield, MA | 5.0 | 1.5 | 1600 | $2,350 | $1.47 | 43d | 1 | 0.55mi |
| 834 Worthington St Unit 2nd Fl Springfield, MA | 5.0 | 1.0 | 1841 | $2,450 | $1.33 | 21d | 1 | 0.64mi |
| 15 Wigwam Pl Springfield, MA | 5.0 | 2.0 | 2000 | $2,800 | $1.40 | 43d | 1 | 1.12mi |
Listing history 21 events
-
2026-06-18days on market $379,900 Active 71 DOM
-
2026-06-17days on market $379,900 Active 70 DOM
-
2026-06-16days on market $379,900 Active 69 DOM
-
2026-06-15days on market $379,900 Active 68 DOM
-
2026-06-14days on market $379,900 Active 66 DOM
-
2026-06-13days on market $379,900 Active 65 DOM
-
2026-06-10days on market $379,900 Active 63 DOM
-
2026-06-09days on market $379,900 Active 62 DOM
-
2026-06-08days on market $379,900 Active 61 DOM
-
2026-06-07days on market $379,900 Active 60 DOM
-
2026-06-05days on market $379,900 Active 57 DOM
-
2026-06-03days on market $379,900 Active 56 DOM
-
2026-06-02days on market $379,900 Active 55 DOM
-
2026-06-01days on market $379,900 Active 54 DOM
-
2026-05-31days on market $379,900 Active 53 DOM
-
2026-05-30days on market $379,900 Active 52 DOM
-
2026-04-08$379,900 New 503-char remark
Show marketing remark (503 chars)
A chance to own a modern duplex (built in 1988) featuring three bedrooms and 1.5 baths on each side with gas heat and hot water, public water and sewer, and full separate basements on each side. Vinyl sided exterior and a flat lot with150 ft deep back yard with plenty of room for parking and room for gardening or recreation. Both units need cosmetics and redecorating, but with a little elbow grease, this home can shine again. With some work this can be a great owner occupied or investment property!
-
2002-09-30soldstatus $102,000 126-char remark
Show marketing remark (126 chars)
NEWER DUPLEX IN VERY GOOD CONDITION W/ EXCELLENT RENTAL INCOME MAKES THIS A GREAT VALUE FOR EITHER INVESTOR OR OWNER OCCUPANT.
-
2002-05-23$105,000 126-char remark
Show marketing remark (126 chars)
NEWER DUPLEX IN VERY GOOD CONDITION W/ EXCELLENT RENTAL INCOME MAKES THIS A GREAT VALUE FOR EITHER INVESTOR OR OWNER OCCUPANT.
-
1999-08-24soldstatus $54,000
-
1999-04-28$58,500
ⓘ Source: listings_history table (triggers on properties + properties_extension) + one-shot
backfill from property_details.listing_events for pre-trigger history.
Nearby sold comps map
Loading sold comps map…
Walkable amenities ~0.75 mi
Loading nearby amenities…
Taxation est. · year 1
- Rental income
- $45,252
- − Mortgage interest
- −$21,280
- − Property taxes
- −$5,698
- − Insurance
- −$1,900
- − Repairs & maintenance
- −$3,620
- − Management
- −$3,620
- − Depreciation
- −$11,052
- Taxable loss
- −$1,918
- Est. tax savings @ 24.0%
- +$460
- After-tax cash flow
- $4,705/yr
For passive investors: Depreciation is non-cash, so a rental often shows a tax loss while cash-flowing — sheltering income. Rental losses are passive: they offset passive income freely, and up to $25,000/yr can offset ordinary (W-2) income if you actively participate and your MAGI is under $100k (phasing out to $0 by $150k); unused losses carry forward. On sale, claimed depreciation is recaptured at up to 25%, and gains may owe capital-gains tax (a 1031 exchange can defer both). Figures are a year-1 estimate at your 24.0% rate — not tax advice; consult a CPA.
Condition & rehab AI · 12 photos
This two-unit property requires moderate renovations to improve its condition and appeal to buyers/renters.
Repairs flagged
- Major kitchen appliances — outdated and need replacement
- Major bathroom fixtures — dated and need replacement
- Moderate exterior paint — some peeling and wear
- Moderate interior paint — peeling in some areas
- Moderate HVAC system — outdated and may need replacement
Value-add opportunities
- Both kitchen appliances — modern appliances would attract more buyers/renters
- Both bathroom fixtures — updated fixtures would attract more buyers/renters
- Both exterior paint — fresh paint would improve curb appeal
- Both interior paint — fresh paint would improve interior appearance
- Both HVAC system — modern HVAC would improve comfort and energy efficiency
Renovation cost estimate screening
| Repair item | Severity | Est. cost |
|---|---|---|
| kitchen appliances · outdated and need replacement | Major | $15,000–50,000 |
| bathroom fixtures · dated and need replacement | Major | $15,000–50,000 |
| exterior paint · some peeling and wear | Moderate | $3,000–15,000 |
| interior paint · peeling in some areas | Moderate | $3,000–15,000 |
| HVAC system · outdated and may need replacement | Moderate | $3,000–15,000 |
| Total estimated repair cost · 5 items | $39,000–145,000 |
Value-add ROI direction
- Both kitchen appliances — modern appliances would attract more buyers/renters ↑
- Both bathroom fixtures — updated fixtures would attract more buyers/renters ↑
- Both exterior paint — fresh paint would improve curb appeal ↑
- Both interior paint — fresh paint would improve interior appearance ↑
- Both HVAC system — modern HVAC would improve comfort and energy efficiency ↑
ⓘ Cost ranges are severity-bucket heuristics (US national rule-of-thumb). Get contractor quotes + a written scope before underwriting a rehab budget.
Schools (NCES district)
- District
- Springfield
- NCES district ID
- 2511130
- Math proficiency
- 13% ▼ -12.00%
- Reading proficiency
- 25% ▼ -5.00%
- Median HH income
- $34,938
- Composite
- 15.6/100
- National rank
- #9293
- State rank
- #296 of 302 in MA
Livability — Springfield
- Score
- 73/100
- State rank
- #97
- US rank
- #5195
Category grades
Schools grade is shown separately in the Schools card above.
Census & demographics
- Census place
- Springfield, MA
- County
- Hampden County · 230,965 people
- City population
- 61,006
- Metro
- Springfield, MA
- Population (ZIP)
- 31,124
- Household income
- $48,415
- Rent vs Own
- Severe rent burden
- 1322.0
Population outlook (Hampden County) Hauer SSP2
- Today (2025)
- 485,646 people
- By 2030
- 491,517 · +1.2%
- By 2040
- 500,539 · +3.1%
- By 2050
- 508,827 · +4.8%
- By 2075
- 539,167 · +11.0%
- By 2100
- 545,698 · +12.4%
Race, ethnicity, and origin ACS 2023
- Neighborhood character
- Diverse neighborhood (Simpson 0.67)
- Race & ethnicity
- Hispanic / Latino 45% Black 31% Two or more races 20% White 18% Asian 1% Native American 1%
- Hispanic origin (detail)
- Puerto Rican 39% Dominican 3%
- Common ancestry
- Lithuanian 2% Romanian 1%
- Foreign-born
- 9% · Canada, China
- Languages at home
- 65% English-only · Spanish 32% Other Asian/Pacific 1% Russian/Polish/Slavic 1%
Political lean MEDSL · Hampden
- 2024 margin
- Lean D (+8.9) · D 53.4% · R 44.5% · Other 2.1%
- 2008→2024 swing
- -16.4pp toward R · 2008: 25.3pp · 2024: 8.9pp
- All cycles
- 2024: D+8.9 2020: D+17.7 2016: D+16.0 2012: D+25.4 2008: D+25.3
Not yet ingested
- Civics
- —
Market trends
- HPI YoY
- ▼ -113.11%
- Current HPI
- 382.9038
- Rent YoY
- —
- Metro
- Springfield, MA
- State GDP YoY
- ▲ 2.28%
- F500 in state
- 38
Industry mix (Fortune 500 HQ in MA)
| Industry | F500 HQs | Revenue |
|---|---|---|
| Technology | 3 | $17B |
|
||
| Insurance | 2 | $84B |
|
||
| Retail | 2 | $76B |
|
||
| Life Sciences | 1 | $43B |
|
||
| Energy Technology | 1 | $31B |
|
||
| Aerospace / Defense | 1 | $18B |
|
||
Price history
+549.4% since first listed5 events — show timeline
- 2026-04-08 Listed $379,900 MLS PIN
- 2002-09-30 Sold (MLS) $102,000 MLS PIN
- 2002-05-23 Listed $105,000 MLS PIN
- 1999-08-24 Sold (MLS) $54,000 MLS PIN
- 1999-04-28 Listed $58,500 MLS PIN
Cash-flow waterfall
monthlySold comps — $/sqft
last 12 mo · ≤1 miLoading sold comps…