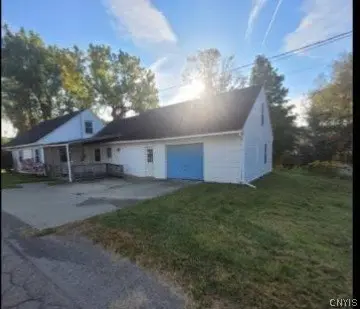
6 Aka 8 Water St · Andover, NY
Flood risk 1/10 · Minimal
- FEMA flood zone
- AE
- Chance of flooding over 30 yrs
- 0.0%
- Est. flood insurance / yr
- $1,737 – $8,500
Fire risk 1/10 · Minimal
- Est. fire insurance / yr
- $691 – $1,283
Heat risk 2/10 · Minimal
- Hot days now (above 89°F)
- 8 days/yr
- Hot days in 30 yrs
- 18 days/yr
Wind risk 1/10 · Minimal
- Chance of severe wind over 30 yrs
- —
Air-quality risk 1/10 · Minimal
- Unhealthy air days now
- 0 days/yr
- Unhealthy air days in 30 yrs
- 0 days/yr
Risk factors via First Street. Map © Google.
Why this score? — see what drove the B+ grade
The composite is a weighted blend of 9 inputs, each scored 0–100. Each bar is that input's sub-score; the figure is the points it added to the 100-point composite (weight × sub-score).
- Cash flow +30.0/30.0
- 1% rule +10.0/10.0
- DSCR +10.0/10.0
- Appreciation +7.6/10.0
- ARV discount +7.5/15.0
- Schools +3.5/10.0
- Livability +3.2/5.0
- Rent growth +2.5/5.0
- Condition / age +2.2/5.0
$32,108
🖨 Deal sheet 📄 Offer letter ✓ Due diligence
Listing remarks MLS
Looking for a great opportunity? This property has tons of potential and is average in living space size for the neighborhood. It is located close to main roads with easy access to local amenities, such as shopping, banking, schools, and various eateries. Per our BPO/TAX describes the property as a SFR (cape) built in 1945. It has a GLA of approx. 1356 and has 3 bedrooms and 1.5baths, NO basement and 1-Att Garage. The property is on 8712 sq
Key facts
- Close to main roads
- 8,712 sq ft lot
- Garage
Tags
Neighborhood map
What this means for you Summary
Snapshot
- This is a 3-bed/1.5-bath single-family listed at $32k. Condition is rated fair.
Deal economics
- At list price, monthly cash flow is $286 ($3k/yr) — positive.
- The deal already cash-flows at list — no discount required.
- Meets the 1% rule at list price ($1k rent vs $32k).
- Recommended offer: $29k (9.0% below list) — sets the bar for market timing.
Location & tenants
- Location reads 65/100 on livability (#676 in NY) — a middle-class / working-renter tenant base. Strengths: cost of living A+, housing A+; Watch: schools C-, employment C-, health & safety D.
- Andover Central School District (rural): math 45% / reading 30% proficiency, ranked #667 of 755 in NY (top 88%) — families likely to look elsewhere, expect single-tenant / working-renter base with shorter leases.
- Market conditions: 15 active listings in the ZIP; 87 units permitted in Allegany County in 2024 (0 in 5+ unit buildings).
Forward outlook
- In year one you build about $2k of equity ($222 loan paydown + $2k appreciation (5.1% local appreciation)).
- Allegany County population projected at -26% by 2050 — secular population decline; favor cash flow + early exit over multi-decade hold.
- At projected returns (5.1% appreciation + 3.0% rent growth), your $9k cash investment doubles in ~2 years — after that, you're playing with house money.
Negotiation context
- It's been on market 112 days — a 9% lower offer ($29k) is reasonable based on typical stale-listing flexibility.
Risks & watch-outs
- Watch-outs: flood insurance adds $427/mo; built in 1945 — expect roof / HVAC / electrical / plumbing capex.
- Climate carrying-cost: in FEMA flood zone AE (mandatory federal flood insurance) — expect insurance premiums to compound above CPI over the hold.
Questions for the listing agent
- It's been on market 112 days. Have you received any prior offers? Is the seller open to a 9% concession, seller financing, or rate buy-down credit?
- Have any recent inspections been done? Can we get a copy of the seller's disclosures and any deferred-maintenance estimates?
- Built in 1945 — when were the roof, HVAC, electrical panel, plumbing, and water heater last replaced?
- What's the actual annual flood-insurance premium (NFIP or private), and is the property in a SFHA with mandatory coverage?
- Why hasn't it sold? Are there any deal-killer items the seller is aware of (foundation, flood, title, zoning, code violations)?
- Is there a deadline driving the sale (1031 exchange, divorce, estate, relocation)? That informs how much negotiation room exists.
- Crime grade is F in this area — have there been break-ins, vandalism, or insurance claims at this property in the last 3 years? What carrier currently insures it and at what premium?
- What's the average days-on-market for RENTAL listings here right now (not sales)? A rising rental-DOM trend means longer vacancies and softer asking-rent achievability than the comps imply.
- What's the recent tenant-quality profile in this submarket — average credit score on applications, eviction rate, late-payment / NSF rate, and stable-employment percentage? A property-management company in the area should have these aggregated.
- How much new for-sale + rental construction is in the pipeline within 1–3 miles? Heavy new supply typically softens prices + rents 12–24 months out; constrained supply supports both.
Investment metrics
- 1% rule
- 3.68% ✓
- Cap rate
- 32.92%
- Cash-on-cash
- 95.11%
- DSCR
- 5.23
- GRM
- 2.3
CMA / ARV
- ARV (median comp)
- $106,961
- List price
- $32,108
- Delta
- -69.98%
- Verdict
- UNDERPRICED
- Comps
- 15 within 1.0 mi
Show comp detail 2 sales within ~0.75 mi
| Address | Dist | Beds/Ba | Sqft | Sold | Price | $/sf | Match |
|---|---|---|---|---|---|---|---|
| 25 W Greenwood St | 0.37mi | 2/1.0 (-1) | 1,254 (-8%) | 10mo | $90,000 | $72 | 54 |
| 24 Second St | 0.42mi | 4/1.0 (+1) | 1,157 (-15%) | 21mo | $95,000 | $82 | 31 |
Match score weights: distance 35% · size 25% · config 20% · recency 20%. Top-matched comps best support the ARV.
Projected returns pro-forma
5.11% appreciation · 3.0% rent growth · sell at horizon
- IRR
- 47.1%
- Equity multiple
- 3.90×
- Total profit
- $26,092
- Equity at exit
- $18,405
- IRR
- 45.1%
- Equity multiple
- 8.07×
- Total profit
- $63,579
- Equity at exit
- $31,940
Cash invested: $8,990 (down + closing). Projections, not guarantees.
Landlord ↔ Tenant lean methodology
- Overall (STATE)
- 15 Strongly Tenant-Friendly
- State New York
- 15 Strongly Tenant-Friendly · D+10
- County
- — inherits STATE
- City
- — inherits STATE
ZIP-level market 14806
- Home prices YoY
- 2.0%
- Active inventory
- 15
- Price-to-rent
- 2.3×
Monthly cashflow live
- Estimated rent
- $1,183 medium interval (Pro) →
- Mortgage (P&I)
- −$168
- Tax est. 1.5%
- −$40 /mo · $482/yr
- Insurance
- −$13
- Flood insurance flood zone
- −$427 /mo · $5,118/yr
- HOA
- −$0
- Vacancy / Maint / Mgmt
- −$248
- Net cashflow
- $286
Break-even live
UW: 25.0% down · 7.5% · 30yr · 1.5% tax · 5.0% vac · 8.0% maint · 8.0% mgmt
Financing live
Cash to close
- Down payment
- $8,027
- Closing costs
- $963
- Reserves months
- —
- Total cash needed
- —
Loan-product check · same deal, 3 products live
Conventional
25% down · 7.5% · 30yr
- Down + closing
- —
- Monthly P&I
- —
- Monthly cashflow
- —
- DSCR
- —
- Eligible?
- —
Personal DTI + credit; lowest rate.
DSCR
20% down · 8.5% · 30yr
- Down + closing
- —
- Monthly P&I
- —
- Monthly cashflow
- —
- DSCR
- —
- Eligible?
- —
No personal income docs; deal must DSCR.
Hard money
10% down · 12.0% · 12mo
- Down + closing
- —
- Monthly P&I
- —
- Monthly cashflow
- —
- DSCR
- —
- Eligible?
- —
Short-term bridge; refi at stabilization.
Listing history 16 events
-
2026-06-18status $32,108 Pending 112 DOM
-
2026-06-18days on market $32,108 Active 112 DOM
-
2026-06-17days on market $32,108 Active 111 DOM
-
2026-06-16days on market $32,108 Active 110 DOM
-
2026-06-15days on market $32,108 Active 109 DOM
-
2026-06-13days on market $32,108 Active 107 DOM
-
2026-06-12days on market $32,108 Active 106 DOM
-
2026-06-09days on market $32,108 Active 103 DOM
-
2026-06-08days on market $32,108 Active 102 DOM
-
2026-06-07days on market $32,108 Active 101 DOM
-
2026-06-05days on market $32,108 Active 99 DOM
-
2026-06-04days on market $32,108 Active 97 DOM
-
2026-06-02days on market $32,108 Active 96 DOM
-
2026-06-01days on market $32,108 Active 95 DOM
-
2026-05-31days on market $32,108 Active 94 DOM
-
2026-02-26$32,108 Active 445-char remark
Show marketing remark (445 chars)
Looking for a great opportunity? This property has tons of potential and is average in living space size for the neighborhood. It is located close to main roads with easy access to local amenities, such as shopping, banking, schools, and various eateries. Per our BPO/TAX describes the property as a SFR (cape) built in 1945. It has a GLA of approx. 1356 and has 3 bedrooms and 1.5baths, NO basement and 1-Att Garage. The property is on 8712 sq
ⓘ Source: listings_history table (triggers on properties + properties_extension) + one-shot
backfill from property_details.listing_events for pre-trigger history.
Climate risk First Street
- Flood 1/10 Low FEMA zone AE · 0% chance over 30 yrs
- Wildfire 1/10 Low
- Heat 2/10 Low 8 d/yr ≥89°F today · 18 d/yr by 30 yrs out
- Wind 1/10 Low
- Air quality 1/10 Low 0 unhealthy d/yr today · 0 by 30 yrs out
Nearby sold comps map
Loading sold comps map…
Walkable amenities ~0.75 mi
Loading nearby amenities…
Taxation est. · year 1
- Rental income
- $14,194
- − Mortgage interest
- −$1,799
- − Property taxes
- −$482
- − Insurance
- −$5,279
- − Repairs & maintenance
- −$1,135
- − Management
- −$1,135
- − Depreciation
- −$934
- Taxable income
- $3,429
- Est. tax owed @ 24.0%
- −$823
- After-tax cash flow
- $2,609/yr
For passive investors: Depreciation is non-cash, so a rental often shows a tax loss while cash-flowing — sheltering income. Rental losses are passive: they offset passive income freely, and up to $25,000/yr can offset ordinary (W-2) income if you actively participate and your MAGI is under $100k (phasing out to $0 by $150k); unused losses carry forward. On sale, claimed depreciation is recaptured at up to 25%, and gains may owe capital-gains tax (a 1031 exchange can defer both). Figures are a year-1 estimate at your 24.0% rate — not tax advice; consult a CPA.
Condition & rehab AI · 0 photos
This home has moderate potential for improvement with a focus on the kitchen and bathrooms. Exterior updates and landscaping will also significantly enhance its appeal.
Repairs flagged
- Major Kitchen countertops — The countertops are visibly worn and need replacement.
- Major Bathroom fixtures — The bathroom fixtures are outdated and need updating.
- Moderate Exterior siding — The siding is weathered and could benefit from repainting.
- Major Flooring — The flooring is worn and may need replacement.
- Minor Interior walls — The walls show some discoloration and could be painted.
Value-add opportunities
- Resale Kitchen renovation — A new kitchen will attract more buyers and increase the home's value.
- Resale Bathroom updates — Modernizing the bathrooms will appeal to potential buyers and increase the home's value.
- Both Exterior painting — A fresh coat of paint will improve the home's curb appeal and increase its value.
- Both Landscaping — A well-maintained yard will enhance the home's curb appeal and attract more renters.
Renovation cost estimate screening
| Repair item | Severity | Est. cost |
|---|---|---|
| Kitchen countertops · The countertops are visibly worn and need replacement. | Major | $15,000–50,000 |
| Bathroom fixtures · The bathroom fixtures are outdated and need updating. | Major | $15,000–50,000 |
| Exterior siding · The siding is weathered and could benefit from repainting. | Moderate | $3,000–15,000 |
| Flooring · The flooring is worn and may need replacement. | Major | $15,000–50,000 |
| Interior walls · The walls show some discoloration and could be painted. | Minor | $500–3,000 |
| Total estimated repair cost · 5 items | $48,500–168,000 |
Value-add ROI direction
- Resale Kitchen renovation — A new kitchen will attract more buyers and increase the home's value. ↑
- Resale Bathroom updates — Modernizing the bathrooms will appeal to potential buyers and increase the home's value. ↑
- Both Exterior painting — A fresh coat of paint will improve the home's curb appeal and increase its value. ↑
- Both Landscaping — A well-maintained yard will enhance the home's curb appeal and attract more renters. ↑
ⓘ Cost ranges are severity-bucket heuristics (US national rule-of-thumb). Get contractor quotes + a written scope before underwriting a rehab budget.
Schools (NCES district)
- District
- Andover Central School District
- NCES district ID
- 3603030
- Math proficiency
- 45% ▲ 5.00%
- Reading proficiency
- 30% ▼ -5.00%
- Median HH income
- $48,098
- Composite
- 34.8/100
- National rank
- #10022
- State rank
- #667 of 755 in NY
Livability — Andover
- Score
- 65/100
- State rank
- #676
- US rank
- #12685
Category grades
Schools grade is shown separately in the Schools card above.
Census & demographics
- Census place
- Andover, NY
- City population
- 2,131
- Population (ZIP)
- 2,131
Population outlook (Allegany County) Hauer SSP2
- Today (2025)
- 45,362 people
- By 2030
- 43,078 · -5.0%
- By 2040
- 38,031 · -16.2%
- By 2050
- 33,634 · -25.9%
- By 2075
- 25,285 · -44.3%
- By 2100
- 18,902 · -58.3%
Race, ethnicity, and origin ACS 2023
- Neighborhood character
- Predominantly White (98%)
- Race & ethnicity
- White 98% Two or more races 2%
- Common ancestry
- Iranian 2% Slovak 1% Lithuanian 1%
- Foreign-born
- 0% · China
- Languages at home
- 99% English-only · Spanish 1%
Political lean MEDSL · Allegany
- 2024 margin
- Solid R (+43.2) · D 28.4% · R 71.6%
- 2008→2024 swing
- -21.5pp toward R · 2008: -21.7pp · 2024: -43.2pp
- All cycles
- 2024: R+43.2 2020: R+38.9 2016: R+42.3 2012: R+25.3 2008: R+21.7
Not yet ingested
- Civics
- —
Market trends
- HPI YoY
- ▲ 5.11%
- Current HPI
- 257.4957
- Rent YoY
- —
- Metro
- —
- State GDP YoY
- ▲ 2.60%
- F500 in state
- 92
Industry mix (Fortune 500 HQ in NY)
| Industry | F500 HQs | Revenue |
|---|---|---|
| Financial Services | 10 | $950B |
|
||
| Consumer Goods | 9 | $162B |
|
||
| Insurance | 4 | $225B |
|
||
| Telecommunications | 2 | $144B |
|
||
| Pharmaceuticals | 2 | $112B |
|
||
| Media / Entertainment | 2 | $69B |
|
||
Price history
1 event — show timeline
- 2026-02-26 Listed $32,108 CNYIS
Cash-flow waterfall
monthlySold comps — $/sqft
last 12 mo · ≤1 miLoading sold comps…