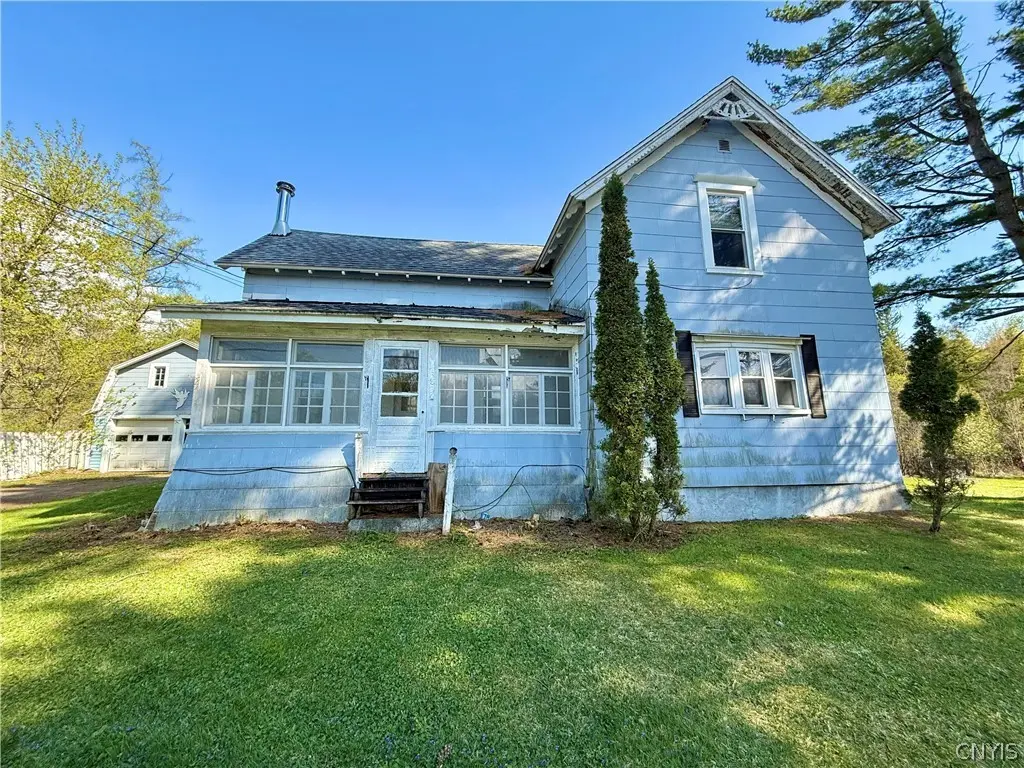
43836 County Route 41 · Natural Bridge, NY
Flood risk 1/10 · Minimal
- FEMA flood zone
- X
- Chance of flooding over 30 yrs
- 0.0%
- Est. flood insurance / yr
- $473 – $860
Fire risk 3/10 · Minor
- Est. fire insurance / yr
- $691 – $1,283
Heat risk 1/10 · Minimal
- Hot days now (above 90°F)
- 7 days/yr
- Hot days in 30 yrs
- 16 days/yr
Wind risk 1/10 · Minimal
- Chance of severe wind over 30 yrs
- —
Air-quality risk 2/10 · Minimal
- Unhealthy air days now
- 0 days/yr
- Unhealthy air days in 30 yrs
- 1 days/yr
Risk factors via First Street. Map © Google.
Why this score? — see what drove the B grade
The composite is a weighted blend of 9 inputs, each scored 0–100. Each bar is that input's sub-score; the figure is the points it added to the 100-point composite (weight × sub-score).
- Cash flow +30.0/30.0
- 1% rule +10.0/10.0
- DSCR +10.0/10.0
- ARV discount +7.5/15.0
- Appreciation +5.4/10.0
- Schools +3.3/10.0
- Livability +2.9/5.0
- Rent growth +2.5/5.0
- Condition / age +2.5/5.0
$59,900
🖨 Deal sheet 📄 Offer letter ✓ Due diligence
Listing remarks
Opportunity awaits with this fixer-upper situated on nearly a half acre of land! This home offers a spacious layout featuring a kitchen, living room, dining room, oversized bathroom, two bedrooms, and a garage. With plenty of potential for renovation and personalization, this property is perfect for investors, flippers, or buyers looking to create their dream home. Conveniently sized lot provides room for outdoor enjoyment, gardening, or future improvements. Bring your vision and tools — this property is ready for a transformation!
Key facts
- Nearly a half acre
- Spacious layout
- 0.4 acre lot
Tags
Property features AI
Exterior
- Parking: Detached garage; 2 garage spaces
- Utilities: Well water; Septic tank
- Home design: Single-story property; Existing construction; Shingle roof; Poured foundation
- Construction: Shingle roof; Poured foundation; Construction details: see remarks
- Exterior features: Gravel driveway; Rectangular residential lot (approx. 0.404 acres, 108 x 163); City street frontage
Interior
- Kitchen: Electric oven; Electric range; Refrigerator
- Flooring: Laminate flooring; Varied flooring
- Bathrooms: One full bathroom (main level)
- Heating & cooling: Propane forced-air heating
- Interior features: Separate/formal dining room; Eat-in kitchen; Separate/formal living room; Full basement
- Laundry & utility: Main-level laundry; Electric water heater
Neighborhood map
What this means for you Summary
Snapshot
- This is a 2-bed/1.0-bath single-family listed at $60k.
Deal economics
- At list price, monthly cash flow is $430 ($5k/yr) — positive.
- The deal already cash-flows at list — no discount required.
- Meets the 1% rule at list price ($1k rent vs $60k).
- Recommended offer: $58k (3.0% below list) — sets the bar for market timing.
Location & tenants
- Location reads 58/100 on livability (#1,057 in NY) — a working-class tenant base; expect higher turnover. Strengths: cost of living A+; Watch: housing D+, schools D, health & safety D.
- Carthage Central School District (rural): math 30% / reading 46% proficiency, ranked #539 of 590 in NY (top 91%) — families likely to look elsewhere, expect single-tenant / working-renter base with shorter leases.
- Market conditions: 6 active listings in the ZIP; 196 units permitted in Jefferson County in 2024 (0 in 5+ unit buildings).
Forward outlook
- In year one you build about $939 of equity ($414 loan paydown + $525 appreciation (0.9% local appreciation)).
- Jefferson County population projected at -12% by 2050 — secular population decline; favor cash flow + early exit over multi-decade hold.
- At projected returns (0.9% appreciation + 3.0% rent growth), your $17k cash investment doubles in ~3 years — after that, you're playing with house money.
Negotiation context
- It's been on market 41 days — a 3% lower offer ($58k) is reasonable based on typical stale-listing flexibility.
- 6 sale attempts since 12y ago; this cycle's ask has dropped $5k (8%) from the opening price — seller is motivated, your offer sets the floor, not the list.
- Current owner paid $52k; 16% above their basis — modest negotiation headroom, anchor on the comps not their cost.
Risks & watch-outs
- Watch-outs: property tax is 2.6% of price; built in 1900 — expect roof / HVAC / electrical / plumbing capex.
Questions for the listing agent
- It's been on market 41 days. Have you received any prior offers? Is the seller open to a 3% concession, seller financing, or rate buy-down credit?
- Built in 1900 — when were the roof, HVAC, electrical panel, plumbing, and water heater last replaced?
- Property tax is high relative to price — has the assessment been appealed recently, and will the sale trigger a re-assessment?
- Is there a deadline driving the sale (1031 exchange, divorce, estate, relocation)? That informs how much negotiation room exists.
- Schools are D-rated, which usually means shorter tenancies and higher turnover. Who's the typical renter profile here, and what's been the actual vacancy rate?
- Crime grade is F in this area — have there been break-ins, vandalism, or insurance claims at this property in the last 3 years? What carrier currently insures it and at what premium?
- What's the average days-on-market for RENTAL listings here right now (not sales)? A rising rental-DOM trend means longer vacancies and softer asking-rent achievability than the comps imply.
- What's the recent tenant-quality profile in this submarket — average credit score on applications, eviction rate, late-payment / NSF rate, and stable-employment percentage? A property-management company in the area should have these aggregated.
- How much new for-sale + rental construction is in the pipeline within 1–3 miles? Heavy new supply typically softens prices + rents 12–24 months out; constrained supply supports both.
Investment metrics
- 1% rule
- 1.90% ✓
- Cap rate
- 14.91%
- Cash-on-cash
- 30.76%
- DSCR
- 2.37
- GRM
- 4.4
CMA / ARV
- ARV (median comp)
- $300,026
- List price
- $59,900
- Delta
- -80.04%
- Verdict
- UNDERPRICED
- Comps
- 6 within 1.0 mi
Show comp detail 1 sale within ~0.75 mi
| Address | Dist | Beds/Ba | Sqft | Sold | Price | $/sf | Match |
|---|---|---|---|---|---|---|---|
| 12867 N Croghan Rd | 0.59mi | 3/2.0 (+1) | 1,456 (-0%) | 1mo | $333,890 | $229 | 62 |
Match score weights: distance 35% · size 25% · config 20% · recency 20%. Top-matched comps best support the ARV.
Projected returns pro-forma
0.88% appreciation · 3.0% rent growth · sell at horizon
- IRR
- 32.9%
- Equity multiple
- 2.68×
- Total profit
- $28,197
- Equity at exit
- $20,066
- IRR
- 35.4%
- Equity multiple
- 5.22×
- Total profit
- $70,829
- Equity at exit
- $26,373
Cash invested: $16,772 (down + closing). Projections, not guarantees.
Landlord ↔ Tenant lean methodology
- Overall (STATE)
- 15 Strongly Tenant-Friendly
- State New York
- 15 Strongly Tenant-Friendly · D+10
- County
- — inherits STATE
- City
- — inherits STATE
ZIP-level market 13665
- Home prices YoY
- 0.2%
- Active inventory
- 6
- Price-to-rent
- 4.4×
Monthly cashflow live
- Estimated rent
- $1,137 medium interval (Pro) →
- Mortgage (P&I)
- −$314
- Tax from tax record
- −$129 /mo · $1,546/yr
- Insurance
- −$25
- HOA
- −$0
- Vacancy / Maint / Mgmt
- −$239
- Net cashflow
- $430
Break-even live
UW: 25.0% down · 7.5% · 30yr · 1.5% tax · 5.0% vac · 8.0% maint · 8.0% mgmt
Financing live
Cash to close
- Down payment
- $14,975
- Closing costs
- $1,797
- Reserves months
- —
- Total cash needed
- —
Loan-product check · same deal, 3 products live
Conventional
25% down · 7.5% · 30yr
- Down + closing
- —
- Monthly P&I
- —
- Monthly cashflow
- —
- DSCR
- —
- Eligible?
- —
Personal DTI + credit; lowest rate.
DSCR
20% down · 8.5% · 30yr
- Down + closing
- —
- Monthly P&I
- —
- Monthly cashflow
- —
- DSCR
- —
- Eligible?
- —
No personal income docs; deal must DSCR.
Hard money
10% down · 12.0% · 12mo
- Down + closing
- —
- Monthly P&I
- —
- Monthly cashflow
- —
- DSCR
- —
- Eligible?
- —
Short-term bridge; refi at stabilization.
Listing history 33 events
-
2026-06-19days on market $59,900 Active 41 DOM
-
2026-06-18days on market $59,900 Active 40 DOM
-
2026-06-17days on market $59,900 Active 39 DOM
-
2026-06-16days on market $59,900 Active 38 DOM
-
2026-06-15days on market $59,900 Active 37 DOM
-
2026-06-14days on market $59,900 Active 35 DOM
-
2026-06-12pricedays on market $59,900 Active 34 DOM
-
2026-06-09days on market $64,900 Active 31 DOM
-
2026-06-08days on market $64,900 Active 30 DOM
-
2026-06-07days on market $64,900 Active 29 DOM
-
2026-06-05days on market $64,900 Active 26 DOM
-
2026-06-03days on market $64,900 Active 25 DOM
-
2026-06-02days on market $64,900 Active 24 DOM
-
2026-06-01days on market $64,900 Active 23 DOM
-
2026-05-31days on market $64,900 Active 22 DOM
-
2026-05-30days on market $64,900 Active 21 DOM
-
2026-05-09$64,900 Active 543-char remark
-
2026-01-01historical
-
2025-12-11price $60,000
-
2025-10-27price $63,500
-
2025-10-07price $70,000
-
2025-09-16price $75,000
-
2025-08-21price $80,000
-
2025-07-24$84,900 Active
-
2017-09-21historical
-
2017-05-22$69,500
-
2017-02-28historical
-
2015-05-04$58,900
-
2015-03-01historical
-
2014-08-25historical
-
2014-08-25$75,000
-
2014-05-08$85,000
-
2005-08-04soldstatus $51,500
ⓘ Source: listings_history table (triggers on properties + properties_extension) + one-shot
backfill from property_details.listing_events for pre-trigger history.
Tax reassessment forecast NY · Partial reset (capped growth)
- Current annual tax
- $1,546 · $129/mo
- Projected year-2 tax
- $1,546 · $129/mo
- Expected delta
- $0/yr ($0/mo · 0.0%)
ⓘ Screening estimate from a state-policy table — verify with the county assessor before closing.
Climate risk First Street
- Flood 1/10 Low FEMA zone X · 0% chance over 30 yrs
- Wildfire 3/10 Moderate
- Heat 1/10 Low 7 d/yr ≥90°F today · 16 d/yr by 30 yrs out
- Wind 1/10 Low
- Air quality 2/10 Low 0 unhealthy d/yr today · 1 by 30 yrs out
Nearby sold comps map
Loading sold comps map…
Walkable amenities ~0.75 mi
Loading nearby amenities…
Taxation est. · year 1
- Rental income
- $13,639
- − Mortgage interest
- −$3,355
- − Property taxes
- −$1,546
- − Insurance
- −$300
- − Repairs & maintenance
- −$1,091
- − Management
- −$1,091
- − Depreciation
- −$1,743
- Taxable income
- $4,513
- Est. tax owed @ 24.0%
- −$1,083
- After-tax cash flow
- $4,077/yr
For passive investors: Depreciation is non-cash, so a rental often shows a tax loss while cash-flowing — sheltering income. Rental losses are passive: they offset passive income freely, and up to $25,000/yr can offset ordinary (W-2) income if you actively participate and your MAGI is under $100k (phasing out to $0 by $150k); unused losses carry forward. On sale, claimed depreciation is recaptured at up to 25%, and gains may owe capital-gains tax (a 1031 exchange can defer both). Figures are a year-1 estimate at your 24.0% rate — not tax advice; consult a CPA.
Schools (NCES district)
- District
- Carthage Central School District
- NCES district ID
- 3606630
- Math proficiency
- 30% ▼ -18.00%
- Reading proficiency
- 46% ▲ 2.00%
- Median HH income
- $48,450
- Composite
- 32.63/100
- National rank
- #5668
- State rank
- #539 of 590 in NY
Livability — Natural Bridge
- Score
- 58/100
- State rank
- #1057
- US rank
- #21119
Category grades
Schools grade is shown separately in the Schools card above.
Census & demographics
- Census place
- Natural Bridge, NY
- Population (ZIP)
- 686
Population outlook (Jefferson County) Hauer SSP2
- Today (2025)
- 111,748 people
- By 2030
- 109,370 · -2.1%
- By 2040
- 103,828 · -7.1%
- By 2050
- 98,523 · -11.8%
- By 2075
- 91,422 · -18.2%
- By 2100
- 78,214 · -30.0%
Race, ethnicity, and origin ACS 2023
- Neighborhood character
- Predominantly White (97%)
- Race & ethnicity
- White 97% Black 2%
- Common ancestry
- Romanian 3% Lithuanian 2% German 1%
- Languages at home
- 98% English-only · Other Indo-European 2%
Political lean MEDSL · Jefferson
- 2024 margin
- Strong R (+23.6) · D 38.2% · R 61.8%
- 2008→2024 swing
- -18.3pp toward R · 2008: -5.3pp · 2024: -23.6pp
- All cycles
- 2024: R+23.6 2020: R+19.0 2016: R+22.4 2012: R+2.9 2008: R+5.3
Not yet ingested
- Civics
- —
Market trends
- HPI YoY
- ▲ 0.88%
- Current HPI
- 379.8545
- Rent YoY
- —
- Metro
- —
- State GDP YoY
- ▲ 2.60%
- F500 in state
- 92
Industry mix (Fortune 500 HQ in NY)
| Industry | F500 HQs | Revenue |
|---|---|---|
| Financial Services | 10 | $950B |
|
||
| Consumer Goods | 9 | $162B |
|
||
| Insurance | 4 | $225B |
|
||
| Telecommunications | 2 | $144B |
|
||
| Pharmaceuticals | 2 | $112B |
|
||
| Media / Entertainment | 2 | $69B |
|
||
Price history
+16.3% since first listed18 events — show timeline
- 2026-06-11 Price Changed $59,900 CNYIS
- 2026-05-09 Listed $64,900 CNYIS
- 2026-01-01 Listing Removed — CNYIS
- 2025-12-11 Price Changed $60,000 CNYIS
- 2025-10-27 Price Changed $63,500 CNYIS
- 2025-10-07 Price Changed $70,000 CNYIS
- 2025-09-16 Price Changed $75,000 CNYIS
- 2025-08-21 Price Changed $80,000 CNYIS
- 2025-07-24 Listed $84,900 CNYIS
- 2017-09-21 Listing Removed — CNYIS
- 2017-05-22 Listed $69,500 CNYIS
- 2017-02-28 Listing Removed — CNYIS
- 2015-05-04 Listed $58,900 CNYIS
- 2015-03-01 Listing Removed — CNYIS
- 2014-08-25 Listed $75,000 CNYIS
- 2014-08-25 Listing Removed — CNYIS
- 2014-05-08 Listed $85,000 CNYIS
- 2005-08-04 Sold (Public Records) $51,500 Public Records
Property tax history
-1.3%/yrLatest (2025): $1,546 · -1.3% YoY. Source: county tax records.
Cash-flow waterfall
monthlySold comps — $/sqft
last 12 mo · ≤1 miLoading sold comps…