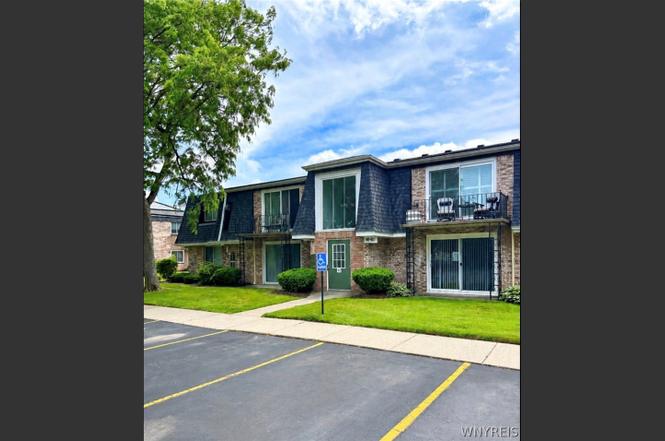
114B Foxberry Dr · University at Buffalo, NY
Flood risk 1/10 · Minimal
- FEMA flood zone
- X (shaded)
- Chance of flooding over 30 yrs
- 0.0%
- Est. flood insurance / yr
- $473 – $860
Fire risk 3/10 · Minor
- Est. fire insurance / yr
- $691 – $1,283
Heat risk 3/10 · Minor
- Hot days now (above 94°F)
- 7 days/yr
- Hot days in 30 yrs
- 16 days/yr
Wind risk 1/10 · Minimal
- Chance of severe wind over 30 yrs
- —
Air-quality risk 3/10 · Minor
- Unhealthy air days now
- 2 days/yr
- Unhealthy air days in 30 yrs
- 3 days/yr
Risk factors via First Street. Map © Google.
Why this score? — see what drove the C grade
The composite is a weighted blend of 9 inputs, each scored 0–100. Each bar is that input's sub-score; the figure is the points it added to the 100-point composite (weight × sub-score).
- Cash flow +19.2/30.0
- ARV discount +10.1/15.0
- 1% rule +6.7/10.0
- Schools +6.3/10.0
- DSCR +6.1/10.0
- Livability +4.4/5.0
- Rent growth +2.5/5.0
- Condition / age +2.5/5.0
- Appreciation +0.0/10.0
$153,999
🖨 Deal sheet 📄 Offer letter ✓ Due diligence
Listing remarks
KICK BACK AND RELAX and let someone else do all the work. Foxberry Village handles all the maintenance while you enjoy the comforts of home. This two-bedroom condo is big enough for daily living without the hassle of having too much to maintain. Great location in the Willamsville School District and a short drive to University at Buffalo’s North Campus and all things Northtowns living has to offer. Generous size in the living room, both bedrooms, kitchen and dining room. Enjoy sitting on a private balcony or sitting next to the community pool. The pool and common laundry area are just steps away, providing leisure and convenience without leaving the grounds. Showings begin immediately
Key facts
- Community pool
- Common laundry area
- Private balcony
Tags
Property features AI
Finance
- Financial info: Pets allowed with size limit (maximum pet weight 10 lb)
- HOA & community: Managed by DEE Property Mgt; Association fee of $239; Association fee covers common area maintenance, structure maintenance, reserve fund, snow removal, and trash; Association amenities include a pool
Exterior
- Parking: No garage; open parking available
- Security: Intercom system
- Utilities: Public water; Sewer connected; Cable available; High-speed internet available; Circuit breaker electrical service
- Home design: Single-story property; Brick construction; Asphalt roof; Slab foundation; Existing (resale) condition; Lot dimensions approximately 36 x 24
- Construction: Built with brick; Asphalt roof; Slab foundation
- Exterior features: Balcony; Near public transit; Rectangular lot
Interior
- Kitchen: Dishwasher; Electric cooktop; Electric oven; Electric range; Microwave; Refrigerator; Gas water heater
- Bedrooms: Upper-level laundry (property has laundry area on the upper level)
- Flooring: Carpet; Tile; Varied flooring
- Bathrooms: 1 full bathroom
- Heating & cooling: Gas forced-air heating; Central air conditioning
- Interior features: Ceiling fan(s); Sliding doors / sliding glass doors; Separate formal dining room; Country-style kitchen; Solid surface counters; Natural woodwork; Intercom; Accessible doors
- Laundry & utility: Laundry located on upper level
Neighborhood map
What this means for you Summary
Snapshot
- This is a 2-bed/1.0-bath townhouse listed at $154k.
Deal economics
- At list price, monthly cash flow is $166 ($2k/yr) — positive.
- The deal already cash-flows at list — no discount required.
- Meets the 1% rule at list price ($2k rent vs $154k).
- Cap rate 7.6% vs local median 2.8% in University at Buffalo — top-decile yield for the area; either an underpriced asset or a hidden risk that comps aren't pricing in. Stress-test before assuming the spread holds.
Location & tenants
- Location reads 88/100 on livability (#9 in NY, #176 nationally) — a professional / high-income tenant draw. Strengths: schools A+, amenities A+, commute A+; Watch: cost of living D+, employment F.
- Williamsville Central School District (suburban): math 64% / reading 77% proficiency, ranked #114 of 590 in NY (top 19%) — strong family-tenant draw, lease renewals of 3-5y typical; only 10% free/reduced lunch — higher-income household profile.
- Market conditions: 34 active listings in the ZIP; 3 comparable units currently listed for rent nearby; rentals leasing fast (median 2d on market — plan ~1-2 weeks tenant-placement turnaround); 1,244 units permitted in Erie County in 2024 (563 in 5+ unit buildings).
Forward outlook
- Local home prices are declining (-3.0%/yr); year-one equity from $1k of loan paydown is wiped out by about $5k of value loss. Plan a longer hold.
Negotiation context
- Only 2 days on market — expect competitive offers; lowballing is unlikely to land.
- Current owner paid $120k; 28% above their basis — modest negotiation headroom, anchor on the comps not their cost.
Questions for the listing agent
- Built in 1972 — when were the roof, HVAC, electrical panel, plumbing, and water heater last replaced?
- What does the HOA fee cover, when was the last increase, and are there any pending special assessments or reserve-fund shortfalls?
- Is there a deadline driving the sale (1031 exchange, divorce, estate, relocation)? That informs how much negotiation room exists.
- Schools are A-rated — typically a magnet for longer-tenancy family renters. What's the average tenant stay here, and is there a school-zone premium baked into asking?
- What's the average days-on-market for RENTAL listings here right now (not sales)? A rising rental-DOM trend means longer vacancies and softer asking-rent achievability than the comps imply.
- What's the recent tenant-quality profile in this submarket — average credit score on applications, eviction rate, late-payment / NSF rate, and stable-employment percentage? A property-management company in the area should have these aggregated.
- How much new for-sale + rental construction is in the pipeline within 1–3 miles? Heavy new supply typically softens prices + rents 12–24 months out; constrained supply supports both.
Investment metrics
- 1% rule
- 1.17% ✓
- Cap rate
- 7.59%
- Cash-on-cash
- 4.62%
- DSCR
- 1.21
- GRM
- 7.1
CMA / ARV
- ARV (on-the-fly)
- $163,620
- Comps found
- 12
Show comp detail 12 sales within ~0.75 mi
| Address | Dist | Beds/Ba | Sqft | Sold | Price | $/sf | Match |
|---|---|---|---|---|---|---|---|
| 98 Foxberry Dr Unit A | 0.04mi | 2/1.0 | 810 (0%) | 0mo | $145,000 | $179 | 98 |
| 50A Foxberry | 0.09mi | 2/1.0 | 810 (0%) | 0mo | $164,900 | $204 | 95 |
| 136A Foxberry Dr | 0.04mi | 2/1.0 | 810 (0%) | 6mo | $156,000 | $193 | 93 |
| 104 Foxberry Dr | 0.05mi | 2/1.0 | 810 (0%) | 8mo | $164,000 | $202 | 91 |
| 72 Foxberry Dr Unit A | 0.12mi | 2/1.0 | 810 (0%) | 5mo | $182,000 | $225 | 90 |
| 104 Foxberry Dr Unit A | 0.04mi | 2/1.0 | 810 (0%) | 11mo | $164,000 | $202 | 89 |
| 114 A Foxberry Dr | 0.00mi | 2/1.0 | 810 (0%) | 15mo | $174,000 | $215 | 88 |
| 10 Foxberry Dr Unit 10B | 0.03mi | 2/1.0 | 810 (0%) | 14mo | $159,650 | $197 | 87 |
| 40A Foxberry Dr | 0.05mi | 2/1.0 | 810 (0%) | 14mo | $178,000 | $220 | 86 |
| 80 Foxberry Dr Unit B | 0.13mi | 2/1.0 | 810 (0%) | 16mo | $165,000 | $204 | 81 |
| 116 Foxberry B Dr | 0.00mi | 2/1.0 | 895 (+10%) | 4mo | $180,000 | $201 | 79 |
| 78 B Foxberry Dr | 0.11mi | 2/1.0 | 895 (+10%) | 8mo | $169,000 | $189 | 71 |
Match score weights: distance 35% · size 25% · config 20% · recency 20%. Top-matched comps best support the ARV.
Projected returns pro-forma
-3.0% appreciation · 3.0% rent growth · sell at horizon
- IRR
- -9.0%
- Equity multiple
- 0.67×
- Total profit
- $-14,221
- Equity at exit
- $22,962
- IRR
- 0.6%
- Equity multiple
- 1.04×
- Total profit
- $1,852
- Equity at exit
- $13,315
Cash invested: $43,120 (down + closing). Projections, not guarantees.
Landlord ↔ Tenant lean methodology
- Overall (STATE)
- 15 Strongly Tenant-Friendly
- State New York
- 15 Strongly Tenant-Friendly · D+10
- County
- — inherits STATE
- City
- — inherits STATE
ZIP-level market 14068
- Home prices YoY
- -16.3%
- Active inventory
- 34
- Price-to-rent
- 7.1×
Monthly cashflow live
- Estimated rent
- $1,809 medium interval (Pro) →
- Mortgage (P&I)
- −$808
- Tax from tax record
- −$152 /mo · $1,826/yr
- Insurance
- −$64
- HOA
- −$239
- Vacancy / Maint / Mgmt
- −$380
- Net cashflow
- $166
Break-even live
UW: 25.0% down · 7.5% · 30yr · 1.5% tax · 5.0% vac · 8.0% maint · 8.0% mgmt
Financing live
Cash to close
- Down payment
- $38,500
- Closing costs
- $4,620
- Reserves months
- —
- Total cash needed
- —
Loan-product check · same deal, 3 products live
Conventional
25% down · 7.5% · 30yr
- Down + closing
- —
- Monthly P&I
- —
- Monthly cashflow
- —
- DSCR
- —
- Eligible?
- —
Personal DTI + credit; lowest rate.
DSCR
20% down · 8.5% · 30yr
- Down + closing
- —
- Monthly P&I
- —
- Monthly cashflow
- —
- DSCR
- —
- Eligible?
- —
No personal income docs; deal must DSCR.
Hard money
10% down · 12.0% · 12mo
- Down + closing
- —
- Monthly P&I
- —
- Monthly cashflow
- —
- DSCR
- —
- Eligible?
- —
Short-term bridge; refi at stabilization.
Rent comps 3 comps
| Address | Beds | Baths | Sqft | Rent | $/sqft | DOM | Units | Dist |
|---|---|---|---|---|---|---|---|---|
| 3253 Millersport Hwy Getzville, NY | 2.0 | 2.0 | 1069 | $1,995 | $1.87 | 2d | 26 | 0.93mi |
| 2635 N Forest Rd Unit Type G Getzville, NY | 1.0 | 1.0 | 705 | $1,699 | $2.41 | 2d | 1 | 1.29mi |
| 2250 N French Rd Getzville, NY | 1.0–2.0 | 1.0 | 814 | $1,700 | $2.09 | 2d | 1 | 1.40mi |
HOA detail
- Monthly dues
- $239 · $2,868/yr
- Likely covers
- landscapingpool
Listing history 3 events
-
2026-06-18days on market $153,999 Active 2 DOM
-
2026-06-16remarks 693-char remark
-
2026-06-16$153,999 Active 1 DOM
ⓘ Source: listings_history table (triggers on properties + properties_extension) + one-shot
backfill from property_details.listing_events for pre-trigger history.
Tax reassessment forecast NY · Partial reset (capped growth)
- Current annual tax
- $1,826 · $152/mo
- Projected year-2 tax
- $2,214 · $185/mo
- Expected delta
- +$388/yr (+$32/mo · 21.3%)
ⓘ Screening estimate from a state-policy table — verify with the county assessor before closing.
Climate risk First Street
- Flood 1/10 Low FEMA zone X (shaded) · 0% chance over 30 yrs
- Wildfire 3/10 Moderate
- Heat 3/10 Moderate 7 d/yr ≥94°F today · 16 d/yr by 30 yrs out
- Wind 1/10 Low
- Air quality 3/10 Moderate 2 unhealthy d/yr today · 3 by 30 yrs out
Nearby sold comps map
Loading sold comps map…
Walkable amenities ~0.75 mi
Loading nearby amenities…
Taxation est. · year 1
- Rental income
- $21,708
- − Mortgage interest
- −$8,626
- − Property taxes
- −$1,826
- − Insurance
- −$770
- − Repairs & maintenance
- −$1,737
- − Management
- −$1,737
- − HOA
- −$2,868
- − Depreciation
- −$4,480
- Taxable loss
- −$336
- Est. tax savings @ 24.0%
- +$81
- After-tax cash flow
- $2,075/yr
For passive investors: Depreciation is non-cash, so a rental often shows a tax loss while cash-flowing — sheltering income. Rental losses are passive: they offset passive income freely, and up to $25,000/yr can offset ordinary (W-2) income if you actively participate and your MAGI is under $100k (phasing out to $0 by $150k); unused losses carry forward. On sale, claimed depreciation is recaptured at up to 25%, and gains may owe capital-gains tax (a 1031 exchange can defer both). Figures are a year-1 estimate at your 24.0% rate — not tax advice; consult a CPA.
Schools (NCES district)
- District
- Williamsville Central School District
- NCES district ID
- 3631470
- Math proficiency
- 64% ▼ -14.00%
- Reading proficiency
- 77% ▲ 6.00%
- Median HH income
- $79,907
- Composite
- 62.59/100
- National rank
- #678
- State rank
- #114 of 590 in NY
Livability — University at Buffalo
- Score
- 88/100
- State rank
- #9
- US rank
- #176
Category grades
Schools grade is shown separately in the Schools card above.
Census & demographics
- City population
- 5,827
- Population (ZIP)
- 8,504
Population outlook (Erie County) Hauer SSP2
- Today (2025)
- 933,037 people
- By 2030
- 935,181 · +0.2%
- By 2040
- 928,531 · -0.5%
- By 2050
- 905,725 · -2.9%
- By 2075
- 834,037 · -10.6%
- By 2100
- 708,033 · -24.1%
Race, ethnicity, and origin ACS 2023
- Neighborhood character
- Predominantly White (81%)
- Race & ethnicity
- White 81% Two or more races 9% Asian 6% Black 4% Hispanic / Latino 2%
- Common ancestry
- Romanian 12% Scotch-Irish 3% Scandinavian 2%
- Foreign-born
- 11% · China, Canada, South Korea
- Languages at home
- 88% English-only · Other Indo-European 4% Chinese 3% Russian/Polish/Slavic 2%
Political lean MEDSL · Erie
- 2024 margin
- Lean D (+9.7) · D 54.8% · R 45.2%
- 2008→2024 swing
- -7.9pp toward R · 2008: 17.5pp · 2024: 9.7pp
- All cycles
- 2024: D+9.7 2020: D+14.7 2016: D+4.8 2012: D+15.6 2008: D+17.5
Not yet ingested
- Civics
- —
Market trends
- HPI YoY
- ▼ -61.31%
- Current HPI
- 314.5567
- Rent YoY
- —
- Metro
- —
- State GDP YoY
- ▲ 2.60%
- F500 in state
- 92
Industry mix (Fortune 500 HQ in NY)
| Industry | F500 HQs | Revenue |
|---|---|---|
| Financial Services | 10 | $950B |
|
||
| Consumer Goods | 9 | $162B |
|
||
| Insurance | 4 | $225B |
|
||
| Telecommunications | 2 | $144B |
|
||
| Pharmaceuticals | 2 | $112B |
|
||
| Media / Entertainment | 2 | $69B |
|
||
Price history
+175.0% since first listed3 events — show timeline
- 2026-06-16 Listed $153,999 WNYREIS
- 2021-02-10 Sold (Public Records) $120,000 Public Records
- 2003-12-01 Sold (Public Records) $56,000 Public Records
Property tax history
+16.3%/yrLatest (2025): $1,826 · +1.0% YoY. Source: county tax records.
Cash-flow waterfall
monthlySold comps — $/sqft
last 12 mo · ≤1 miLoading sold comps…