 🌊 Lakefront
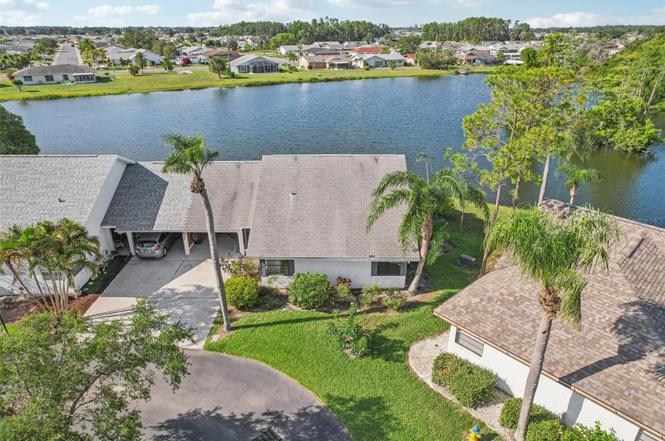
1613 Comfy Ct · Sun City Center, FL
Flood risk 8/10 · Major
- FEMA flood zone
- X (unshaded)
- Chance of flooding over 30 yrs
- 0.99%
- Est. flood insurance / yr
- $507 – $1,088
Fire risk 3/10 · Minor
- Est. fire insurance / yr
- $947 – $1,759
Heat risk 10/10 · Severe
- Hot days now (above 109°F)
- 7 days/yr
- Hot days in 30 yrs
- 28 days/yr
Wind risk 9/10 · Severe
- Chance of severe wind over 30 yrs
- 99.0%
Air-quality risk 3/10 · Minor
- Unhealthy air days now
- 3 days/yr
- Unhealthy air days in 30 yrs
- 3 days/yr
Risk factors via First Street. Map © Google.
Why this score? — see what drove the D grade
The composite is a weighted blend of 9 inputs, each scored 0–100. Each bar is that input's sub-score; the figure is the points it added to the 100-point composite (weight × sub-score).
- Cash flow +10.9/30.0
- ARV discount +7.5/15.0
- 1% rule +4.2/10.0
- Schools +4.2/10.0
- Livability +3.9/5.0
- Appreciation +3.4/10.0
- DSCR +3.2/10.0
- Rent growth +3.2/5.0
- Condition / age +2.5/5.0
$209,900
🖨 Deal sheet 📄 Offer letter ✓ Due diligence
Listing remarks
Welcome to this stunning 2-bedroom, 2-bath waterfront home tucked away on a quiet cul-de-sac street! Enjoy peaceful water views from nearly every room, with tall ceilings, expansive sliders, and an abundance of windows that fill the home with natural light. Beautiful laminate flooring flows throughout the spacious layout. The large primary suite features a walk-in closet and a private bath, creating a comfortable retreat. The generous kitchen offers warm wood cabinetry, a pantry, and plenty of counter space—ideal for both everyday living and entertaining. Additional highlights include a separate laundry room and a screened-in lanai, perfect for relaxing while taking in the tranquil su
Key facts
- Laminate flooring
- Waterfront home
- Tall ceilings
Tags
Property features AI
Finance
- Other: Zoning: PD-MU
- Financial info: Total annual fees $1,690 (total monthly fees $140.83); Lease restrictions apply
- HOA & community: Has HOA (monthly fee $112) — association approval required; HOA includes pool, management, and recreational facilities; Community amenities: fitness center, pool, tennis courts, recreation facilities, golf, golf carts allowed; Deed restrictions and special community restrictions; Senior community; Pets allowed
Exterior
- Parking: Driveway; 1-car carport
- Utilities: Public water; Public sewer; Cable available; Electricity available
- Home design: Single family residence; One story; North-facing
- Construction: Block and stucco construction; Shingle roof; Slab foundation; Built on a 50 x 61 lot
- Exterior features: Covered screened rear porch; Sliding doors; Mature landscaping; Located on a cul-de-sac; City limits, in county; Level lot
Interior
- Kitchen: Dishwasher; Range; Refrigerator
- Bedrooms: 2 bedrooms
- Flooring: Ceramic tile; Laminate
- Bathrooms: 2 full bathrooms
- Heating & cooling: Central heating; Central air conditioning
- Interior features: Ceiling fans; Eat-in kitchen; High ceilings; Living room / dining room combo; Open floorplan; Solid surface counters; Solid wood cabinets; Walk-in closet(s); Inside utility
- Laundry & utility: Inside laundry room
Neighborhood map
What this means for you Summary
Snapshot
- This is a 2-bed/2.0-bath single-family listed at $210k.
Deal economics
- At list price, monthly cash flow is $-159 ($-2k/yr) — negative.
- To cash-flow at today's rent, offer at most $182k (13.4% below list).
- To meet the 1% rule (rent ≥ 1% of price), the offer needs to be $193k (7.9% below list).
- Recommended offer: $182k (13.4% below list) — sets the bar for cash-flow.
Location & tenants
- Location reads 78/100 on livability (#178 in FL, #2,736 nationally) — a middle-class / working-renter tenant base. Strengths: housing A+, health & safety A+, crime B+; Watch: schools D+, amenities F.
- Hillsborough (suburban): math 47% / reading 50% proficiency, ranked #41 of 73 in FL (top 56%) — families likely to look elsewhere, expect single-tenant / working-renter base with shorter leases.
- Market conditions: Rents rising (+2.6%/yr); 602 active listings in the ZIP; 29 comparable units currently listed for rent nearby; rentals at typical pace (median 24d on market — plan ~3-4 weeks tenant-placement turnaround); 9,053 units permitted in Hillsborough County in 2024 (4,555 in 5+ unit buildings).
- This rent runs 32% of the median local income ($73k/yr) — at the standard rent-burdened threshold; future hikes will face affordability resistance.
Forward outlook
- Local home prices are declining (-3.0%/yr); year-one equity from $1k of loan paydown is wiped out by about $6k of value loss. Plan a longer hold.
- Hillsborough County population projected at +37% by 2050 — long-run rental-demand tailwind backs the buy-and-hold thesis.
Negotiation context
- Only 3 days on market — expect competitive offers; lowballing is unlikely to land.
- 3 sale attempts with the ask held roughly flat each time — persistent listings suggest the price (not the market) is what's stuck; bring a comps-based counter.
- Current owner paid $100k; list at $210k implies a 110% gain — meaningful room to come down on a strong offer.
Risks & watch-outs
- Watch-outs: flood insurance adds $66/mo.
- Climate carrying-cost: severe flood risk; severe wind risk, 99% chance of damaging wind over 30y; extreme-heat days projected 7→28/yr by 2055 (HVAC capex compounding) — expect insurance premiums to compound above CPI over the hold.
Questions for the listing agent
- What do current leases actually rent for vs. the listed asking? Can we see a recent rent roll and the last 12 months of T-12 income?
- What's the actual annual flood-insurance premium (NFIP or private), and is the property in a SFHA with mandatory coverage?
- What does the HOA fee cover, when was the last increase, and are there any pending special assessments or reserve-fund shortfalls?
- Is there a deadline driving the sale (1031 exchange, divorce, estate, relocation)? That informs how much negotiation room exists.
- Schools are D-rated, which usually means shorter tenancies and higher turnover. Who's the typical renter profile here, and what's been the actual vacancy rate?
- The area grade is low — what's the realistic commute time and amenity access for the typical tenant pool here? Any planned neighborhood developments (good or bad) we should know about?
- This sits on a lake — are riparian / water-frontage rights deeded with the parcel? Any dock permits, shoreline easements, or HOA water-use restrictions?
- What's the documented flood / surge / shoreline-erosion history here (FEMA AND non-FEMA — e.g., storm surge, creek backup, septic-field saturation)?
- Any water-quality or seasonal algae-bloom issues that affect tenant satisfaction or short-term-rental demand?
- What's the average days-on-market for RENTAL listings here right now (not sales)? A rising rental-DOM trend means longer vacancies and softer asking-rent achievability than the comps imply.
- What's the recent tenant-quality profile in this submarket — average credit score on applications, eviction rate, late-payment / NSF rate, and stable-employment percentage? A property-management company in the area should have these aggregated.
- How much new for-sale + rental construction is in the pipeline within 1–3 miles? Heavy new supply typically softens prices + rents 12–24 months out; constrained supply supports both.
Investment metrics
- 1% rule
- 0.92% ✗
- Cap rate
- 5.77%
- Cash-on-cash
- -1.88%
- DSCR
- 0.92
- GRM
- 9.1
CMA / ARV
No comps found within radius.
Projected returns pro-forma
-3.0% appreciation · 2.65% rent growth · sell at horizon
- IRR
- -22.1%
- Equity multiple
- 0.24×
- Total profit
- $-44,621
- Equity at exit
- $31,297
- IRR
- -16.8%
- Equity multiple
- 0.08×
- Total profit
- $-53,924
- Equity at exit
- $18,148
Cash invested: $58,772 (down + closing). Projections, not guarantees.
Landlord ↔ Tenant lean methodology
- Overall (STATE)
- 87 Strongly Landlord-Friendly
- State Florida
- 87 Strongly Landlord-Friendly · R+3
- County
- — inherits STATE
- City
- — inherits STATE
ZIP-level market 33573
- Home prices YoY
- -1.2%
- Rents YoY
- 2.6%
- Active inventory
- 602
- Price-to-rent
- 9.1×
Monthly cashflow live
- Estimated rent
- $1,933 high interval (Pro) →
- Mortgage (P&I)
- −$1,101
- Tax from tax record
- −$291 /mo · $3,488/yr
- Insurance
- −$87
- Flood insurance flood zone
- −$66 /mo · $798/yr
- HOA
- −$140
- Vacancy / Maint / Mgmt
- −$406
- Net cashflow
- $-159
Break-even live
UW: 25.0% down · 7.5% · 30yr · 1.5% tax · 5.0% vac · 8.0% maint · 8.0% mgmt
Financing live
Cash to close
- Down payment
- $52,475
- Closing costs
- $6,297
- Reserves months
- —
- Total cash needed
- —
Loan-product check · same deal, 3 products live
Conventional
25% down · 7.5% · 30yr
- Down + closing
- —
- Monthly P&I
- —
- Monthly cashflow
- —
- DSCR
- —
- Eligible?
- —
Personal DTI + credit; lowest rate.
DSCR
20% down · 8.5% · 30yr
- Down + closing
- —
- Monthly P&I
- —
- Monthly cashflow
- —
- DSCR
- —
- Eligible?
- —
No personal income docs; deal must DSCR.
Hard money
10% down · 12.0% · 12mo
- Down + closing
- —
- Monthly P&I
- —
- Monthly cashflow
- —
- DSCR
- —
- Eligible?
- —
Short-term bridge; refi at stabilization.
Rent comps 29 comps
| Address | Beds | Baths | Sqft | Rent | $/sqft | DOM | Units | Dist |
|---|---|---|---|---|---|---|---|---|
| 1750 Atrium Dr Sun City Center, FL | 2.0 | 2.0 | 1367 | $1,750 | $1.28 | 24d | 1 | 0.05mi |
| 1814 Columbine Pl Sun City Center, FL | 2.0 | 2.0 | 1516 | $2,100 | $1.39 | 24d | 1 | 0.33mi |
| 1904 N Pebble Beach Blvd Sun City Center, FL | 3.0 | 2.0 | 1756 | $1,600 | $0.91 | 13d | 1 | 0.44mi |
| 810 Oakmont Ave Sun City Center, FL | 2.0 | 2.0 | 1266 | $2,100 | $1.66 | 24d | 1 | 0.81mi |
| 4408 Eternal Prince Dr Sun City Center, FL | 3.0 | 2.0 | 1451 | $1,800 | $1.24 | 24d | 1 | 0.92mi |
| 15519 Telford Spring Dr Sun City Center, FL | 3.0 | 2.0 | 1348 | $2,090 | $1.55 | 24d | 1 | 0.93mi |
| 15503 Prestwick Rose Pl Unit 1 Sun City Center, FL | 3.0 | 2.5 | 1666 | $2,000 | $1.20 | 24d | 1 | 0.93mi |
| 9637 Pembrooke Pines Dr Sun City Center, FL | 2.0 | 2.5 | 1548 | $2,100 | $1.36 | 24d | 1 | 0.97mi |
| 9718 Mulberry Marsh Ln Sun City Center, FL | 3.0 | 2.5 | 1663 | $1,973 | $1.19 | 16d | 1 | 0.97mi |
| 1703 Amhurst Cir Sun City Center, FL | 2.0 | 2.0 | 1550 | $1,995 | $1.29 | 4d | 1 | 1.03mi |
| 9771 Pembrooke Pines Dr Sun City Center, FL | 3.0 | 2.5 | 1634 | $2,025 | $1.24 | 4d | 1 | 1.04mi |
| 704 Torrey Pines Ave Sun City Center, FL | 2.0 | 1.0 | 981 | $1,675 | $1.71 | 24d | 1 | 1.06mi |
| 704 Torrey Pines Ave Sun City Center, FL | 2.0 | 1.0 | 981 | $1,700 | $1.73 | 14d | 1 | 1.06mi |
| 1528 Chevy Chase Dr Sun City Center, FL | 2.0 | 2.0 | 1346 | $2,000 | $1.49 | 24d | 1 | 1.09mi |
| 15504 Florence Hollow Pl Sun City Center, FL | 3.0 | 2.5 | 1787 | $2,150 | $1.20 | 4d | 1 | 1.09mi |
| 8117 Alamosa Wood Ave Ruskin, FL | 3.0 | 2.0 | 1346 | $1,895 | $1.41 | 24d | 1 | 1.17mi |
| 1104 Desert Hills Dr Sun City Center, FL | 2.0 | 2.0 | 1383 | $1,825 | $1.32 | 17d | 1 | 1.19mi |
| 717 Indian Wells Ave Sun City Center, FL | 2.0 | 2.0 | 1264 | $1,595 | $1.26 | 24d | 1 | 1.21mi |
| 1201 Fordham Dr Sun City Center, FL | 2.0 | 2.0 | 1582 | $1,950 | $1.23 | 17d | 1 | 1.22mi |
| 714 Indian Wells Ave Sun City Center, FL | 2.0 | 2.0 | 1515 | $1,695 | $1.12 | 24d | 1 | 1.25mi |
| 3794 Maxwell Park Dr Sun City Center, FL | 2.0 | 2.0 | 1506 | $2,600 | $1.73 | 4d | 1 | 1.30mi |
| 7338 Lumber Port Dr Ruskin, FL | 3.0 | 2.0 | 1298 | $2,030 | $1.56 | 4d | 1 | 1.30mi |
| 701 Cypress Pl Sun City Center, FL | 2.0 | 2.0 | 1425 | $1,700 | $1.19 | 24d | 1 | 1.33mi |
| 7329 Lumber Port Dr Ruskin, FL | 3.0 | 2.0 | 1275 | $2,000 | $1.57 | 3d | 1 | 1.34mi |
| 1301 Warwick Ct Unit 1301 Sun City Center, FL | 1.0 | 1.0 | 1102 | $1,575 | $1.43 | 24d | 1 | 1.35mi |
| 301 Bryce Ct Sun City Center, FL | 2.0 | 2.0 | 1830 | $1,850 | $1.01 | 24d | 1 | 1.36mi |
| 3511 Great Cypress Cir Sun City Center, FL | 1.0–3.0 | 1.0–2.0 | 1163 | $2,132 | $1.83 | 1d | 27 | 1.40mi |
| 1005 Rickenbacker Dr Sun City Center, FL | 2.0 | 1.0 | 1224 | $1,595 | $1.30 | 2d | 1 | 1.40mi |
| 102 Wintersong Ln Sun City Center, FL | 2.0 | 2.0 | 1508 | $1,995 | $1.32 | 19d | 1 | 1.45mi |
HOA detail
- Monthly dues
- $140 · $1,680/yr
- Likely covers
- water
Listing history 4 events
-
2026-06-18days on market $209,900 Active 3 DOM
-
2026-06-17days on market $209,900 Active 2 DOM
-
2026-06-15remarks 693-char remark
-
2026-06-15$209,900 Active 1 DOM
ⓘ Source: listings_history table (triggers on properties + properties_extension) + one-shot
backfill from property_details.listing_events for pre-trigger history.
Tax reassessment forecast FL · Resets to sale price
- Current annual tax
- $3,488 · $291/mo
- Projected year-2 tax
- $3,488 · $291/mo
- Expected delta
- $0/yr ($0/mo · 0.0%)
ⓘ Screening estimate from a state-policy table — verify with the county assessor before closing.
Climate risk First Street
- Flood 8/10 Severe FEMA zone X (unshaded) · 99% chance over 30 yrs
- Wildfire 3/10 Moderate
- Heat 10/10 Extreme 7 d/yr ≥109°F today · 28 d/yr by 30 yrs out
- Wind 9/10 Extreme 99% chance of damaging wind over 30 yrs
- Air quality 3/10 Moderate 3 unhealthy d/yr today · 3 by 30 yrs out
Nearby sold comps map
Loading sold comps map…
Walkable amenities ~0.75 mi
Loading nearby amenities…
Taxation est. · year 1
- Rental income
- $23,190
- − Mortgage interest
- −$11,758
- − Property taxes
- −$3,488
- − Insurance
- −$1,847
- − Repairs & maintenance
- −$1,855
- − Management
- −$1,855
- − HOA
- −$1,680
- − Depreciation
- −$6,106
- Taxable loss
- −$5,399
- Est. tax savings @ 24.0%
- +$1,296
- After-tax cash flow
- $-608/yr
For passive investors: Depreciation is non-cash, so a rental often shows a tax loss while cash-flowing — sheltering income. Rental losses are passive: they offset passive income freely, and up to $25,000/yr can offset ordinary (W-2) income if you actively participate and your MAGI is under $100k (phasing out to $0 by $150k); unused losses carry forward. On sale, claimed depreciation is recaptured at up to 25%, and gains may owe capital-gains tax (a 1031 exchange can defer both). Figures are a year-1 estimate at your 24.0% rate — not tax advice; consult a CPA.
Schools (NCES district)
- District
- Hillsborough
- NCES district ID
- 1200870
- Math proficiency
- 47% ▼ -8.00%
- Reading proficiency
- 50% ▼ -4.00%
- Median HH income
- $50,622
- Composite
- 41.6/100
- National rank
- #3435
- State rank
- #41 of 73 in FL
Livability — Sun City Center
- Score
- 78/100
- State rank
- #178
- US rank
- #2736
Category grades
Schools grade is shown separately in the Schools card above.
Census & demographics
- Census place
- Sun City Center, FL
- County
- Hillsborough County · 1,540,968 people
- City population
- 35,362
- Metro
- Tampa-St. Petersburg-Clearwater, FL
- Population (ZIP)
- 35,362
- Household income
- $72,834
- Rent vs Own
- Severe rent burden
- 1382.0
Population outlook (Hillsborough County) Hauer SSP2
- Today (2025)
- 1,607,022 people
- By 2030
- 1,733,968 · +7.9%
- By 2040
- 1,979,565 · +23.2%
- By 2050
- 2,203,427 · +37.1%
- By 2075
- 2,667,893 · +66.0%
- By 2100
- 2,891,558 · +79.9%
Race, ethnicity, and origin ACS 2023
- Neighborhood character
- Predominantly White (73%)
- Race & ethnicity
- White 73% Hispanic / Latino 13% Two or more races 11% Black 10% Asian 1%
- Hispanic origin (detail)
- Mexican 1% Puerto Rican 6% Cuban 2%
- Common ancestry
- Romanian 3% Lithuanian 3% Slovak 2%
- Foreign-born
- 8% · Canada, Vietnam
- Languages at home
- 86% English-only · Spanish 10% French/Haitian/Cajun 1% German/W. Germanic 1%
Political lean MEDSL · Hillsborough
- 2024 margin
- Toss-up / Even · D 47.8% · R 50.9% · Other 1.3%
- 2008→2024 swing
- -10.2pp toward R · 2008: 7.1pp · 2024: -3.1pp
- All cycles
- 2024: R+3.1 2020: D+6.9 2016: D+6.8 2012: D+6.7 2008: D+7.1
Not yet ingested
- Civics
- —
Market trends
- HPI YoY
- ▼ -3.27%
- Current HPI
- 272.9767
- Rent YoY
- ▲ 2.65%
- Metro
- Tampa-St. Petersburg-Clearwater, FL
- State GDP YoY
- ▲ 3.28%
- F500 in state
- 36
Industry mix (Fortune 500 HQ in FL)
| Industry | F500 HQs | Revenue |
|---|---|---|
| Industrial Technology | 2 | $29B |
|
||
| Insurance | 2 | $17B |
|
||
| Retail | 1 | $60B |
|
||
| Technology Distribution | 1 | $58B |
|
||
| Homebuilding | 1 | $35B |
|
||
| Technology Manufacturing | 1 | $35B |
|
||
Price history
+183.6% since first listed7 events — show timeline
- 2026-06-15 Listed $209,900 Stellar MLS as Distributed by MLS Grid
- 2025-08-20 Relisted — Stellar MLS as Distributed by MLS Grid
- 2025-08-07 Pending — Stellar MLS as Distributed by MLS Grid
- 2025-05-22 Listed $219,000 Stellar MLS as Distributed by MLS Grid
- 2011-02-14 Sold (Public Records) $100,000 Public Records
- 1992-09-01 Sold (Public Records) $73,000 Public Records
- 1986-01-01 Sold (Public Records) $74,000 Public Records
Property tax history
+7.7%/yrLatest (2025): $3,488 · +7.5% YoY. Source: county tax records.
Cash-flow waterfall
monthlySold comps — $/sqft
last 12 mo · ≤1 miLoading sold comps…