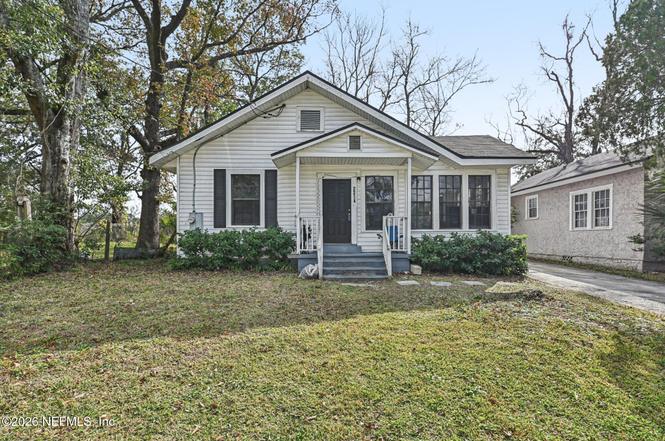
2284 Orchard St · Jacksonville, FL
Flood risk 1/10 · Minimal
- FEMA flood zone
- X (unshaded)
- Chance of flooding over 30 yrs
- 0.0%
- Est. flood insurance / yr
- $507 – $1,088
Fire risk 1/10 · Minimal
- Est. fire insurance / yr
- $947 – $1,759
Heat risk 9/10 · Severe
- Hot days now (above 107°F)
- 7 days/yr
- Hot days in 30 yrs
- 19 days/yr
Wind risk 9/10 · Severe
- Chance of severe wind over 30 yrs
- 99.0%
Air-quality risk 5/10 · Moderate
- Unhealthy air days now
- 7 days/yr
- Unhealthy air days in 30 yrs
- 7 days/yr
Risk factors via First Street. Map © Google.
Why this score? — see what drove the D+ grade
The composite is a weighted blend of 9 inputs, each scored 0–100. Each bar is that input's sub-score; the figure is the points it added to the 100-point composite (weight × sub-score).
- Cash flow +13.2/30.0
- ARV discount +12.7/15.0
- Livability +4.2/5.0
- DSCR +4.0/10.0
- 1% rule +3.9/10.0
- Schools +3.9/10.0
- Rent growth +3.0/5.0
- Condition / age +2.5/5.0
- Appreciation +0.0/10.0
$160,000
🖨 Deal sheet 📄 Offer letter ✓ Due diligence
Listing remarks MLS
This newly renovated home is move in ready! It has 3 bedrooms and 2 bathroom with 1,256 sq feet of living space and updates throughout. Call for your showing today!
Key facts
- Yard
- Private driveway
- Central a/c
Tags
Property features AI
Finance
- Other: Lot size about 0.12 acres
- Financial info: Currently used as an investment
- HOA & community: Not a senior community
Exterior
- Parking: Additional parking
- Utilities: Public sewer; Electricity connected; Sewer connected; Water connected
- Home design: Single family residence; One level
- Construction: Vinyl siding
- Exterior features: Smoke detector(s)
Interior
- Kitchen: Electric range; Refrigerator
- Bedrooms: 4 bedrooms
- Flooring: Laminate
- Bathrooms: 2 full bathrooms
- Heating & cooling: Electric heating; Central air conditioning
- Interior features: Ceiling fan(s); Pantry; Split bedrooms
Neighborhood map
What this means for you Summary
Snapshot
- This is a 4-bed/2.0-bath single-family listed at $160k.
Deal economics
- At list price, monthly cash flow is $-3 ($-34/yr) — negative.
- To cash-flow at today's rent, offer at most $159k (0.3% below list).
- To meet the 1% rule (rent ≥ 1% of price), the offer needs to be $143k (10.8% below list).
- Recommended offer: $141k (12.0% below list) — sets the bar for market timing.
- Cap rate 6.3% vs local median 4.0% in Jacksonville — top-decile yield for the area; either an underpriced asset or a hidden risk that comps aren't pricing in. Stress-test before assuming the spread holds.
Location & tenants
- Location reads 83/100 on livability (#50 in FL, #911 nationally) — a professional / high-income tenant draw. Strengths: amenities A+, commute A+, housing A+.
- Duval (urban): math 46% / reading 45% proficiency, ranked #48 of 73 in FL (top 66%) — families likely to look elsewhere, expect single-tenant / working-renter base with shorter leases.
- Market conditions: Rents rising (+1.8%/yr); 394 active listings in the ZIP; 40 comparable units currently listed for rent nearby; rentals at typical pace (median 24d on market — plan ~3-4 weeks tenant-placement turnaround); lower-income renter base — watch delinquency; 6,503 units permitted in Duval County in 2024 (1,131 in 5+ unit buildings).
- At $1,427/mo this rent would consume 56% of the median local household income ($31k/yr) (locally 2921% of renters already pay >50% of income on rent) — very limited rent-growth headroom before tenants either downsize or default.
Forward outlook
- Local home prices are declining (-3.0%/yr); year-one equity from $1k of loan paydown is wiped out by about $5k of value loss. Plan a longer hold.
- Duval County population projected at +19% by 2050 — long-run rental-demand tailwind backs the buy-and-hold thesis.
Negotiation context
- It's been on market 160 days — a 12% lower offer ($141k) is reasonable based on typical stale-listing flexibility.
- 4 sale attempts since 5y ago with the ask held roughly flat each time — persistent listings suggest the price (not the market) is what's stuck; bring a comps-based counter.
- Current owner paid $108k; 47% above their basis — modest negotiation headroom, anchor on the comps not their cost.
Risks & watch-outs
- Watch-outs: built in 1940 — expect roof / HVAC / electrical / plumbing capex.
- Climate carrying-cost: severe wind risk, 99% chance of damaging wind over 30y; extreme-heat days projected 7→19/yr by 2055 (HVAC capex compounding) — expect insurance premiums to compound above CPI over the hold.
Questions for the listing agent
- What do current leases actually rent for vs. the listed asking? Can we see a recent rent roll and the last 12 months of T-12 income?
- It's been on market 160 days. Have you received any prior offers? Is the seller open to a 12% concession, seller financing, or rate buy-down credit?
- Built in 1940 — when were the roof, HVAC, electrical panel, plumbing, and water heater last replaced?
- Why hasn't it sold? Are there any deal-killer items the seller is aware of (foundation, flood, title, zoning, code violations)?
- Is there a deadline driving the sale (1031 exchange, divorce, estate, relocation)? That informs how much negotiation room exists.
- Schools are B-rated — typically a magnet for longer-tenancy family renters. What's the average tenant stay here, and is there a school-zone premium baked into asking?
- The area grade is low — what's the realistic commute time and amenity access for the typical tenant pool here? Any planned neighborhood developments (good or bad) we should know about?
- What's the average days-on-market for RENTAL listings here right now (not sales)? A rising rental-DOM trend means longer vacancies and softer asking-rent achievability than the comps imply.
- What's the recent tenant-quality profile in this submarket — average credit score on applications, eviction rate, late-payment / NSF rate, and stable-employment percentage? A property-management company in the area should have these aggregated.
- How much new for-sale + rental construction is in the pipeline within 1–3 miles? Heavy new supply typically softens prices + rents 12–24 months out; constrained supply supports both.
Investment metrics
- 1% rule
- 0.89% ✗
- Cap rate
- 6.27%
- Cash-on-cash
- -0.08%
- DSCR
- 1.00
- GRM
- 9.3
CMA / ARV
- ARV (on-the-fly)
- $180,864
- Comps found
- 12
Show comp detail 12 sales within ~0.75 mi
| Address | Dist | Beds/Ba | Sqft | Sold | Price | $/sf | Match |
|---|---|---|---|---|---|---|---|
| 921 N Canal St | 0.16mi | 4/2.0 | 1,316 (+5%) | 2mo | $60,500 | $46 | 82 |
| 2308 Commonwealth Ave | 0.11mi | 3/2.0 (-1) | 1,209 (-4%) | 2mo | $209,000 | $173 | 82 |
| 156 Willow Branch Ave | 0.52mi | 4/2.0 | 1,268 (+1%) | 0mo | $105,000 | $83 | 74 |
| 2120 W 2nd St | 0.41mi | 3/2.0 (-1) | 1,303 (+4%) | 1mo | $239,000 | $183 | 69 |
| 2122 W 2nd St | 0.41mi | 3/2.0 (-1) | 1,303 (+4%) | 3mo | $239,000 | $183 | 67 |
| 2034 McQuade St | 0.40mi | 3/1.0 (-1) | 1,227 (-2%) | 5mo | $97,500 | $79 | 64 |
| 2028 Hartridge St | 0.41mi | 3/1.0 (-1) | 1,200 (-4%) | 4mo | $87,000 | $73 | 61 |
| 2276 Kingston St | 0.19mi | 3/2.0 (-1) | 1,080 (-14%) | 4mo | $89,500 | $83 | 60 |
| 2562 Summit St | 0.75mi | 3/2.0 (-1) | 1,268 (+1%) | 3mo | $205,000 | $162 | 56 |
| 2989 Rexford St | 0.61mi | 4/2.0 | 1,148 (-9%) | 6mo | $223,020 | $194 | 52 |
| 1980 W 3rd St | 0.63mi | 3/1.0 (-1) | 1,312 (+4%) | 5mo | $40,000 | $30 | 50 |
| 2908 Spencer St | 0.74mi | 3/2.0 (-1) | 1,100 (-12%) | 0mo | $158,000 | $144 | 39 |
Match score weights: distance 35% · size 25% · config 20% · recency 20%. Top-matched comps best support the ARV.
Projected returns pro-forma
-3.0% appreciation · 1.81% rent growth · sell at horizon
- IRR
- -17.8%
- Equity multiple
- 0.38×
- Total profit
- $-27,761
- Equity at exit
- $23,857
- IRR
- -12.4%
- Equity multiple
- 0.31×
- Total profit
- $-31,025
- Equity at exit
- $13,834
Cash invested: $44,800 (down + closing). Projections, not guarantees.
Landlord ↔ Tenant lean methodology
- Overall (STATE)
- 87 Strongly Landlord-Friendly
- State Florida
- 87 Strongly Landlord-Friendly · R+3
- County
- — inherits STATE
- City
- — inherits STATE
ZIP-level market 32209
- Home prices YoY
- -22.1%
- Rents YoY
- 1.8%
- Active inventory
- 394
- Price-to-rent
- 9.3×
Monthly cashflow live
- Estimated rent
- $1,427 high interval (Pro) →
- Mortgage (P&I)
- −$839
- Tax from tax record
- −$224 /mo · $2,690/yr
- Insurance
- −$67
- HOA
- −$0
- Vacancy / Maint / Mgmt
- −$300
- Net cashflow
- $-3
Break-even live
UW: 25.0% down · 7.5% · 30yr · 1.5% tax · 5.0% vac · 8.0% maint · 8.0% mgmt
Financing live
Cash to close
- Down payment
- $40,000
- Closing costs
- $4,800
- Reserves months
- —
- Total cash needed
- —
Loan-product check · same deal, 3 products live
Conventional
25% down · 7.5% · 30yr
- Down + closing
- —
- Monthly P&I
- —
- Monthly cashflow
- —
- DSCR
- —
- Eligible?
- —
Personal DTI + credit; lowest rate.
DSCR
20% down · 8.5% · 30yr
- Down + closing
- —
- Monthly P&I
- —
- Monthly cashflow
- —
- DSCR
- —
- Eligible?
- —
No personal income docs; deal must DSCR.
Hard money
10% down · 12.0% · 12mo
- Down + closing
- —
- Monthly P&I
- —
- Monthly cashflow
- —
- DSCR
- —
- Eligible?
- —
Short-term bridge; refi at stabilization.
Rent comps 40 comps
| Address | Beds | Baths | Sqft | Rent | $/sqft | DOM | Units | Dist |
|---|---|---|---|---|---|---|---|---|
| 2185 Kingston St Jacksonville, FL | 3.0 | 2.0 | 1230 | $1,381 | $1.12 | 23d | 1 | 0.25mi |
| 2410 McQuade St Jacksonville, FL | 3.0 | 2.0 | 1307 | $1,425 | $1.09 | 23d | 1 | 0.26mi |
| 2154 Placeda St Jacksonville, FL | 4.0 | 1.5 | 1124 | $1,500 | $1.33 | 21d | 1 | 0.28mi |
| 2012 Baldwin St Jacksonville, FL | 3.0 | 2.0 | 1232 | $1,445 | $1.17 | 23d | 1 | 0.42mi |
| 1979 Yulee St Jacksonville, FL | 3.0 | 2.0 | 1050 | $1,500 | $1.43 | 23d | 1 | 0.47mi |
| 1923 Broadway Ave Jacksonville, FL | 3.0 | 2.0 | 1230 | $1,421 | $1.16 | 23d | 1 | 0.53mi |
| 1995 W 4th St Jacksonville, FL | 4.0 | 1.5 | 1213 | $1,375 | $1.13 | 23d | 1 | 0.65mi |
| 2011 W 5th St Jacksonville, FL | 3.0 | 1.0 | 988 | $1,150 | $1.16 | 23d | 1 | 0.66mi |
| 1943 Hardee St #1 Jacksonville, FL | 3.0 | 2.0 | 1622 | $1,248 | $0.77 | 4d | 1 | 0.71mi |
| 371 Smith St Jacksonville, FL | 3.0 | 2.0 | 1050 | $1,325 | $1.26 | 4d | 1 | 0.75mi |
| 420 Sunshine St Jacksonville, FL | 3.0 | 2.0 | 1050 | $1,350 | $1.29 | 1d | 1 | 0.79mi |
| 1911 W 3rd St Jacksonville, FL | 3.0 | 1.0 | 912 | $1,050 | $1.15 | 4d | 1 | 0.79mi |
| 3118 Dignan St Jacksonville, FL | 4.0 | 2.0 | 1103 | $1,148 | $1.04 | 1d | 1 | 0.81mi |
| 1934 W 6th St Jacksonville, FL | 3.0 | 1.0 | 948 | $1,125 | $1.19 | 23d | 1 | 0.83mi |
| 346 Acosta St Jacksonville, FL | 4.0 | 3.5 | 1536 | $1,600 | $1.04 | 23d | 1 | 0.86mi |
| 1319 Woods St Jacksonville, FL | 3.0 | 2.0 | 1103 | $1,221 | $1.11 | 23d | 1 | 0.89mi |
| 1721 Campus St Jacksonville, FL | 3.0 | 2.0 | 909 | $1,400 | $1.54 | 23d | 1 | 0.89mi |
| 1866 W 6th St Jacksonville, FL | 3.0 | 1.0 | 1064 | $1,120 | $1.05 | 4d | 1 | 0.91mi |
| 1733 McMillan St Jacksonville, FL | 3.0 | 2.0 | 1211 | $1,265 | $1.04 | 4d | 1 | 0.95mi |
| 3318 Dignan St Jacksonville, FL | 3.0 | 2.0 | 960 | $1,200 | $1.25 | 23d | 1 | 0.99mi |
| 1781 W 3rd St Jacksonville, FL | 4.0 | 2.0 | 1632 | $650 | $0.40 | 23d | 1 | 1.00mi |
| 3352 Dillon St Jacksonville, FL | 3.0 | 2.0 | 1229 | $1,372 | $1.12 | 23d | 1 | 1.01mi |
| 3323 Nolan St Jacksonville, FL | 3.0 | 1.0 | 927 | $1,050 | $1.13 | 1d | 1 | 1.02mi |
| 1788 W 5th St Jacksonville, FL | 3.0 | 2.0 | 948 | $1,295 | $1.37 | 23d | 1 | 1.04mi |
| 3319 Hunt St Jacksonville, FL | 3.0 | 1.0 | 924 | $1,295 | $1.40 | 23d | 1 | 1.04mi |
| 1037 Detroit St Jacksonville, FL | 3.0 | 2.0 | 912 | $1,250 | $1.37 | 1d | 1 | 1.04mi |
| 3515 Dignan St Jacksonville, FL | 3.0 | 1.0 | 915 | $1,036 | $1.13 | 3d | 1 | 1.06mi |
| 3012 Imperial St Jacksonville, FL | 3.0 | 1.0 | 1089 | $1,395 | $1.28 | 23d | 1 | 1.06mi |
| 2902 W 5th St Jacksonville, FL | 3.0 | 2.0 | 1379 | $1,050 | $0.76 | 7d | 1 | 1.09mi |
| 1607 Logan St Jacksonville, FL | 4.0 | 2.0 | 1232 | $1,800 | $1.46 | 23d | 1 | 1.09mi |
| 1934 Ella St Jacksonville, FL | 3.0 | 1.0 | 1045 | $1,095 | $1.05 | 20d | 1 | 1.10mi |
| 1545 Union St W Jacksonville, FL | 3.0 | 2.0 | 1253 | $1,400 | $1.12 | 3d | 1 | 1.12mi |
| 1539 Union St W Jacksonville, FL | 3.0 | 1.5 | 1000 | $1,144 | $1.14 | 13d | 1 | 1.13mi |
| 2134 Danson St Jacksonville, FL | 3.0 | 1.5 | 1080 | $995 | $0.92 | 4d | 1 | 1.13mi |
| 2134 Danson St Jacksonville, FL | 3.0 | 1.5 | 1080 | $995 | $0.92 | 3d | 1 | 1.13mi |
| 3034 Detroit Cir E Jacksonville, FL | 3.0 | 2.0 | 1300 | $1,399 | $1.08 | 23d | 1 | 1.14mi |
| 3159 Phyllis St Jacksonville, FL | 3.0 | 2.0 | 1209 | $1,561 | $1.29 | 3d | 1 | 1.15mi |
| 3134 Phyllis St Jacksonville, FL | 4.0 | 2.0 | 1648 | $1,834 | $1.11 | 23d | 1 | 1.15mi |
| 2319 Almeda St Jacksonville, FL | 3.0 | 1.0 | 1200 | $1,078 | $0.90 | 1d | 1 | 1.16mi |
| 2965 Sunset St Jacksonville, FL | 3.0 | 2.0 | 1056 | $1,375 | $1.30 | 4d | 1 | 1.17mi |
Listing history 23 events
-
2026-06-18days on market $160,000 Active 160 DOM
-
2026-06-17days on market $160,000 Active 159 DOM
-
2026-06-16days on market $160,000 Active 158 DOM
-
2026-06-15days on market $160,000 Active 157 DOM
-
2026-06-10days on market $160,000 Active 151 DOM
-
2026-06-08days on market $160,000 Active 150 DOM
-
2026-06-08days on market $160,000 Active 149 DOM
-
2026-06-03days on market $160,000 Active 145 DOM
-
2026-06-02days on market $160,000 Active 144 DOM
-
2026-06-01days on market $160,000 Active 143 DOM
-
2026-05-31days on market $160,000 Active 142 DOM
-
2026-03-03price $160,000
-
2026-01-09$165,900 Active
-
2025-02-27historical $1,325
-
2025-02-25historical $1,325
-
2025-02-01$1,325
-
2025-01-31$1,325
-
2022-07-27soldstatus $108,500
-
2021-01-15soldstatus $138,000
-
2021-01-07soldstatus $138,000 Sold 165-char remark
Show marketing remark (165 chars)
This newly renovated home is move in ready! It has 3 bedrooms and 2 bathroom with 1,256 sq feet of living space and updates throughout. Call for your showing today!
-
2021-01-04$138,000 165-char remark
Show marketing remark (165 chars)
This newly renovated home is move in ready! It has 3 bedrooms and 2 bathroom with 1,256 sq feet of living space and updates throughout. Call for your showing today!
-
2021-01-04historical 165-char remark
Show marketing remark (165 chars)
This newly renovated home is move in ready! It has 3 bedrooms and 2 bathroom with 1,256 sq feet of living space and updates throughout. Call for your showing today!
-
1994-02-14soldstatus $14,100
ⓘ Source: listings_history table (triggers on properties + properties_extension) + one-shot
backfill from property_details.listing_events for pre-trigger history.
Tax reassessment forecast FL · Resets to sale price
- Current annual tax
- $2,690 · $224/mo
- Projected year-2 tax
- $2,690 · $224/mo
- Expected delta
- $0/yr ($0/mo · 0.0%)
ⓘ Screening estimate from a state-policy table — verify with the county assessor before closing.
Climate risk First Street
- Flood 1/10 Low FEMA zone X (unshaded) · 0% chance over 30 yrs
- Wildfire 1/10 Low
- Heat 9/10 Extreme 7 d/yr ≥107°F today · 19 d/yr by 30 yrs out
- Wind 9/10 Extreme 99% chance of damaging wind over 30 yrs
- Air quality 5/10 Major 7 unhealthy d/yr today · 7 by 30 yrs out
Nearby sold comps map
Loading sold comps map…
Walkable amenities ~0.75 mi
Loading nearby amenities…
Taxation est. · year 1
- Rental income
- $17,120
- − Mortgage interest
- −$8,962
- − Property taxes
- −$2,690
- − Insurance
- −$800
- − Repairs & maintenance
- −$1,370
- − Management
- −$1,370
- − Depreciation
- −$4,655
- Taxable loss
- −$2,727
- Est. tax savings @ 24.0%
- +$654
- After-tax cash flow
- $620/yr
For passive investors: Depreciation is non-cash, so a rental often shows a tax loss while cash-flowing — sheltering income. Rental losses are passive: they offset passive income freely, and up to $25,000/yr can offset ordinary (W-2) income if you actively participate and your MAGI is under $100k (phasing out to $0 by $150k); unused losses carry forward. On sale, claimed depreciation is recaptured at up to 25%, and gains may owe capital-gains tax (a 1031 exchange can defer both). Figures are a year-1 estimate at your 24.0% rate — not tax advice; consult a CPA.
Schools (NCES district)
- District
- Duval
- NCES district ID
- 1200480
- Math proficiency
- 46% ▼ -11.00%
- Reading proficiency
- 45% ▼ -4.00%
- Median HH income
- $48,987
- Composite
- 38.97/100
- National rank
- #4076
- State rank
- #48 of 73 in FL
Livability — Jacksonville
- Score
- 83/100
- State rank
- #50
- US rank
- #911
Category grades
Schools grade is shown separately in the Schools card above.
Census & demographics
- Census place
- Jacksonville, FL
- County
- Duval County · 1,015,274 people
- City population
- 979,034
- Metro
- Jacksonville, FL
- Population (ZIP)
- 34,657
- Household income
- $30,514
- Rent vs Own
- Severe rent burden
- 2921.0
Population outlook (Duval County) Hauer SSP2
- Today (2025)
- 1,013,010 people
- By 2030
- 1,059,228 · +4.6%
- By 2040
- 1,141,439 · +12.7%
- By 2050
- 1,205,258 · +19.0%
- By 2075
- 1,324,282 · +30.7%
- By 2100
- 1,319,620 · +30.3%
Race, ethnicity, and origin ACS 2023
- Neighborhood character
- Predominantly Black (88%)
- Race & ethnicity
- Black 88% White 5% Hispanic / Latino 5% Two or more races 2%
- Hispanic origin (detail)
- Puerto Rican 3%
- Common ancestry
- Hispanic 1% Romanian 1%
- Foreign-born
- 3% · Canada
- Languages at home
- 95% English-only · Spanish 4% French/Haitian/Cajun 1%
Political lean MEDSL · Duval
- 2024 margin
- Toss-up / Even · D 48.7% · R 50.1% · Other 1.2%
- 2008→2024 swing
- +0.4pp no change · 2008: -1.9pp · 2024: -1.5pp
- All cycles
- 2024: R+1.5 2020: D+3.8 2016: R+1.5 2012: R+3.6 2008: R+1.9
Not yet ingested
- Civics
- —
Market trends
- HPI YoY
- ▼ -53.92%
- Current HPI
- 189.5977
- Rent YoY
- ▲ 1.81%
- Metro
- Jacksonville, FL
- State GDP YoY
- ▲ 3.28%
- F500 in state
- 36
Industry mix (Fortune 500 HQ in FL)
| Industry | F500 HQs | Revenue |
|---|---|---|
| Industrial Technology | 2 | $29B |
|
||
| Insurance | 2 | $17B |
|
||
| Retail | 1 | $60B |
|
||
| Technology Distribution | 1 | $58B |
|
||
| Homebuilding | 1 | $35B |
|
||
| Technology Manufacturing | 1 | $35B |
|
||
Price history
+1034.8% since first listed12 events — show timeline
- 2026-03-03 Price Changed $160,000 realMLS
- 2026-01-09 Listed $165,900 realMLS
- 2025-02-27 Rental Removed $1,325 SHOWMOJO
- 2025-02-25 Rental Removed $1,325 RENT.
- 2025-02-01 Listed for Rent $1,325 RENT.
- 2025-01-31 Listed for Rent $1,325 SHOWMOJO
- 2022-07-27 Sold (Public Records) $108,500 Public Records
- 2021-01-15 Sold (Public Records) $138,000 Public Records
- 2021-01-07 Sold (MLS) $138,000 realMLS
- 2021-01-04 Listing Removed — realMLS
- 2021-01-04 Listed $138,000 realMLS
- 1994-02-14 Sold (Public Records) $14,100 Public Records
Property tax history
+12.0%/yrLatest (2025): $2,690 · +12.8% YoY. Source: county tax records.
Cash-flow waterfall
monthlySold comps — $/sqft
last 12 mo · ≤1 miLoading sold comps…