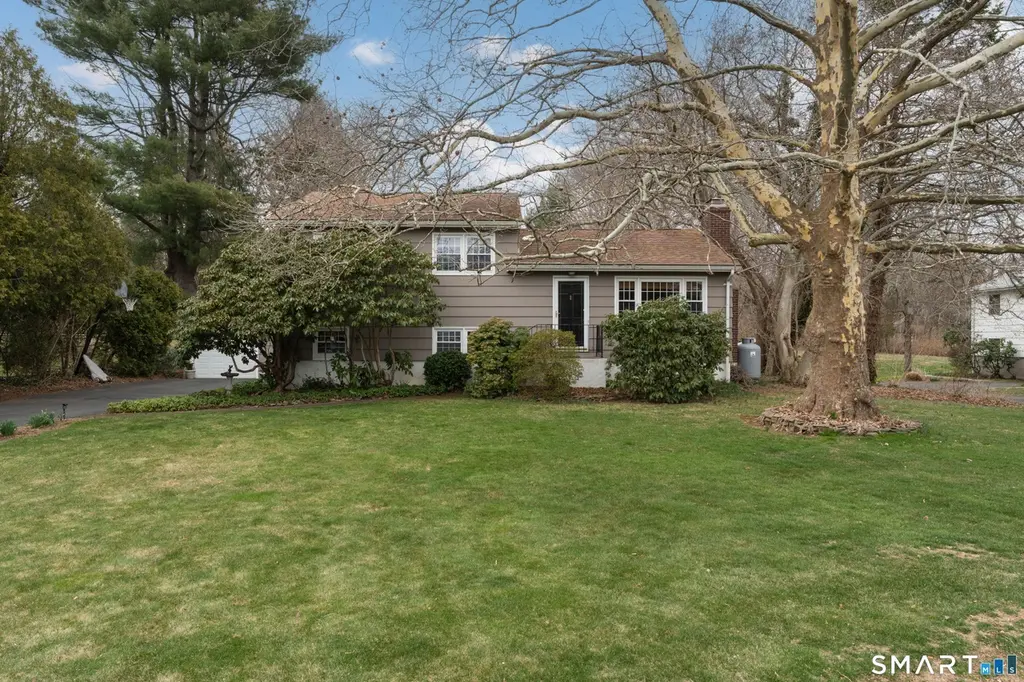
82 Raymond Rd · Guilford Center, CT
Flood risk 1/10 · Minimal
- FEMA flood zone
- X (unshaded)
- Chance of flooding over 30 yrs
- 0.0%
- Est. flood insurance / yr
- $473 – $860
Fire risk 1/10 · Minimal
- Est. fire insurance / yr
- $829 – $1,539
Heat risk 6/10 · Moderate
- Hot days now (above 94°F)
- 7 days/yr
- Hot days in 30 yrs
- 17 days/yr
Wind risk 6/10 · Moderate
- Chance of severe wind over 30 yrs
- 77.0%
Air-quality risk 4/10 · Minor
- Unhealthy air days now
- 5 days/yr
- Unhealthy air days in 30 yrs
- 7 days/yr
Risk factors via First Street. Map © Google.
Why this score? — see what drove the F grade
The composite is a weighted blend of 9 inputs, each scored 0–100. Each bar is that input's sub-score; the figure is the points it added to the 100-point composite (weight × sub-score).
- Schools +6.3/10.0
- Livability +4.1/5.0
- Cash flow +3.5/30.0
- Rent growth +2.5/5.0
- Condition / age +2.5/5.0
- ARV discount +0.8/15.0
- 1% rule +0.0/10.0
- DSCR +0.0/10.0
- Appreciation +0.0/10.0
$550,000
🖨 Deal sheet 📄 Offer letter ✓ Due diligence
Listing remarks
HIGHEST AND BEST OFFERS MUST BE SUBMITTED BY 4/11/2026 6:00pm. This well cared for home sits on an attractive lot, offering both charm and exceptional upkeep. The main living level features a living room with a fireplace and a dining room that opens to both the kitchen and living room. The kitchen is updated with granite counters, modern appliances, and a laminate plank floor. The unheated sunroom off the dining room is an especially appealing feature. A half-flight down is the family room, which includes a wood stove and convenient access to both the driveway and the patio. The level also includes a half bathroom, laundry area with washer and dryer, dedicated office and extra storage benea
Key facts
- 0.46 acre lot
- Garage
- Built 1960
Property features AI
Finance
- Other: Possible in-law apartment with lower level access
Exterior
- Parking: Detached garage; Driveway (asphalt); 3 total parking spaces; 1 garage bay
- Security: Storm doors
- Utilities: Public water connected; Septic system; Oil fuel tank located in basement; Thermopane windows; Ridge vents
- Home design: Single-family home; Beige exterior
- Construction: Frame construction; Shingle and wood siding; Asphalt shingle roof; Concrete foundation; Crawl space basement (unfinished, storage)
- Exterior features: Shed; Gutters; Exterior lighting; Patio; Fully fenced, open lot
Interior
- Kitchen: Oven/Range; Refrigerator; Dishwasher
- Bedrooms: 3 bedrooms
- Flooring: Concrete floor in basement
- Bathrooms: 1 full bath; 1 half bath
- Heating & cooling: Hot air heating (oil-fired); Central air; 40-gallon electric hot water tank
- Interior features: Auto garage door opener; Cable pre-wired; Open floor plan; Foyer; Has attic with storage space and hatch access; Fireplace insert
- Laundry & utility: Washer and dryer included; Laundry located in half bath on family room floor (lower level)
Neighborhood map
What this means for you Summary
Snapshot
- This is a 3-bed/1.5-bath single-family listed at $550k.
Deal economics
- At list price, monthly cash flow is $-2k ($-20k/yr) — negative.
- To cash-flow at today's rent, offer at most $257k (53.2% below list).
- To meet the 1% rule (rent ≥ 1% of price), the offer needs to be $258k (53.0% below list).
- Recommended offer: $257k (53.2% below list) — sets the bar for cash-flow.
Location & tenants
- Location reads 82/100 on livability (#10 in CT, #1,186 nationally) — a professional / high-income tenant draw. Strengths: crime A+, employment A+, health & safety A+; Watch: cost of living F.
- Guilford School District (suburban): math 64% / reading 75% proficiency, ranked #19 of 153 in CT (top 12%) — acceptable for families but not a draw, mixed tenant base, ~2y average lease; only 6% free/reduced lunch — higher-income household profile.
- Zoned schools: Calvin Leete School (math 72% / reading 67%, grade A-, #78 of 553 statewide, top 17%, 225 students, 10% FRL); Guilford High School (math 60% / reading 84%, grade B+, #14 of 194 statewide, top 8%, 1,048 students, 11% FRL) — zoned schools at 10% FRL track the district average.
- Market conditions: 108 active listings in the ZIP; 1,059 units permitted in South Central Connecticut Planning Region in 2024 (779 in 5+ unit buildings).
Forward outlook
- Local home prices are declining (-3.0%/yr); year-one equity from $4k of loan paydown is wiped out by about $16k of value loss. Plan a longer hold.
Negotiation context
- Only 4 days on market — expect competitive offers; lowballing is unlikely to land.
Risks & watch-outs
- Climate carrying-cost: major wind risk, 77% chance of damaging wind over 30y; extreme-heat days projected 7→17/yr by 2055 (HVAC capex compounding) — expect insurance premiums to compound above CPI over the hold.
Questions for the listing agent
- What do current leases actually rent for vs. the listed asking? Can we see a recent rent roll and the last 12 months of T-12 income?
- Built in 1960 — when were the roof, HVAC, electrical panel, plumbing, and water heater last replaced?
- Is there a deadline driving the sale (1031 exchange, divorce, estate, relocation)? That informs how much negotiation room exists.
- Schools are A-rated — typically a magnet for longer-tenancy family renters. What's the average tenant stay here, and is there a school-zone premium baked into asking?
- The area grade is low — what's the realistic commute time and amenity access for the typical tenant pool here? Any planned neighborhood developments (good or bad) we should know about?
- What's the average days-on-market for RENTAL listings here right now (not sales)? A rising rental-DOM trend means longer vacancies and softer asking-rent achievability than the comps imply.
- What's the recent tenant-quality profile in this submarket — average credit score on applications, eviction rate, late-payment / NSF rate, and stable-employment percentage? A property-management company in the area should have these aggregated.
- How much new for-sale + rental construction is in the pipeline within 1–3 miles? Heavy new supply typically softens prices + rents 12–24 months out; constrained supply supports both.
Investment metrics
- 1% rule
- 0.47% ✗
- Cap rate
- 2.68%
- Cash-on-cash
- -12.91%
- DSCR
- 0.43
- GRM
- 17.7
CMA / ARV
- ARV (on-the-fly)
- $478,296
- Comps found
- 4
Show comp detail 4 sales within ~0.75 mi
| Address | Dist | Beds/Ba | Sqft | Sold | Price | $/sf | Match |
|---|---|---|---|---|---|---|---|
| 42 Horseshoe Rd | 0.41mi | 3/1.5 | 1,200 (+10%) | 6mo | $525,500 | $438 | 59 |
| 46 Sperry Dr | 0.20mi | 2/1.0 (-1) | 960 (-12%) | 9mo | $403,000 | $420 | 57 |
| 17 Horseshoe Rd | 0.36mi | 3/2.0 | 1,214 (+11%) | 14mo | $587,000 | $484 | 52 |
| 30 Preble Dr | 0.63mi | 3/1.5 | 1,148 (+5%) | 14mo | $479,000 | $417 | 50 |
Match score weights: distance 35% · size 25% · config 20% · recency 20%. Top-matched comps best support the ARV.
Projected returns pro-forma
-3.0% appreciation · 3.0% rent growth · sell at horizon
- IRR
- -40.4%
- Equity multiple
- -0.26×
- Total profit
- $-194,636
- Equity at exit
- $82,007
- IRR
- -65.3%
- Equity multiple
- -0.98×
- Total profit
- $-305,417
- Equity at exit
- $47,554
Cash invested: $154,000 (down + closing). Projections, not guarantees.
Landlord ↔ Tenant lean methodology
- Overall (STATE)
- 27 Tenant-Leaning
- State Connecticut
- 27 Tenant-Leaning · D+7
- County
- — inherits STATE
- City
- — inherits STATE
ZIP-level market 06437
- Active inventory
- 108
- Price-to-rent
- 17.7×
Monthly cashflow live
- Estimated rent
- $2,585 medium interval (Pro) →
- Mortgage (P&I)
- −$2,884
- Tax from tax record
- −$585 /mo · $7,016/yr
- Insurance
- −$229
- HOA
- −$0
- Vacancy / Maint / Mgmt
- −$543
- Net cashflow
- $-1,656
Break-even live
UW: 25.0% down · 7.5% · 30yr · 1.5% tax · 5.0% vac · 8.0% maint · 8.0% mgmt
Financing live
Cash to close
- Down payment
- $137,500
- Closing costs
- $16,500
- Reserves months
- —
- Total cash needed
- —
Loan-product check · same deal, 3 products live
Conventional
25% down · 7.5% · 30yr
- Down + closing
- —
- Monthly P&I
- —
- Monthly cashflow
- —
- DSCR
- —
- Eligible?
- —
Personal DTI + credit; lowest rate.
DSCR
20% down · 8.5% · 30yr
- Down + closing
- —
- Monthly P&I
- —
- Monthly cashflow
- —
- DSCR
- —
- Eligible?
- —
No personal income docs; deal must DSCR.
Hard money
10% down · 12.0% · 12mo
- Down + closing
- —
- Monthly P&I
- —
- Monthly cashflow
- —
- DSCR
- —
- Eligible?
- —
Short-term bridge; refi at stabilization.
Listing history 3 events
-
2026-04-13status Under Contract
-
2026-04-09$550,000 Active
-
2026-04-04historical $550,000
ⓘ Source: listings_history table (triggers on properties + properties_extension) + one-shot
backfill from property_details.listing_events for pre-trigger history.
Tax reassessment forecast CT · Partial reset (capped growth)
- Current annual tax
- $7,016 · $585/mo
- Projected year-2 tax
- $9,393 · $783/mo
- Expected delta
- +$2,377/yr (+$198/mo · 33.9%)
ⓘ Screening estimate from a state-policy table — verify with the county assessor before closing.
Climate risk First Street
- Flood 1/10 Low FEMA zone X (unshaded) · 0% chance over 30 yrs
- Wildfire 1/10 Low
- Heat 6/10 Major 7 d/yr ≥94°F today · 17 d/yr by 30 yrs out
- Wind 6/10 Major 77% chance of damaging wind over 30 yrs
- Air quality 4/10 Moderate 5 unhealthy d/yr today · 7 by 30 yrs out
Nearby sold comps map
Loading sold comps map…
Walkable amenities ~0.75 mi
Loading nearby amenities…
Taxation est. · year 1
- Rental income
- $31,015
- − Mortgage interest
- −$30,809
- − Property taxes
- −$7,016
- − Insurance
- −$2,750
- − Repairs & maintenance
- −$2,481
- − Management
- −$2,481
- − Depreciation
- −$16,000
- Taxable loss
- −$30,522
- Est. tax savings @ 24.0%
- +$7,325
- After-tax cash flow
- $-12,550/yr
For passive investors: Depreciation is non-cash, so a rental often shows a tax loss while cash-flowing — sheltering income. Rental losses are passive: they offset passive income freely, and up to $25,000/yr can offset ordinary (W-2) income if you actively participate and your MAGI is under $100k (phasing out to $0 by $150k); unused losses carry forward. On sale, claimed depreciation is recaptured at up to 25%, and gains may owe capital-gains tax (a 1031 exchange can defer both). Figures are a year-1 estimate at your 24.0% rate — not tax advice; consult a CPA.
Schools (NCES district)
- District
- Guilford School District
- NCES district ID
- 0901800
- Math proficiency
- 64% ▼ -12.00%
- Reading proficiency
- 75% ▼ -7.00%
- Median HH income
- $97,539
- Composite
- 63.46/100
- National rank
- #614
- State rank
- #19 of 153 in CT
Livability — Guilford Center
- Score
- 82/100
- State rank
- #10
- US rank
- #1186
Category grades
Schools grade is shown separately in the Schools card above.
Census & demographics
- Population (ZIP)
- 22,037
Population outlook (South Central Connecticut County) Hauer SSP2
- By 2040
- 608,362
Race, ethnicity, and origin ACS 2023
- Neighborhood character
- Predominantly White (87%)
- Race & ethnicity
- White 87% Two or more races 6% Hispanic / Latino 4% Asian 3% Black 2%
- Common ancestry
- Romanian 7% Lithuanian 3% Slovak 2%
- Foreign-born
- 8% · Canada, China
- Languages at home
- 90% English-only · Spanish 3% Other Indo-European 2% German/W. Germanic 1%
Political lean MEDSL · South Central Connecticut
- 2024 margin
- Strong D (+20.1) · D 59.0% · R 38.9% · Other 2.1%
- All cycles
- 2024: D+20.1
Not yet ingested
- Civics
- —
Market trends
- HPI YoY
- ▼ -267.02%
- Current HPI
- 179.6376
- Rent YoY
- —
- Metro
- —
- State GDP YoY
- ▲ 1.06%
- F500 in state
- 38
Industry mix (Fortune 500 HQ in CT)
| Industry | F500 HQs | Revenue |
|---|---|---|
| Industrial Machinery | 4 | $38B |
|
||
| Insurance | 3 | $71B |
|
||
| Financial Services | 2 | $25B |
|
||
| Transportation / Logistics | 2 | $18B |
|
||
| Healthcare | 1 | $247B |
|
||
| Telecommunications | 1 | $55B |
|
||
Price history
+0.0% since first listed3 events — show timeline
- 2026-04-13 Pending — Smart MLS
- 2026-04-09 Listed $550,000 Smart MLS
- 2026-04-04 Coming Soon $550,000 Smart MLS
Property tax history
+1.5%/yrLatest (2023): $7,016 · +17.9% YoY. Source: county tax records.
Cash-flow waterfall
monthlySold comps — $/sqft
last 12 mo · ≤1 miLoading sold comps…