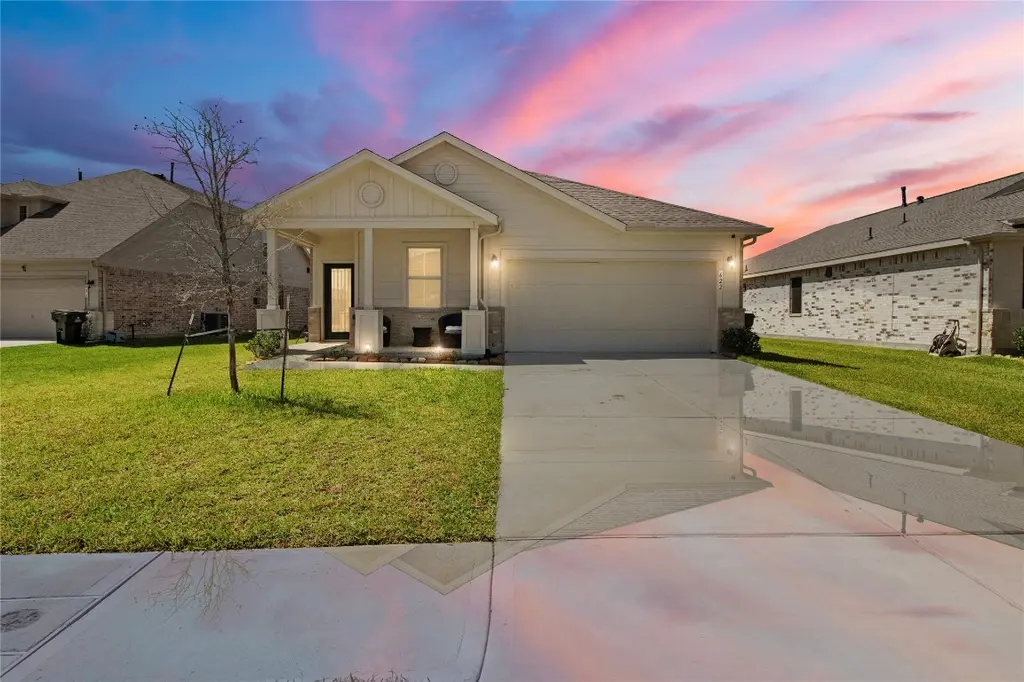
622 Little Cypress Ln · Cove, TX
Flood risk No data
- FEMA flood zone
- —
- Chance of flooding over 30 yrs
- —
- Est. flood insurance / yr
- —
Fire risk No data
- Est. fire insurance / yr
- —
Heat risk No data
- Hot days now (above threshold)
- —
- Hot days in 30 yrs
- —
Wind risk No data
- Chance of severe wind over 30 yrs
- —
Air-quality risk No data
- Unhealthy air days now
- —
- Unhealthy air days in 30 yrs
- —
Risk factors via First Street. Map © Google.
Why this score? — see what drove the D- grade
The composite is a weighted blend of 9 inputs, each scored 0–100. Each bar is that input's sub-score; the figure is the points it added to the 100-point composite (weight × sub-score).
- Cash flow +10.9/30.0
- Schools +6.2/10.0
- ARV discount +5.2/15.0
- Condition / age +4.0/5.0
- Rent growth +3.4/5.0
- 1% rule +3.2/10.0
- DSCR +3.2/10.0
- Livability +3.2/5.0
- Appreciation +0.0/10.0
$324,500
🖨 Deal sheet 📄 Offer letter ✓ Due diligence
Listing remarks
Tucked away on a quiet cul-de-sac in highly sought-after Barbers Hill ISD, this beautiful 4-bedroom, 2-bath home offers the perfect blend of comfort, space, and everyday living. From the moment you step inside, you’re welcomed by soaring ceilings and an open layout that feels both warm and inviting, perfect for gathering with family or hosting friends. The kitchen is the heart of the home, featuring 42” cabinetry and plenty of space to cook, connect, and create memories. Thoughtful upgrades like modern fixtures, a full water filtration system, and a 72” ceiling fan in the living area add both style and comfort. Pre-wired for a security system, this home is designed with co
Key facts
- Quiet cul-de-sac
- 42 cabinetry
- Barbers hill isd
Tags
Property features AI
Finance
- HOA & community: Community playground; Trails
Exterior
- Parking: Attached 2-car garage
- Security: Prewired for security
- Utilities: Public water
- Home design: Residential property; One-story entry (single level); Built in 2022
- Construction: Composition roof; Slab foundation; Built by K Hovnanian
- Exterior features: Fully fenced yard; Storm/security shutters; Located on a cul-de-sac
Interior
- Kitchen: Gas oven; Gas range; Granite counters; Breakfast bar; Pantry
- Bedrooms: Primary bedroom on the first floor (15 x 14); Bedroom on the first floor (12 x 9); Bedroom on the first floor (11 x 10); Bedroom on the first floor (10 x 9)
- Flooring: Plank flooring; Vinyl flooring
- Bathrooms: 2 full bathrooms
- Heating & cooling: Central heating (gas); Central electric air conditioning
- Interior features: Breakfast bar; Granite counters; High ceilings; Kitchen and family room combo; Pantry; Soaking tub; Separate shower; Tub/shower; Ceiling fans; Water softener (owned)
- Laundry & utility: Electric dryer hookup
Neighborhood map
What this means for you Summary
Snapshot
- This is a 4-bed/2.0-bath single-family listed at $324k. Condition is rated good.
Deal economics
- At list price, monthly cash flow is $-143 ($-2k/yr) — negative.
- To cash-flow at today's rent, offer at most $299k (7.8% below list).
- To meet the 1% rule (rent ≥ 1% of price), the offer needs to be $265k (18.3% below list).
- Recommended offer: $265k (18.3% below list) — sets the bar for 1% rule.
Location & tenants
- Location reads 64/100 on livability (#766 in TX) — a middle-class / working-renter tenant base. Strengths: employment A+, housing A+, crime A; Watch: amenities F, commute F, health & safety F.
- Barbers Hill ISD (rural): math 72% / reading 65% proficiency, ranked #12 of 826 in TX (top 2%) — acceptable for families but not a draw, mixed tenant base, ~2y average lease.
- Zoned schools: Barbers Hill El South (math 68% / reading 62%, grade B+, #246 of 4,322 statewide, top 6%, 883 students, 37% FRL); Barbers Hill Middle South (math 77% / reading 63%, grade A, #58 of 1,662 statewide, top 4%, 636 students, 0% FRL); Barbers Hill H S (math 70% / reading 74%, grade B+, #95 of 1,632 statewide, top 7%, 1,972 students, 0% FRL) — zoned schools average 12% FRL vs 28% district-wide (16 pts lower); this property's tenant base skews higher-income than the district average.
- Market conditions: Rents rising (+3.4%/yr); 776 active listings in the ZIP; 7 comparable units currently listed for rent nearby; rentals at typical pace (median 24d on market — plan ~3-4 weeks tenant-placement turnaround); high-income renter base; 629 units permitted in Chambers County in 2024 (0 in 5+ unit buildings).
Forward outlook
- Local home prices are declining (-3.0%/yr); year-one equity from $2k of loan paydown is wiped out by about $10k of value loss. Plan a longer hold.
- Chambers County population projected at +46% by 2050 — long-run rental-demand tailwind backs the buy-and-hold thesis.
Negotiation context
- Only 10 days on market — expect competitive offers; lowballing is unlikely to land.
- 5 sale attempts with the ask held roughly flat each time — persistent listings suggest the price (not the market) is what's stuck; bring a comps-based counter.
Questions for the listing agent
- What do current leases actually rent for vs. the listed asking? Can we see a recent rent roll and the last 12 months of T-12 income?
- Is there a deadline driving the sale (1031 exchange, divorce, estate, relocation)? That informs how much negotiation room exists.
- Schools are D-rated, which usually means shorter tenancies and higher turnover. Who's the typical renter profile here, and what's been the actual vacancy rate?
- The area grade is low — what's the realistic commute time and amenity access for the typical tenant pool here? Any planned neighborhood developments (good or bad) we should know about?
- What's the average days-on-market for RENTAL listings here right now (not sales)? A rising rental-DOM trend means longer vacancies and softer asking-rent achievability than the comps imply.
- What's the recent tenant-quality profile in this submarket — average credit score on applications, eviction rate, late-payment / NSF rate, and stable-employment percentage? A property-management company in the area should have these aggregated.
- How much new for-sale + rental construction is in the pipeline within 1–3 miles? Heavy new supply typically softens prices + rents 12–24 months out; constrained supply supports both.
Investment metrics
- 1% rule
- 0.82% ✗
- Cap rate
- 5.76%
- Cash-on-cash
- -1.89%
- DSCR
- 0.92
- GRM
- 10.2
CMA / ARV
- ARV (median comp)
- $308,423
- List price
- $324,500
- Delta
- 5.34%
- Verdict
- FAIR
- Comps
- 20 within 1.0 mi
Show comp detail 12 sales within ~0.75 mi
| Address | Dist | Beds/Ba | Sqft | Sold | Price | $/sf | Match |
|---|---|---|---|---|---|---|---|
| 14603 Rain Tree Dr | 0.08mi | 3/2.0 (-1) | 1,821 (-0%) | 2mo | $308,000 | $169 | 89 |
| 14923 Spring Forest Ln | 0.38mi | 4/2.0 | 1,829 (0%) | 2mo | $299,000 | $163 | 80 |
| 6714 Augusta Greens Dr | 0.38mi | 3/2.0 (-1) | 1,790 (-2%) | 2mo | $324,990 | $182 | 72 |
| 7106 Thomas James Ct | 0.52mi | 4/2.0 | 1,777 (-3%) | 1mo | $297,690 | $168 | 70 |
| 218 San Marcos Dr | 0.33mi | 3/2.0 (-1) | 1,728 (-6%) | 1mo | $290,000 | $168 | 70 |
| 510 Louis Ln | 0.51mi | 4/2.0 | 1,937 (+6%) | 2mo | $303,440 | $157 | 65 |
| 6818 Bens Lndg | 0.41mi | 4/2.5 | 1,642 (-10%) | 1mo | $269,800 | $164 | 61 |
| 6743 Camila St | 0.53mi | 4/2.0 | 1,682 (-8%) | 2mo | $284,000 | $169 | 60 |
| 6922 Bens Lndg | 0.49mi | 4/2.5 | 1,642 (-10%) | 1mo | $269,180 | $164 | 58 |
| 6707 Alejandro Pl | 0.39mi | 3/2.0 (-1) | 1,592 (-13%) | 1mo | $299,100 | $188 | 55 |
| 6830 Bens Lndg | 0.43mi | 3/2.0 (-1) | 1,580 (-14%) | 1mo | $274,870 | $174 | 51 |
| 155 Horn Ct | 0.56mi | 4/2.5 | 2,052 (+12%) | 2mo | $255,000 | $124 | 50 |
Match score weights: distance 35% · size 25% · config 20% · recency 20%. Top-matched comps best support the ARV.
Projected returns pro-forma
-3.0% appreciation · 3.42% rent growth · sell at horizon
- IRR
- -18.9%
- Equity multiple
- 0.33×
- Total profit
- $-60,551
- Equity at exit
- $48,384
- IRR
- -10.6%
- Equity multiple
- 0.34×
- Total profit
- $-59,674
- Equity at exit
- $28,057
Cash invested: $90,860 (down + closing). Projections, not guarantees.
Landlord ↔ Tenant lean methodology
- Overall (STATE)
- 87 Strongly Landlord-Friendly
- State Texas
- 87 Strongly Landlord-Friendly · R+5
- County
- — inherits STATE
- City
- — inherits STATE
ZIP-level market 77523
- Home prices YoY
- -31.5%
- Rents YoY
- 3.4%
- Active inventory
- 776
- Price-to-rent
- 10.2×
Monthly cashflow live
- Estimated rent
- $2,653 high interval (Pro) →
- Mortgage (P&I)
- −$1,702
- Tax from tax record
- −$402 /mo · $4,824/yr
- Insurance
- −$135
- HOA
- −$0
- Vacancy / Maint / Mgmt
- −$557
- Net cashflow
- $-143
Break-even live
UW: 25.0% down · 7.5% · 30yr · 1.5% tax · 5.0% vac · 8.0% maint · 8.0% mgmt
Financing live
Cash to close
- Down payment
- $81,125
- Closing costs
- $9,735
- Reserves months
- —
- Total cash needed
- —
Loan-product check · same deal, 3 products live
Conventional
25% down · 7.5% · 30yr
- Down + closing
- —
- Monthly P&I
- —
- Monthly cashflow
- —
- DSCR
- —
- Eligible?
- —
Personal DTI + credit; lowest rate.
DSCR
20% down · 8.5% · 30yr
- Down + closing
- —
- Monthly P&I
- —
- Monthly cashflow
- —
- DSCR
- —
- Eligible?
- —
No personal income docs; deal must DSCR.
Hard money
10% down · 12.0% · 12mo
- Down + closing
- —
- Monthly P&I
- —
- Monthly cashflow
- —
- DSCR
- —
- Eligible?
- —
Short-term bridge; refi at stabilization.
Rent comps 7 comps
| Address | Beds | Baths | Sqft | Rent | $/sqft | DOM | Units | Dist |
|---|---|---|---|---|---|---|---|---|
| 14739 Sweet Water Dr Baytown, TX | 4.0 | 2.0 | 1821 | $2,395 | $1.32 | 1d | 1 | 0.24mi |
| 14930 Spring Forest Ln Baytown, TX | 4.0 | 2.0 | 1829 | $2,750 | $1.50 | 43d | 1 | 0.41mi |
| 5815 Littoral Rd Baytown, TX | 3.0 | 2.0 | 1305 | $1,845 | $1.41 | 19d | 1 | 0.70mi |
| 8411 Hannah Rd Baytown, TX | 4.0 | 2.5 | 2329 | $2,195 | $0.94 | 24d | 1 | 0.87mi |
| 8414 Liberty Sky Rd Baytown, TX | 3.0 | 2.5 | 2046 | $2,095 | $1.02 | 24d | 1 | 0.89mi |
| 5006 Creekside Ave Baytown, TX | 3.0 | 2.0 | 1553 | $2,081 | $1.34 | 24d | 1 | 1.27mi |
| 4814 Emerald Bay Cir Baytown, TX | 4.0 | 2.0 | 1666 | $2,191 | $1.32 | 22d | 1 | 1.44mi |
Listing history 20 events
-
2026-06-18days on market $324,500 Active 10 DOM
-
2026-06-17days on market $324,500 Active 9 DOM
-
2026-06-16days on market $324,500 Active 8 DOM
-
2026-06-15days on market $324,500 Active 7 DOM
-
2026-06-13days on market $324,500 Active 5 DOM
-
2026-06-08pricedays on market $324,500 Active 1 DOM
-
2026-06-07days on market $324,900 Active 38 DOM
-
2026-06-04days on market $324,900 Active 35 DOM
-
2026-06-03days on market $324,900 Active 34 DOM
-
2026-06-02days on market $324,900 Active 33 DOM
-
2026-06-01days on market $324,900 Active 32 DOM
-
2026-05-31days on market $324,900 Active 31 DOM
-
2026-05-08$2,450
-
2026-04-30$324,900 Active 864-char remark
-
2026-04-30historical
-
2026-04-28price $328,900
-
2026-04-25price $329,000
-
2026-04-17$329,900 Active
-
2026-04-17historical
-
2026-04-10$329,900 Active
ⓘ Source: listings_history table (triggers on properties + properties_extension) + one-shot
backfill from property_details.listing_events for pre-trigger history.
Tax reassessment forecast TX · Resets to sale price
- Current annual tax
- $4,824 · $402/mo
- Projected year-2 tax
- $5,938 · $495/mo
- Expected delta
- +$1,114/yr (+$93/mo · 23.1%)
ⓘ Screening estimate from a state-policy table — verify with the county assessor before closing.
Nearby sold comps map
Loading sold comps map…
Walkable amenities ~0.75 mi
Loading nearby amenities…
Taxation est. · year 1
- Rental income
- $31,831
- − Mortgage interest
- −$18,177
- − Property taxes
- −$4,824
- − Insurance
- −$1,622
- − Repairs & maintenance
- −$2,546
- − Management
- −$2,546
- − Depreciation
- −$9,440
- Taxable loss
- −$7,325
- Est. tax savings @ 24.0%
- +$1,758
- After-tax cash flow
- $38/yr
For passive investors: Depreciation is non-cash, so a rental often shows a tax loss while cash-flowing — sheltering income. Rental losses are passive: they offset passive income freely, and up to $25,000/yr can offset ordinary (W-2) income if you actively participate and your MAGI is under $100k (phasing out to $0 by $150k); unused losses carry forward. On sale, claimed depreciation is recaptured at up to 25%, and gains may owe capital-gains tax (a 1031 exchange can defer both). Figures are a year-1 estimate at your 24.0% rate — not tax advice; consult a CPA.
Condition & rehab AI · 12 photos
This well-maintained, move-in-ready home in a sought-after neighborhood offers a good balance of comfort and style.
Value-add opportunities
- Both Painting exterior — Enhances curb appeal and value
- Both Landscaping improvements — Enhances curb appeal and value
- Resale Replace ceiling fan — Modernizes the living area and adds style
Renovation cost estimate screening
Value-add ROI direction
- Both Painting exterior — Enhances curb appeal and value ↑
- Both Landscaping improvements — Enhances curb appeal and value ↑
- Resale Replace ceiling fan — Modernizes the living area and adds style ↑
ⓘ Cost ranges are severity-bucket heuristics (US national rule-of-thumb). Get contractor quotes + a written scope before underwriting a rehab budget.
Schools (NCES district)
- District
- Barbers Hill ISD
- NCES district ID
- 4809450
- Math proficiency
- 72% ▼ -5.00%
- Reading proficiency
- 65% ▼ -1.00%
- Median HH income
- $87,257
- Composite
- 61.73/100
- National rank
- #737
- State rank
- #12 of 826 in TX
Livability — Cove
- Score
- 64/100
- State rank
- #766
- US rank
- #13996
Category grades
Schools grade is shown separately in the Schools card above.
Census & demographics
- County
- Chambers County · 30,186 people
- Metro
- Houston-The Woodlands-Sugar Land, TX
- Population (ZIP)
- 30,186
- Household income
- $124,188
- Rent vs Own
- Severe rent burden
- 549.0
Population outlook (Chambers County) Hauer SSP2
- Today (2025)
- 46,946 people
- By 2030
- 51,094 · +8.8%
- By 2040
- 59,578 · +26.9%
- By 2050
- 68,318 · +45.5%
- By 2075
- 90,485 · +92.7%
- By 2100
- 104,885 · +123.4%
Race, ethnicity, and origin ACS 2023
- Neighborhood character
- Majority White (62%)
- Race & ethnicity
- White 62% Hispanic / Latino 25% Two or more races 11% Black 8% Asian 2%
- Hispanic origin (detail)
- Mexican 22%
- Common ancestry
- Lithuanian 1% Slovak 1% Serbian 1%
- Foreign-born
- 9% · Canada
- Languages at home
- 82% English-only · Spanish 17%
Political lean MEDSL · Chambers
- 2024 margin
- Solid R (+65.6) · D 16.8% · R 82.4%
- 2008→2024 swing
- -14.4pp toward R · 2008: -51.2pp · 2024: -65.6pp
- All cycles
- 2024: R+65.6 2020: R+61.7 2016: R+62.1 2012: R+61.1 2008: R+51.2
Not yet ingested
- Civics
- —
Market trends
- HPI YoY
- ▼ -102.33%
- Current HPI
- 222.6999
- Rent YoY
- ▲ 3.42%
- Metro
- Houston-The Woodlands-Sugar Land, TX
- State GDP YoY
- ▲ 3.95%
- F500 in state
- 110
Industry mix (Fortune 500 HQ in TX)
| Industry | F500 HQs | Revenue |
|---|---|---|
| Energy | 16 | $1,198B |
|
||
| Technology | 5 | $198B |
|
||
| Engineering / Construction | 4 | $72B |
|
||
| Energy Services | 3 | $60B |
|
||
| Utilities | 3 | $41B |
|
||
| Healthcare | 2 | $330B |
|
||
Price history
-1.6% since first listed10 events — show timeline
- 2026-06-08 Listing Removed — HARMLS
- 2026-06-08 Listed $324,500 HARMLS
- 2026-05-08 Listed for Rent $2,450 HARMLS
- 2026-04-30 Listing Removed — HARMLS
- 2026-04-30 Listed $324,900 HARMLS
- 2026-04-28 Price Changed $328,900 HARMLS
- 2026-04-25 Price Changed $329,000 HARMLS
- 2026-04-17 Listing Removed — HARMLS
- 2026-04-17 Listed $329,900 HARMLS
- 2026-04-10 Listed $329,900 HARMLS
Property tax history
+68.9%/yrLatest (2025): $4,824 · +1.0% YoY. Source: county tax records.
Cash-flow waterfall
monthlySold comps — $/sqft
last 12 mo · ≤1 miLoading sold comps…