9525 Manning Ave · Kansas City, MO
Flood risk 1/10 · Minimal
- FEMA flood zone
- X (unshaded)
- Chance of flooding over 30 yrs
- 0.0%
- Est. flood insurance / yr
- $473 – $860
Fire risk 3/10 · Minor
- Est. fire insurance / yr
- $1,054 – $1,958
Heat risk 4/10 · Minor
- Hot days now (above 106°F)
- 7 days/yr
- Hot days in 30 yrs
- 17 days/yr
Wind risk 2/10 · Minimal
- Chance of severe wind over 30 yrs
- —
Air-quality risk 3/10 · Minor
- Unhealthy air days now
- 3 days/yr
- Unhealthy air days in 30 yrs
- 5 days/yr
Risk factors via First Street. Map © Google.
Why this score? — see what drove the D grade
The composite is a weighted blend of 9 inputs, each scored 0–100. Each bar is that input's sub-score; the figure is the points it added to the 100-point composite (weight × sub-score).
- Cash flow +17.2/30.0
- DSCR +5.4/10.0
- Appreciation +5.0/10.0
- 1% rule +4.2/10.0
- Livability +3.9/5.0
- Rent growth +2.5/5.0
- Condition / age +2.5/5.0
- Schools +1.1/10.0
- ARV discount +0.0/15.0
$159,000
🖨 Deal sheet 📄 Offer letter ✓ Due diligence
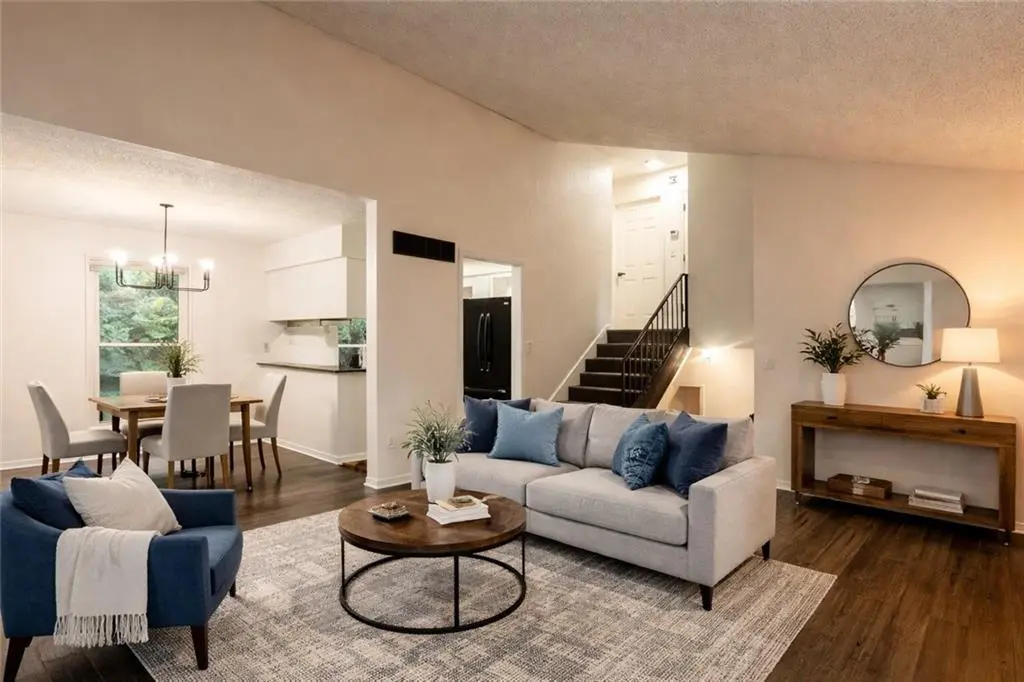
Listing remarks
Welcome home to this beautifully updated and move-in-ready townhome located in a quiet, well-maintained neighborhood in Kansas City! Offering 4 bedrooms, 2 full bathrooms, approximately 1,700 square feet of living space, and an attached garage, this property is an excellent opportunity for homeowners and investors alike. The seller will provide a brand-new HVAC system, giving buyers added peace of mind and long-term value. Additional recent updates include brand-new flooring, fresh interior paint, and numerous improvements throughout, creating a clean and modern feel from the moment you walk in. This vacant home is ready for immediate occupancy and presents an outstanding opportunity to bui
Key facts
- Garage
- Built 1975
- Listed 12 days
Property features AI
Exterior
- Parking: Attached garage (1 car) with garage facing front; Shared driveway
- Utilities: Public water; Public sewer
- Home design: Attached townhouse; Residential property; Side/side split layout; Living area approximately 1,259
- Construction: Wood siding; Composition roof; Built approximately 51–75 years ago
- Exterior features: Not in a flood plain
Interior
- Bedrooms: 3 bedrooms (upper level)
- Bathrooms: 2 full bathrooms
- Heating & cooling: Natural gas heating; Electric cooling (air conditioning)
- Interior features: Finished basement with inside entrance; Side/side split floor plan; One fireplace
Neighborhood map
What this means for you Summary
Snapshot
- This is a 2-bed/1.5-bath townhouse listed at $159k.
Deal economics
- At list price, monthly cash flow is $113 ($1k/yr) — positive.
- The deal already cash-flows at list — no discount required.
- To meet the 1% rule (rent ≥ 1% of price), the offer needs to be $147k (7.6% below list).
- Recommended offer: $147k (7.6% below list) — sets the bar for 1% rule.
- Cap rate 7.1% vs local median 3.9% in Kansas City — top-decile yield for the area; either an underpriced asset or a hidden risk that comps aren't pricing in. Stress-test before assuming the spread holds.
Location & tenants
- Location reads 78/100 on livability (#28 in MO, #2,671 nationally) — a middle-class / working-renter tenant base. Strengths: amenities A+, commute A+, cost of living A+; Watch: schools C-, crime F.
- Hickman Mills C-1 (urban): math 8% / reading 18% proficiency, ranked #314 of 324 in MO (top 97%) — low school quality limits family demand, transient renter base, plan for 1-2y turnover; 78% free/reduced lunch — lower-income household profile, screen leases tightly.
- Market conditions: 1 active listings in the ZIP; 32 comparable units currently listed for rent nearby; rentals at typical pace (median 24d on market — plan ~3-4 weeks tenant-placement turnaround); 41% of comp listings sitting > 30 days — soft ceiling on asking rent; 4,002 units permitted in Jackson County in 2024 (2,271 in 5+ unit buildings).
Forward outlook
- In year one you build about $6k of equity ($1k loan paydown + $5k appreciation (3.0% local appreciation)).
- Jackson County population projected at +4% by 2050 — modest demand growth; plan on rents tracking national, not racing it.
- At projected returns (3.0% appreciation + 3.0% rent growth), your $45k cash investment doubles in ~6 years — after that, you're playing with house money.
- By year 6, paydown + projected appreciation supports a ~$31k cash-out refi (75% LTV) — recoverable capital for the next deal without selling this one.
Negotiation context
- Only 13 days on market — expect competitive offers; lowballing is unlikely to land.
- 9 sale attempts since 10y ago with the ask held roughly flat each time — persistent listings suggest the price (not the market) is what's stuck; bring a comps-based counter.
Questions for the listing agent
- Built in 1975 — when were the roof, HVAC, electrical panel, plumbing, and water heater last replaced?
- Is there a deadline driving the sale (1031 exchange, divorce, estate, relocation)? That informs how much negotiation room exists.
- Crime grade is F in this area — have there been break-ins, vandalism, or insurance claims at this property in the last 3 years? What carrier currently insures it and at what premium?
- The area grade is low — what's the realistic commute time and amenity access for the typical tenant pool here? Any planned neighborhood developments (good or bad) we should know about?
- What's the average days-on-market for RENTAL listings here right now (not sales)? A rising rental-DOM trend means longer vacancies and softer asking-rent achievability than the comps imply.
- What's the recent tenant-quality profile in this submarket — average credit score on applications, eviction rate, late-payment / NSF rate, and stable-employment percentage? A property-management company in the area should have these aggregated.
- How much new for-sale + rental construction is in the pipeline within 1–3 miles? Heavy new supply typically softens prices + rents 12–24 months out; constrained supply supports both.
Investment metrics
- 1% rule
- 0.92% ✗
- Cap rate
- 7.14%
- Cash-on-cash
- 3.04%
- DSCR
- 1.14
- GRM
- 9.0
CMA / ARV
- ARV (median comp)
- $130,334
- List price
- $159,000
- Delta
- 21.99%
- Verdict
- OVERPRICED
- Comps
- 20 within 2.0 mi
Show comp detail 1 sale within ~0.75 mi
| Address | Dist | Beds/Ba | Sqft | Sold | Price | $/sf | Match |
|---|---|---|---|---|---|---|---|
| 9528 Manning Ave | 0.03mi | 2/1.5 | 1,413 (+12%) | 15mo | $100,000 | $71 | 66 |
Match score weights: distance 35% · size 25% · config 20% · recency 20%. Top-matched comps best support the ARV.
Projected returns pro-forma
3.0% appreciation · 3.0% rent growth · sell at horizon
- IRR
- 10.3%
- Equity multiple
- 1.59×
- Total profit
- $26,326
- Equity at exit
- $71,493
- IRR
- 12.6%
- Equity multiple
- 2.88×
- Total profit
- $83,664
- Equity at exit
- $110,180
Cash invested: $44,520 (down + closing). Projections, not guarantees.
Landlord ↔ Tenant lean methodology
- Overall (STATE)
- 81 Strongly Landlord-Friendly
- State Missouri
- 81 Strongly Landlord-Friendly · R+10
- County
- — inherits STATE
- City
- — inherits STATE
ZIP-level market 66134
- Active inventory
- 1
- Price-to-rent
- 9.0×
Monthly cashflow live
- Estimated rent
- $1,468 high interval (Pro) →
- Mortgage (P&I)
- −$834
- Tax from tax record
- −$147 /mo · $1,767/yr
- Insurance
- −$66
- HOA
- −$0
- Vacancy / Maint / Mgmt
- −$308
- Net cashflow
- $113
Break-even live
UW: 25.0% down · 7.5% · 30yr · 1.5% tax · 5.0% vac · 8.0% maint · 8.0% mgmt
Financing live
Cash to close
- Down payment
- $39,750
- Closing costs
- $4,770
- Reserves months
- —
- Total cash needed
- —
Loan-product check · same deal, 3 products live
Conventional
25% down · 7.5% · 30yr
- Down + closing
- —
- Monthly P&I
- —
- Monthly cashflow
- —
- DSCR
- —
- Eligible?
- —
Personal DTI + credit; lowest rate.
DSCR
20% down · 8.5% · 30yr
- Down + closing
- —
- Monthly P&I
- —
- Monthly cashflow
- —
- DSCR
- —
- Eligible?
- —
No personal income docs; deal must DSCR.
Hard money
10% down · 12.0% · 12mo
- Down + closing
- —
- Monthly P&I
- —
- Monthly cashflow
- —
- DSCR
- —
- Eligible?
- —
Short-term bridge; refi at stabilization.
Rent comps 32 comps
| Address | Beds | Baths | Sqft | Rent | $/sqft | DOM | Units | Dist |
|---|---|---|---|---|---|---|---|---|
| 9309 Farley Ave Kansas City, MO | 3.0 | 2.0 | 999 | $1,411 | $1.41 | 4d | 1 | 0.41mi |
| 9307 Stark Ave Kansas City, MO | 3.0 | 2.0 | 1073 | $1,385 | $1.29 | 43d | 1 | 0.46mi |
| 8713 E 92nd Pl Kansas City, MO | 3.0 | 2.0 | 1073 | $1,550 | $1.44 | 43d | 1 | 0.54mi |
| 9214 Farley Ave Kansas City, MO | 3.0 | 2.0 | 1060 | $1,686 | $1.59 | 12d | 1 | 0.55mi |
| 9516 Raytown Rd Kansas City, MO | 3.0 | 2.0 | 1000 | $1,445 | $1.45 | 16d | 1 | 0.62mi |
| 9809 Wallace Ave Kansas City, MO | 3.0 | 1.0 | 956 | $1,500 | $1.57 | 23d | 1 | 0.74mi |
| 8501 E 92nd St Kansas City, MO | 3.0 | 1.5 | 1107 | $1,745 | $1.58 | 23d | 1 | 0.79mi |
| 8407 E 98th Ter Kansas City, MO | 3.0 | 1.0 | 940 | $1,395 | $1.48 | 23d | 1 | 0.80mi |
| 8407 E 98th Ter Kansas City, MO | 3.0 | 1.0 | 940 | $1,395 | $1.48 | 16d | 1 | 0.80mi |
| 8506 E 91st Ter Kansas City, MO | 3.0 | 1.5 | 1020 | $1,450 | $1.42 | 16d | 1 | 0.81mi |
| 8509 E 91st St Kansas City, MO | 3.0 | 1.5 | 1350 | $1,350 | $1.00 | 43d | 1 | 0.83mi |
| 9727 Marsh Ave Kansas City, MO | 3.0 | 1.0 | 1271 | $1,706 | $1.34 | 43d | 1 | 0.85mi |
| 820 E 93rd Ter Kansas City, MO | 1.0–2.0 | 1.0–2.0 | 1040 | $1,165 | $1.12 | 4d | 1 | 0.85mi |
| 9811 Marsh Ave Kansas City, MO | 3.0 | 1.0 | 912 | $1,295 | $1.42 | 43d | 1 | 0.87mi |
| 8806 Crescent Ave Kansas City, MO | 3.0 | 2.5 | 1148 | $1,795 | $1.56 | 4d | 1 | 0.97mi |
| 10611 E 98th Ter Kansas City, MO | 2.0 | 1.0–2.0 | 1100 | $1,212 | $1.10 | 3d | 3 | 1.13mi |
| 8620 E Utopia Dr Raytown, MO | 1.0–3.0 | 1.0–2.0 | 854 | $1,050 | $1.23 | 1d | 10 | 1.15mi |
| 9723 View High Dr Kansas City, MO | 2.0 | 1.0 | 974 | $1,295 | $1.33 | 43d | 1 | 1.18mi |
| 8700 E 87th St Raytown, MO | 3.0 | 2.0 | 1032 | $1,481 | $1.44 | 17d | 1 | 1.20mi |
| 8001 E 89th Ter Kansas City, MO | 3.0 | 2.0 | 1014 | $1,545 | $1.52 | 43d | 1 | 1.23mi |
| 7800 E 91st St Kansas City, MO | 3.0 | 3.0 | 1747 | $1,895 | $1.08 | 43d | 1 | 1.23mi |
| 9302 Fairwood Dr Kansas City, MO | 3.0 | 1.0 | 1526 | $1,585 | $1.04 | 23d | 1 | 1.25mi |
| 9000 E 85th Pl Raytown, MO | 3.0 | 2.0 | 1580 | $1,375 | $0.87 | 43d | 1 | 1.26mi |
| 7902 E 89th Ter Kansas City, MO | 3.0 | 1.5 | 1068 | $1,516 | $1.42 | 17d | 1 | 1.26mi |
| 9115 E 85 St Unit 9115 Raytown, MO | 2.0 | 1.0 | 892 | $800 | $0.90 | 43d | 1 | 1.29mi |
| 8500 Elm Ave Raytown, MO | 3.0 | 2.0 | 1250 | $1,550 | $1.24 | 43d | 1 | 1.29mi |
| 8300 E 104th Ter Kansas City, MO | 3.0 | 1.0 | 1204 | $1,450 | $1.20 | 23d | 1 | 1.29mi |
| 8300 E 104th Ter Kansas City, MO | 3.0 | 1.0 | 1204 | $1,400 | $1.16 | 12d | 1 | 1.29mi |
| 8600 Everett St Raytown, MO | 3.0 | 1.5 | 956 | $1,550 | $1.62 | 43d | 1 | 1.30mi |
| 8002 E 88th Pl Kansas City, MO | 3.0 | 2.0 | 984 | $1,495 | $1.52 | 43d | 1 | 1.32mi |
| 8812 Manchester Ave Kansas City, MO | 3.0 | 1.0 | 1066 | $1,586 | $1.49 | 12d | 1 | 1.37mi |
| 10408 Smalley Ct Kansas City, MO | 3.0 | 1.5 | 1500 | $1,599 | $1.07 | 23d | 1 | 1.45mi |
Listing history 38 events
-
2026-06-18days on market $159,000 Active 13 DOM
-
2026-06-17days on market $159,000 Active 12 DOM
-
2026-06-16days on market $159,000 Active 11 DOM
-
2026-06-15days on market $159,000 Active 10 DOM
-
2026-06-13days on market $159,000 Active 8 DOM
-
2026-06-13days on market $159,000 Active 7 DOM
-
2026-06-09days on market $159,000 Active 4 DOM
-
2026-06-08days on market $159,000 Active 3 DOM
-
2026-06-07remarks 699-char remark
-
2026-06-07days on market $159,000 Active 2 DOM
-
2026-06-03days on market $159,000 Active 55 DOM
-
2026-06-02days on market $159,000 Active 54 DOM
-
2026-06-01days on market $159,000 Active 53 DOM
-
2026-05-31days on market $159,000 Active 52 DOM
-
2026-04-23$1,350
-
2026-04-10$159,000 Active 834-char remark
-
2026-04-09historical $159,000 834-char remark
-
2026-04-08historical
-
2026-03-01historical $1,350
-
2025-12-19$156,000 Active
-
2025-12-19historical
-
2025-12-18historical
-
2025-11-04$1,350
-
2025-10-03$159,000 Active
-
2025-09-30historical
-
2025-09-30historical
-
2025-09-07price $165,000
-
2025-08-01$169,000 Active
-
2025-07-27historical
-
2025-07-09soldstatus
-
2025-07-01soldstatus Closed
-
2025-05-21status Pending
-
2025-05-21$85,000 Active
-
2016-02-16soldstatus Sold
-
2016-01-22status Pending
-
2016-01-15$36,040 Auction
-
1998-04-22soldstatus
-
1991-05-21soldstatus
ⓘ Source: listings_history table (triggers on properties + properties_extension) + one-shot
backfill from property_details.listing_events for pre-trigger history.
Tax reassessment forecast MO · Resets to sale price
- Current annual tax
- $1,767 · $147/mo
- Projected year-2 tax
- $1,767 · $147/mo
- Expected delta
- $0/yr ($0/mo · 0.0%)
ⓘ Screening estimate from a state-policy table — verify with the county assessor before closing.
Climate risk First Street
- Flood 1/10 Low FEMA zone X (unshaded) · 0% chance over 30 yrs
- Wildfire 3/10 Moderate
- Heat 4/10 Moderate 7 d/yr ≥106°F today · 17 d/yr by 30 yrs out
- Wind 2/10 Low
- Air quality 3/10 Moderate 3 unhealthy d/yr today · 5 by 30 yrs out
Nearby sold comps map
Loading sold comps map…
Walkable amenities ~0.75 mi
Loading nearby amenities…
Taxation est. · year 1
- Rental income
- $17,622
- − Mortgage interest
- −$8,906
- − Property taxes
- −$1,767
- − Insurance
- −$795
- − Repairs & maintenance
- −$1,410
- − Management
- −$1,410
- − Depreciation
- −$4,625
- Taxable loss
- −$1,292
- Est. tax savings @ 24.0%
- +$310
- After-tax cash flow
- $1,663/yr
For passive investors: Depreciation is non-cash, so a rental often shows a tax loss while cash-flowing — sheltering income. Rental losses are passive: they offset passive income freely, and up to $25,000/yr can offset ordinary (W-2) income if you actively participate and your MAGI is under $100k (phasing out to $0 by $150k); unused losses carry forward. On sale, claimed depreciation is recaptured at up to 25%, and gains may owe capital-gains tax (a 1031 exchange can defer both). Figures are a year-1 estimate at your 24.0% rate — not tax advice; consult a CPA.
Schools (NCES district)
- District
- Hickman Mills C-1
- NCES district ID
- 2914340
- Math proficiency
- 8% ▼ -8.00%
- Reading proficiency
- 18% ▼ -4.00%
- Median HH income
- $40,908
- Composite
- 11.2/100
- National rank
- #9725
- State rank
- #314 of 324 in MO
Livability — Kansas City
- Score
- 78/100
- State rank
- #28
- US rank
- #2671
Category grades
Schools grade is shown separately in the Schools card above.
Census & demographics
- Census place
- Kansas City, MO
Population outlook (Jackson County) Hauer SSP2
- Today (2025)
- 719,589 people
- By 2030
- 731,456 · +1.6%
- By 2040
- 746,689 · +3.8%
- By 2050
- 749,289 · +4.1%
- By 2075
- 736,227 · +2.3%
- By 2100
- 668,210 · -7.1%
Not yet ingested
- Political lean
- —
- Race & ethnicity
- —
- Common origin
- —
- Civics
- —
Market trends
- HPI YoY
- —
- Current HPI
- —
- Rent YoY
- —
- Metro
- —
- State GDP YoY
- ▲ 1.84%
- F500 in state
- 20
Industry mix (Fortune 500 HQ in MO)
| Industry | F500 HQs | Revenue |
|---|---|---|
| Healthcare | 1 | $163B |
|
||
| Insurance | 1 | $21B |
|
||
| Industrial Technology | 1 | $17B |
|
||
| Retail | 1 | $16B |
|
||
| Industrial Distribution | 1 | $10B |
|
||
| Utilities | 1 | $9B |
|
||
Price history
+341.2% since first listed28 events — show timeline
- 2026-06-06 Listed $159,000 Heartland MLS as Distributed by MLS Grid
- 2026-06-05 Rental Removed $1,350 HMLS
- 2026-06-04 Coming Soon $159,000 Heartland MLS as Distributed by MLS Grid
- 2026-06-04 Listing Removed — Heartland MLS as Distributed by MLS Grid
- 2026-04-23 Listed for Rent $1,350 HMLS
- 2026-04-10 Listed $159,000 Heartland MLS as Distributed by MLS Grid
- 2026-04-09 Coming Soon — Heartland MLS as Distributed by MLS Grid
- 2026-04-08 Listing Removed — Heartland MLS as Distributed by MLS Grid
- 2026-03-01 Rental Removed $1,350 HMLS
- 2025-12-19 Listed $156,000 Heartland MLS as Distributed by MLS Grid
- 2025-12-19 Coming Soon — Heartland MLS as Distributed by MLS Grid
- 2025-12-18 Listing Removed — Heartland MLS as Distributed by MLS Grid
- 2025-11-04 Listed for Rent $1,350 HMLS
- 2025-10-03 Listed $159,000 Heartland MLS as Distributed by MLS Grid
- 2025-09-30 Coming Soon — Heartland MLS as Distributed by MLS Grid
- 2025-09-30 Listing Removed — Heartland MLS as Distributed by MLS Grid
- 2025-09-07 Price Changed $165,000 Heartland MLS as Distributed by MLS Grid
- 2025-08-01 Listed $169,000 Heartland MLS as Distributed by MLS Grid
- 2025-07-27 Coming Soon — Heartland MLS as Distributed by MLS Grid
- 2025-07-09 Sold (Public Records) — Public Records
- 2025-07-01 Sold (MLS) — Heartland MLS as Distributed by MLS Grid
- 2025-05-21 Pending — Heartland MLS as Distributed by MLS Grid
- 2025-05-21 Listed $85,000 Heartland MLS as Distributed by MLS Grid
- 2016-02-16 Sold (MLS) — Heartland MLS as Distributed by MLS Grid
- 2016-01-22 Pending — Heartland MLS as Distributed by MLS Grid
- 2016-01-15 Listed $36,040 Heartland MLS as Distributed by MLS Grid
- 1998-04-22 Sold (Public Records) — Public Records
- 1991-05-21 Sold (Public Records) — Public Records
Property tax history
+5.0%/yrLatest (2025): $1,767 · +6.4% YoY. Source: county tax records.
Cash-flow waterfall
monthlySold comps — $/sqft
last 12 mo · ≤1 miLoading sold comps…