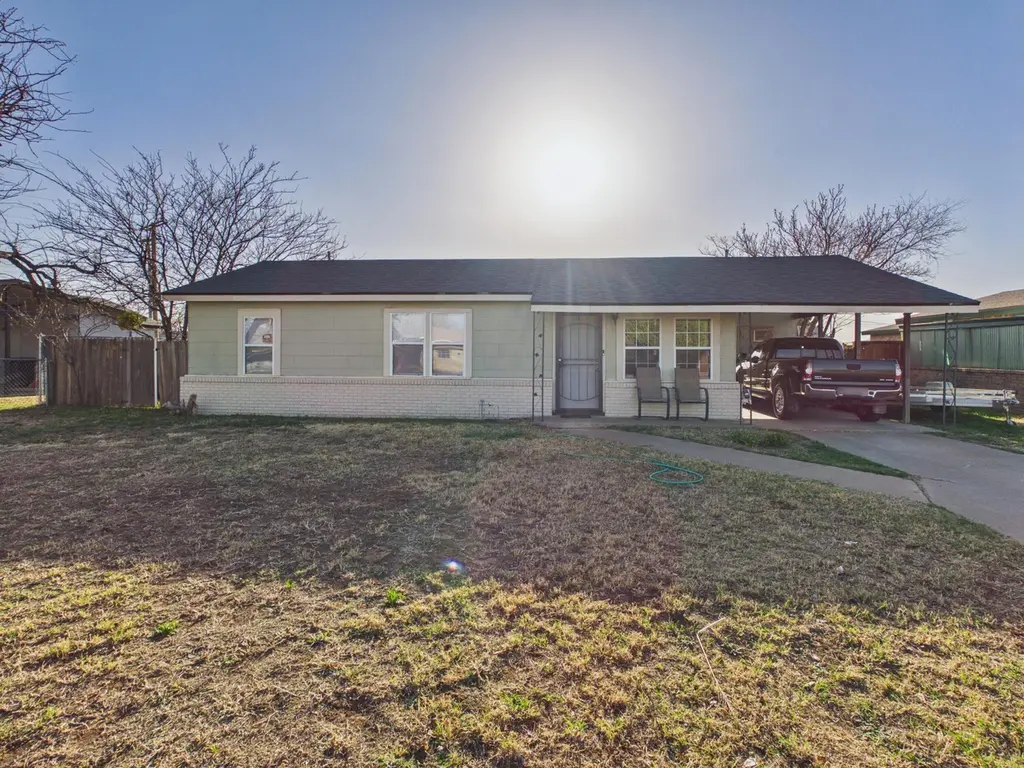
2804 Vanda Ave · Lubbock, TX
Flood risk 1/10 · Minimal
- FEMA flood zone
- X (unshaded)
- Chance of flooding over 30 yrs
- 0.0%
- Est. flood insurance / yr
- $507 – $1,088
Fire risk 5/10 · Moderate
- Est. fire insurance / yr
- $1,222 – $2,270
Heat risk 5/10 · Moderate
- Hot days now (above 100°F)
- 7 days/yr
- Hot days in 30 yrs
- 21 days/yr
Wind risk 2/10 · Minimal
- Chance of severe wind over 30 yrs
- 1.0%
Air-quality risk 2/10 · Minimal
- Unhealthy air days now
- 1 days/yr
- Unhealthy air days in 30 yrs
- 1 days/yr
Risk factors via First Street. Map © Google.
Why this score? — see what drove the B grade
The composite is a weighted blend of 9 inputs, each scored 0–100. Each bar is that input's sub-score; the figure is the points it added to the 100-point composite (weight × sub-score).
- Cash flow +28.5/30.0
- DSCR +10.0/10.0
- ARV discount +7.5/15.0
- 1% rule +6.9/10.0
- Appreciation +6.6/10.0
- Livability +4.0/5.0
- Schools +3.1/10.0
- Rent growth +2.5/5.0
- Condition / age +2.5/5.0
$89,900
🖨 Deal sheet 📄 Offer letter ✓ Due diligence
Listing remarks MLS
Freshly remodeled home ready for new owners! New roof, sewer line, windows, flooring, electrical, and so much more! Large backyard with storage/workshop.
Key facts
- New flooring
- New electrical
- New roof
Tags
Neighborhood map
What this means for you Summary
Snapshot
- This is a 3-bed/1.0-bath single-family listed at $90k.
Deal economics
- At list price, monthly cash flow is $295 ($4k/yr) — positive.
- The deal already cash-flows at list — no discount required.
- Meets the 1% rule at list price ($1k rent vs $90k).
- Recommended offer: $79k (12.0% below list) — sets the bar for market timing.
Location & tenants
- Location reads 80/100 on livability (#37 in TX, #1,749 nationally) — a professional / high-income tenant draw. Strengths: commute A+, cost of living A+, housing A+; Watch: employment C-, schools D+, crime F.
- Lubbock ISD (urban): math 36% / reading 39% proficiency, ranked #481 of 826 in TX (top 58%) — families likely to look elsewhere, expect single-tenant / working-renter base with shorter leases; 60% free/reduced lunch — lower-income household profile, screen leases tightly.
- Market conditions: 91 active listings in the ZIP; 18 comparable units currently listed for rent nearby; rentals lingering (median 44d on market — plan ~5-8 weeks vacancy on turnover, expect pricing pressure); 56% of comp listings sitting > 30 days — soft ceiling on asking rent; 2,219 units permitted in Lubbock County in 2024 (252 in 5+ unit buildings).
Forward outlook
- In year one you build about $4k of equity ($622 loan paydown + $3k appreciation (3.2% local appreciation)).
- Lubbock County population projected at +39% by 2050 — long-run rental-demand tailwind backs the buy-and-hold thesis.
- At projected returns (3.2% appreciation + 3.0% rent growth), your $25k cash investment doubles in ~4 years — after that, you're playing with house money.
- By year 10, paydown + projected appreciation supports a ~$34k cash-out refi (75% LTV) — recoverable capital for the next deal without selling this one.
Negotiation context
- It's been on market 163 days — a 12% lower offer ($79k) is reasonable based on typical stale-listing flexibility.
- 4 sale attempts; this cycle's ask has dropped $5k (5%) from the opening price — seller is motivated, your offer sets the floor, not the list.
Risks & watch-outs
- Watch-outs: built in 1959 — expect roof / HVAC / electrical / plumbing capex.
- Climate carrying-cost: moderate wildfire risk; extreme-heat days projected 7→21/yr by 2055 (HVAC capex compounding) — expect insurance premiums to compound above CPI over the hold.
Questions for the listing agent
- It's been on market 163 days. Have you received any prior offers? Is the seller open to a 12% concession, seller financing, or rate buy-down credit?
- Built in 1959 — when were the roof, HVAC, electrical panel, plumbing, and water heater last replaced?
- Why hasn't it sold? Are there any deal-killer items the seller is aware of (foundation, flood, title, zoning, code violations)?
- Is there a deadline driving the sale (1031 exchange, divorce, estate, relocation)? That informs how much negotiation room exists.
- Schools are D-rated, which usually means shorter tenancies and higher turnover. Who's the typical renter profile here, and what's been the actual vacancy rate?
- Crime grade is F in this area — have there been break-ins, vandalism, or insurance claims at this property in the last 3 years? What carrier currently insures it and at what premium?
- What's the average days-on-market for RENTAL listings here right now (not sales)? A rising rental-DOM trend means longer vacancies and softer asking-rent achievability than the comps imply.
- What's the recent tenant-quality profile in this submarket — average credit score on applications, eviction rate, late-payment / NSF rate, and stable-employment percentage? A property-management company in the area should have these aggregated.
- How much new for-sale + rental construction is in the pipeline within 1–3 miles? Heavy new supply typically softens prices + rents 12–24 months out; constrained supply supports both.
Investment metrics
- 1% rule
- 1.19% ✓
- Cap rate
- 10.23%
- Cash-on-cash
- 14.05%
- DSCR
- 1.63
- GRM
- 7.0
CMA / ARV
- ARV (median comp)
- $50,517
- List price
- $89,900
- Delta
- 77.96%
- Verdict
- OVERPRICED
- Comps
- 2 within 2.0 mi
Projected returns pro-forma
3.22% appreciation · 3.0% rent growth · sell at horizon
- IRR
- 21.2%
- Equity multiple
- 2.22×
- Total profit
- $30,643
- Equity at exit
- $41,559
- IRR
- 22.0%
- Equity multiple
- 4.24×
- Total profit
- $81,443
- Equity at exit
- $64,944
Cash invested: $25,172 (down + closing). Projections, not guarantees.
Landlord ↔ Tenant lean methodology
- Overall (STATE)
- 87 Strongly Landlord-Friendly
- State Texas
- 87 Strongly Landlord-Friendly · R+5
- County
- — inherits STATE
- City
- — inherits STATE
ZIP-level market 79404
- Home prices YoY
- 2.0%
- Active inventory
- 91
- Price-to-rent
- 7.0×
Monthly cashflow live
- Estimated rent
- $1,071 high interval (Pro) →
- Mortgage (P&I)
- −$471
- Tax from tax record
- −$42 /mo · $510/yr
- Insurance
- −$37
- HOA
- −$0
- Vacancy / Maint / Mgmt
- −$225
- Net cashflow
- $295
Break-even live
UW: 25.0% down · 7.5% · 30yr · 1.5% tax · 5.0% vac · 8.0% maint · 8.0% mgmt
Financing live
Cash to close
- Down payment
- $22,475
- Closing costs
- $2,697
- Reserves months
- —
- Total cash needed
- —
Loan-product check · same deal, 3 products live
Conventional
25% down · 7.5% · 30yr
- Down + closing
- —
- Monthly P&I
- —
- Monthly cashflow
- —
- DSCR
- —
- Eligible?
- —
Personal DTI + credit; lowest rate.
DSCR
20% down · 8.5% · 30yr
- Down + closing
- —
- Monthly P&I
- —
- Monthly cashflow
- —
- DSCR
- —
- Eligible?
- —
No personal income docs; deal must DSCR.
Hard money
10% down · 12.0% · 12mo
- Down + closing
- —
- Monthly P&I
- —
- Monthly cashflow
- —
- DSCR
- —
- Eligible?
- —
Short-term bridge; refi at stabilization.
Rent comps 18 comps
| Address | Beds | Baths | Sqft | Rent | $/sqft | DOM | Units | Dist |
|---|---|---|---|---|---|---|---|---|
| 3113 Teak Ave Lubbock, TX | 3.0 | 1.0 | 1088 | $695 | $0.64 | 21d | 1 | 0.27mi |
| 3113 Teak Ave Lubbock, TX | 3.0 | 1.0 | 1088 | $750 | $0.69 | 43d | 1 | 0.27mi |
| 1704 E 29th St Lubbock, TX | 2.0 | 1.0 | 832 | $775 | $0.93 | 21d | 1 | 0.31mi |
| 2906 Beech Ave Lubbock, TX | 3.0 | 1.0 | 912 | $1,200 | $1.32 | 43d | 1 | 0.33mi |
| 1516 E 27th St Unit B Lubbock, TX | 2.0 | 2.0 | 1025 | $1,195 | $1.17 | 43d | 1 | 0.34mi |
| 2806 E 30th St Lubbock, TX | 3.0 | 1.0 | 912 | $900 | $0.99 | 43d | 1 | 0.42mi |
| 1903 E 15th St Unit B Lubbock, TX | 2.0 | 2.0 | 950 | $1,075 | $1.13 | 13d | 1 | 0.93mi |
| 2123 E Broadway Unit 2 Lubbock, TX | 3.0 | 1.0 | 963 | $950 | $0.99 | 21d | 1 | 1.13mi |
| 2117 E Broadway Unit 1 Lubbock, TX | 3.0 | 1.0 | 963 | $950 | $0.99 | 43d | 1 | 1.13mi |
| 2226 E Main St Lubbock, TX | 3.0 | 2.0 | 1100 | $1,150 | $1.05 | 43d | 1 | 1.16mi |
| 505 E 37th St Lubbock, TX | 3.0 | 1.0 | 960 | $1,125 | $1.17 | 13d | 1 | 1.18mi |
| 824 Vanda Ave Lubbock, TX | 3.0 | 1.0 | 832 | $750 | $0.90 | 43d | 1 | 1.24mi |
| 808 Vanda Ave Lubbock, TX | 3.0 | 1.0 | 832 | $695 | $0.84 | 21d | 1 | 1.32mi |
| 1014 David Ave Lubbock, TX | 3.0 | 2.0 | 1028 | $1,030 | $1.00 | 13d | 1 | 1.34mi |
| 804 David Ave Lubbock, TX | 3.0 | 2.0 | 1028 | $1,049 | $1.02 | 13d | 1 | 1.45mi |
| 3621 E 15th Pl Lubbock, TX | 3.0 | 2.0 | 1028 | $1,114 | $1.08 | 43d | 1 | 1.46mi |
| 209 36th St Unit A Lubbock, TX | 3.0 | 1.0 | 750 | $750 | $1.00 | 43d | 1 | 1.49mi |
| 211 36th St Unit B Lubbock, TX | 3.0 | 1.0 | 750 | $775 | $1.03 | 43d | 1 | 1.49mi |
Listing history 32 events
-
2026-06-18days on market $89,900 Active 163 DOM
-
2026-06-17days on market $89,900 Active 162 DOM
-
2026-06-16days on market $89,900 Active 161 DOM
-
2026-06-15days on market $89,900 Active 160 DOM
-
2026-06-14days on market $89,900 Active 158 DOM
-
2026-06-13days on market $89,900 Active 157 DOM
-
2026-06-10days on market $89,900 Active 155 DOM
-
2026-06-09days on market $89,900 Active 154 DOM
-
2026-06-08days on market $89,900 Active 153 DOM
-
2026-06-07days on market $89,900 Active 152 DOM
-
2026-06-05days on market $89,900 Active 149 DOM
-
2026-06-03days on market $89,900 Active 148 DOM
-
2026-06-02days on market $89,900 Active 147 DOM
-
2026-06-01days on market $89,900 Active 146 DOM
-
2026-05-31days on market $89,900 Active 145 DOM
-
2026-05-30days on market $89,900 Active 144 DOM
-
2026-04-01status Active 153-char remark
Show marketing remark (153 chars)
Freshly remodeled home ready for new owners! New roof, sewer line, windows, flooring, electrical, and so much more! Large backyard with storage/workshop.
-
2026-04-01historical 153-char remark
Show marketing remark (153 chars)
Freshly remodeled home ready for new owners! New roof, sewer line, windows, flooring, electrical, and so much more! Large backyard with storage/workshop.
-
2026-03-27price $89,900 153-char remark
Show marketing remark (153 chars)
Freshly remodeled home ready for new owners! New roof, sewer line, windows, flooring, electrical, and so much more! Large backyard with storage/workshop.
-
2026-01-01$95,000 Active 153-char remark
Show marketing remark (153 chars)
Freshly remodeled home ready for new owners! New roof, sewer line, windows, flooring, electrical, and so much more! Large backyard with storage/workshop.
-
2026-01-01$95,000 Active
Show marketing remark (153 chars)
Freshly remodeled home ready for new owners! New roof, sewer line, windows, flooring, electrical, and so much more! Large backyard with storage/workshop.
-
2025-11-13price $103,000
-
2025-04-15soldstatus
-
2025-04-04soldstatus Closed
-
2025-03-24status Pending
-
2025-03-05price $37,500
-
2025-02-20price $40,000
-
2025-02-10price $42,500
-
2025-01-24$45,000 Active
-
2003-10-01soldstatus
-
2003-02-01soldstatus
-
1986-01-01soldstatus
ⓘ Source: listings_history table (triggers on properties + properties_extension) + one-shot
backfill from property_details.listing_events for pre-trigger history.
Tax reassessment forecast TX · Resets to sale price
- Current annual tax
- $510 · $42/mo
- Projected year-2 tax
- $1,645 · $137/mo
- Expected delta
- +$1,136/yr (+$95/mo · 222.8%)
ⓘ Screening estimate from a state-policy table — verify with the county assessor before closing.
Climate risk First Street
- Flood 1/10 Low FEMA zone X (unshaded) · 0% chance over 30 yrs
- Wildfire 5/10 Major
- Heat 5/10 Major 7 d/yr ≥100°F today · 21 d/yr by 30 yrs out
- Wind 2/10 Low 100% chance of damaging wind over 30 yrs
- Air quality 2/10 Low 1 unhealthy d/yr today · 1 by 30 yrs out
Nearby sold comps map
Loading sold comps map…
Walkable amenities ~0.75 mi
Loading nearby amenities…
Taxation est. · year 1
- Rental income
- $12,852
- − Mortgage interest
- −$5,036
- − Property taxes
- −$510
- − Insurance
- −$450
- − Repairs & maintenance
- −$1,028
- − Management
- −$1,028
- − Depreciation
- −$2,615
- Taxable income
- $2,186
- Est. tax owed @ 24.0%
- −$525
- After-tax cash flow
- $3,012/yr
For passive investors: Depreciation is non-cash, so a rental often shows a tax loss while cash-flowing — sheltering income. Rental losses are passive: they offset passive income freely, and up to $25,000/yr can offset ordinary (W-2) income if you actively participate and your MAGI is under $100k (phasing out to $0 by $150k); unused losses carry forward. On sale, claimed depreciation is recaptured at up to 25%, and gains may owe capital-gains tax (a 1031 exchange can defer both). Figures are a year-1 estimate at your 24.0% rate — not tax advice; consult a CPA.
Schools (NCES district)
- District
- Lubbock ISD
- NCES district ID
- 4828500
- Math proficiency
- 36% ▼ -8.00%
- Reading proficiency
- 39% ▼ -1.00%
- Median HH income
- $39,820
- Composite
- 31.44/100
- National rank
- #5984
- State rank
- #481 of 826 in TX
Livability — Lubbock
- Score
- 80/100
- State rank
- #37
- US rank
- #1749
Category grades
Schools grade is shown separately in the Schools card above.
Census & demographics
- Census place
- Lubbock, TX
- County
- Lubbock County · 293,542 people
- City population
- 283,030
- Metro
- Lubbock, TX
- Population (ZIP)
- 8,529
- Household income
- $51,630
- Rent vs Own
- Severe rent burden
- 366.0
Population outlook (Lubbock County) Hauer SSP2
- Today (2025)
- 345,960 people
- By 2030
- 371,449 · +7.4%
- By 2040
- 424,539 · +22.7%
- By 2050
- 481,150 · +39.1%
- By 2075
- 633,467 · +83.1%
- By 2100
- 746,853 · +115.9%
Race, ethnicity, and origin ACS 2023
- Neighborhood character
- Diverse neighborhood (Simpson 0.60)
- Race & ethnicity
- Hispanic / Latino 55% Black 22% White 20% Two or more races 17% Native American 2%
- Hispanic origin (detail)
- Mexican 46%
- Common ancestry
- Romanian 1% Lithuanian 0%
- Foreign-born
- 5% · Canada
- Languages at home
- 64% English-only · Spanish 36%
Political lean MEDSL · Lubbock
- 2024 margin
- Solid R (+39.5) · D 29.7% · R 69.2% · Other 1.0%
- 2008→2024 swing
- -2.8pp toward R · 2008: -36.7pp · 2024: -39.5pp
- All cycles
- 2024: R+39.5 2020: R+32.2 2016: R+38.4 2012: R+40.9 2008: R+36.7
Not yet ingested
- Civics
- —
Market trends
- HPI YoY
- ▲ 3.22%
- Current HPI
- 163.854
- Rent YoY
- —
- Metro
- Lubbock, TX
- State GDP YoY
- ▲ 3.95%
- F500 in state
- 110
Industry mix (Fortune 500 HQ in TX)
| Industry | F500 HQs | Revenue |
|---|---|---|
| Energy | 16 | $1,198B |
|
||
| Technology | 5 | $198B |
|
||
| Engineering / Construction | 4 | $72B |
|
||
| Energy Services | 3 | $60B |
|
||
| Utilities | 3 | $41B |
|
||
| Healthcare | 2 | $330B |
|
||
Price history
+99.8% since first listed16 events — show timeline
- 2026-04-01 Relisted — LARMLS
- 2026-04-01 Delisted — LARMLS
- 2026-03-27 Price Changed $89,900 LARMLS
- 2026-01-01 Listed $95,000 LARMLS
- 2026-01-01 Listed $95,000 LARMLS
- 2025-11-13 Price Changed $103,000 LARMLS
- 2025-04-15 Sold (Public Records) — Public Records
- 2025-04-04 Sold (MLS) — LARMLS
- 2025-03-24 Pending — LARMLS
- 2025-03-05 Price Changed $37,500 LARMLS
- 2025-02-20 Price Changed $40,000 LARMLS
- 2025-02-10 Price Changed $42,500 LARMLS
- 2025-01-24 Listed $45,000 LARMLS
- 2003-10-01 Sold (Public Records) — Public Records
- 2003-02-01 Sold (Public Records) — Public Records
- 1986-01-01 Sold (Public Records) — Public Records
Property tax history
+0.1%/yrLatest (2025): $510 · -54.8% YoY. Source: county tax records.
Cash-flow waterfall
monthlySold comps — $/sqft
last 12 mo · ≤1 miLoading sold comps…