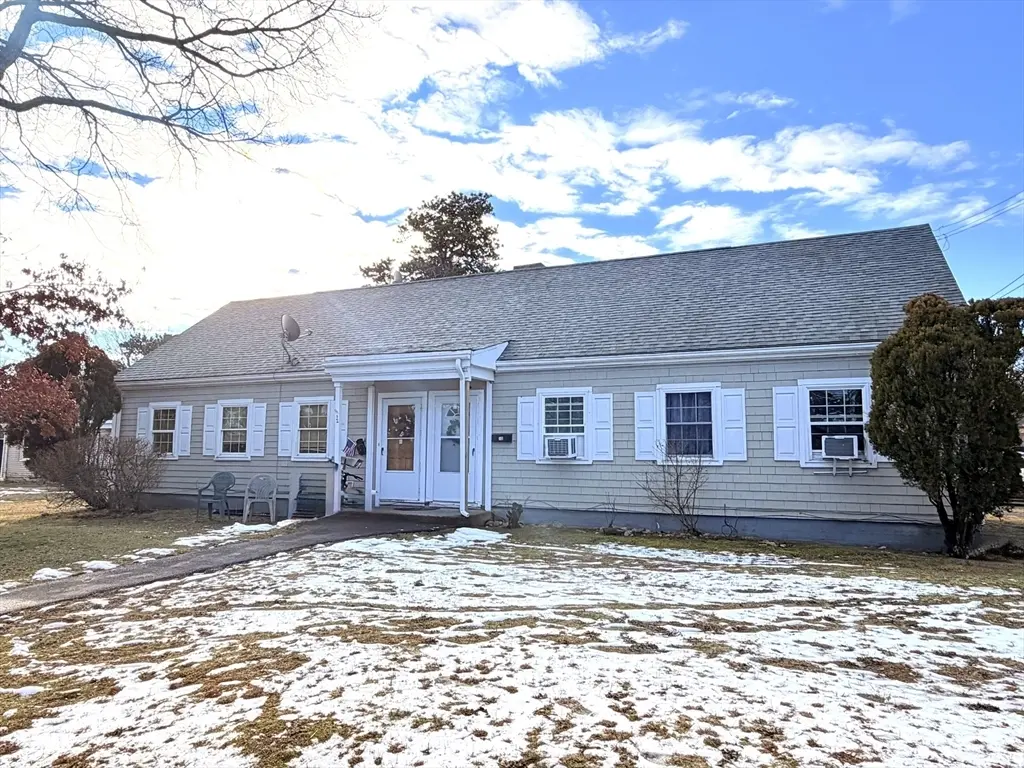
 Duplex
10-12 Hiramar Rd · Barnstable Town, MA
Flood risk 1/10 · Minimal
- FEMA flood zone
- X (unshaded)
- Chance of flooding over 30 yrs
- 0.0%
- Est. flood insurance / yr
- $507 – $1,088
Fire risk 1/10 · Minimal
- Est. fire insurance / yr
- $915 – $1,699
Heat risk 5/10 · Moderate
- Hot days now (above 88°F)
- 7 days/yr
- Hot days in 30 yrs
- 18 days/yr
Wind risk 8/10 · Major
- Chance of severe wind over 30 yrs
- 80.0%
Air-quality risk 2/10 · Minimal
- Unhealthy air days now
- 1 days/yr
- Unhealthy air days in 30 yrs
- 1 days/yr
Risk factors via First Street. Map © Google.
Why this score? — see what drove the C- grade
The composite is a weighted blend of 9 inputs, each scored 0–100. Each bar is that input's sub-score; the figure is the points it added to the 100-point composite (weight × sub-score).
- Cash flow +24.5/30.0
- DSCR +7.9/10.0
- 1% rule +5.2/10.0
- ARV discount +3.6/15.0
- Livability +3.3/5.0
- Schools +3.0/10.0
- Rent growth +2.5/5.0
- Condition / age +2.5/5.0
- Appreciation +0.0/10.0
$625,000
🖨 Deal sheet 📄 Offer letter ✓ Due diligence
Multi-family units
County records classify this as Multi-Family (2-4 Unit). Listing-text estimate: 2 units. confirmed
Listing remarks MLS
Excellent Investment Opportunity in the Heart of Hyannis! This well-located duplex offers 4 bedrooms and 2 bathrooms, making it an ideal opportunity for investors. Each unit provides comfortable living space with strong rental potential in a high-demand area. Situated in the center of Hyannis, this property is close to Main Street, shopping, dining, ferries, beaches, and public transportation, an unbeatable location for long-term rentals. If you're looking to expand your portfolio, this duplex offers versatility, steady income potential, and future upside.
Key facts
- Close to main street
- High-demand area
- 8,276 sq ft lot
Tags
Neighborhood map
What this means for you Summary
Snapshot
- This is a 2 × 2-bed/1.0-bath units multifamily listed at $625k.
Deal economics
- At list price, monthly cash flow is $1k ($15k/yr) — positive. Per door: $642/mo.
- The deal already cash-flows at list — no discount required.
- Meets the 1% rule at list price ($6k rent vs $625k).
- Recommended offer: $550k (12.0% below list) — sets the bar for market timing.
- Cap rate 8.8% vs local median 3.1% in Barnstable Town — top-decile yield for the area; either an underpriced asset or a hidden risk that comps aren't pricing in. Stress-test before assuming the spread holds.
Location & tenants
- Location reads 66/100 on livability (#169 in MA) — a middle-class / working-renter tenant base. Strengths: employment A+, housing A-, commute B+; Watch: amenities F, cost of living F, health & safety D-.
- Barnstable (urban): math 25% / reading 42% proficiency, ranked #237 of 302 in MA (top 78%) — families likely to look elsewhere, expect single-tenant / working-renter base with shorter leases.
- Market conditions: 44 active listings in the ZIP; 4 comparable units currently listed for rent nearby; rentals lingering (median 44d on market — plan ~5-8 weeks vacancy on turnover, expect pricing pressure); 100% of comp listings sitting > 30 days — soft ceiling on asking rent; 657 units permitted in Barnstable County in 2024 (178 in 5+ unit buildings).
- At $6,382/mo this rent would consume 125% of the median local household income ($61k/yr) (locally 1557% of renters already pay >50% of income on rent) — very limited rent-growth headroom before tenants either downsize or default.
Forward outlook
- Local home prices are declining (-3.0%/yr); year-one equity from $4k of loan paydown is wiped out by about $19k of value loss. Plan a longer hold.
- Barnstable County population projected at -20% by 2050 — secular population decline; favor cash flow + early exit over multi-decade hold.
Negotiation context
- It's been on market 134 days — a 12% lower offer ($550k) is reasonable based on typical stale-listing flexibility.
- 5 sale attempts since 21y ago with the ask held roughly flat each time — persistent listings suggest the price (not the market) is what's stuck; bring a comps-based counter.
- Current owner paid $212k; list at $625k implies a 195% gain — meaningful room to come down on a strong offer.
Risks & watch-outs
- Watch-outs: built in 1945 — expect roof / HVAC / electrical / plumbing capex.
- Climate carrying-cost: severe wind risk, 80% chance of damaging wind over 30y; extreme-heat days projected 7→18/yr by 2055 (HVAC capex compounding) — expect insurance premiums to compound above CPI over the hold.
Questions for the listing agent
- It's been on market 134 days. Have you received any prior offers? Is the seller open to a 12% concession, seller financing, or rate buy-down credit?
- Can we see the unit-by-unit rent roll, current vacancy, and any below-market leases? What's the average tenancy length?
- What capital expenditures (roof, boiler, parking lot, exteriors) have been made in the last 5 years, and what's planned in the next 2?
- Built in 1945 — when were the roof, HVAC, electrical panel, plumbing, and water heater last replaced?
- Why hasn't it sold? Are there any deal-killer items the seller is aware of (foundation, flood, title, zoning, code violations)?
- Is there a deadline driving the sale (1031 exchange, divorce, estate, relocation)? That informs how much negotiation room exists.
- Schools are B-rated — typically a magnet for longer-tenancy family renters. What's the average tenant stay here, and is there a school-zone premium baked into asking?
- What's the average days-on-market for RENTAL listings here right now (not sales)? A rising rental-DOM trend means longer vacancies and softer asking-rent achievability than the comps imply.
- What's the recent tenant-quality profile in this submarket — average credit score on applications, eviction rate, late-payment / NSF rate, and stable-employment percentage? A property-management company in the area should have these aggregated.
- How much new apartment / multifamily construction is in the pipeline within 1–3 miles? Heavy new supply (>2% of stock underway) typically softens rents 12–24 months out; light construction supports rent growth.
Investment metrics
- 1% rule
- 1.02% ✓
- Cap rate
- 8.76%
- Cash-on-cash
- 8.80%
- DSCR
- 1.39
- GRM
- 8.2
CMA / ARV
- ARV (median comp)
- $575,437
- List price
- $625,000
- Delta
- 8.61%
- Verdict
- FAIR
- Comps
- 4 within 1.0 mi
Show comp detail 2 sales within ~0.75 mi
| Address | Dist | Beds/Ba | Sqft | Sold | Price | $/sf | Match |
|---|---|---|---|---|---|---|---|
| 406 Bearses Way | 0.03mi | 4/2.0 | 1,440 (0%) | 11mo | $581,000 | $403 | 89 |
| 406 Bearses Way | 0.03mi | 4/2.0 | 1,440 (0%) | 11mo | $581,000 | $403 | 89 |
Match score weights: distance 35% · size 25% · config 20% · recency 20%. Top-matched comps best support the ARV.
Projected returns pro-forma
-3.0% appreciation · 3.0% rent growth · sell at horizon
- IRR
- -3.0%
- Equity multiple
- 0.89×
- Total profit
- $-19,755
- Equity at exit
- $93,190
- IRR
- 6.7%
- Equity multiple
- 1.50×
- Total profit
- $87,081
- Equity at exit
- $54,039
Cash invested: $175,000 (down + closing). Projections, not guarantees.
Landlord ↔ Tenant lean methodology
- Overall (STATE)
- 20 Strongly Tenant-Friendly
- State Massachusetts
- 20 Strongly Tenant-Friendly · D+15
- County
- — inherits STATE
- City
- — inherits STATE
ZIP-level market 02601
- Home prices YoY
- -25.1%
- Active inventory
- 44
- Price-to-rent
- 16.3×
Monthly cashflow live
- Estimated rent
- $6,382 medium interval (Pro) →
- Mortgage (P&I)
- −$3,278
- Tax from tax record
- −$220 /mo · $2,639/yr
- Insurance
- −$260
- HOA
- −$0
- Vacancy / Maint / Mgmt
- −$1,340
- Net cashflow
- $1,284
Break-even live
2-unit breakdown (identical units grouped — click to expand)
| Units | Beds | Baths | Est. rent |
|---|---|---|---|
| 2× units | 2 | 1 | $6,382 |
| #1 | 2 | 1 | $3,191 |
| #2 | 2 | 1 | $3,191 |
| Total (2 units) | $6,382 | ||
UW: 25.0% down · 7.5% · 30yr · 1.5% tax · 5.0% vac · 8.0% maint · 8.0% mgmt
Financing live
Cash to close
- Down payment
- $156,250
- Closing costs
- $18,750
- Reserves months
- —
- Total cash needed
- —
Loan-product check · same deal, 3 products live
Conventional
25% down · 7.5% · 30yr
- Down + closing
- —
- Monthly P&I
- —
- Monthly cashflow
- —
- DSCR
- —
- Eligible?
- —
Personal DTI + credit; lowest rate.
DSCR
20% down · 8.5% · 30yr
- Down + closing
- —
- Monthly P&I
- —
- Monthly cashflow
- —
- DSCR
- —
- Eligible?
- —
No personal income docs; deal must DSCR.
Hard money
10% down · 12.0% · 12mo
- Down + closing
- —
- Monthly P&I
- —
- Monthly cashflow
- —
- DSCR
- —
- Eligible?
- —
Short-term bridge; refi at stabilization.
Rent comps 4 comps
| Address | Beds | Baths | Sqft | Rent | $/sqft | DOM | Units | Dist |
|---|---|---|---|---|---|---|---|---|
| 7 General Patton Dr Hyannis, MA | 3.0 | 1.5 | 1005 | $2,800 | $2.79 | 43d | 1 | 0.17mi |
| 310 Barnstable Rd Hyannis, MA | 3.0 | 2.0 | 1022 | $3,000 | $2.94 | 43d | 1 | 0.63mi |
| 24 Crocker St Unit A4 Hyannis, MA | 4.0 | 1.5 | 1000 | $2,950 | $2.95 | 43d | 1 | 1.09mi |
| 99 Wilkens Ln Hyannis, MA | 3.0 | 1.0–2.0 | 1002 | $4,790 | $4.78 | 43d | 31 | 1.32mi |
Listing history 12 events
-
2026-01-12$625,000 New 562-char remark
Show marketing remark (562 chars)
Excellent Investment Opportunity in the Heart of Hyannis! This well-located duplex offers 4 bedrooms and 2 bathrooms, making it an ideal opportunity for investors. Each unit provides comfortable living space with strong rental potential in a high-demand area. Situated in the center of Hyannis, this property is close to Main Street, shopping, dining, ferries, beaches, and public transportation, an unbeatable location for long-term rentals. If you're looking to expand your portfolio, this duplex offers versatility, steady income potential, and future upside.
-
2020-03-17historical
-
2020-03-17historical
-
2019-09-04historical
-
2018-01-31soldstatus $212,000 Sold
-
2017-11-08status Under Agreement
-
2017-11-08$215,000 New
-
2006-04-12$249,900
-
2006-01-20$269,000
-
2005-10-19soldstatus $218,000
-
2005-10-03$259,999
-
1990-08-15soldstatus $94,000
ⓘ Source: listings_history table (triggers on properties + properties_extension) + one-shot
backfill from property_details.listing_events for pre-trigger history.
Tax reassessment forecast MA · Partial reset (capped growth)
- Current annual tax
- $2,639 · $220/mo
- Projected year-2 tax
- $5,163 · $430/mo
- Expected delta
- +$2,524/yr (+$210/mo · 95.7%)
ⓘ Screening estimate from a state-policy table — verify with the county assessor before closing.
Climate risk First Street
- Flood 1/10 Low FEMA zone X (unshaded) · 0% chance over 30 yrs
- Wildfire 1/10 Low
- Heat 5/10 Major 7 d/yr ≥88°F today · 18 d/yr by 30 yrs out
- Wind 8/10 Severe 80% chance of damaging wind over 30 yrs
- Air quality 2/10 Low 1 unhealthy d/yr today · 1 by 30 yrs out
Nearby sold comps map
Loading sold comps map…
Walkable amenities ~0.75 mi
Loading nearby amenities…
Taxation est. · year 1
- Rental income
- $76,584
- − Mortgage interest
- −$35,010
- − Property taxes
- −$2,639
- − Insurance
- −$3,125
- − Repairs & maintenance
- −$6,127
- − Management
- −$6,127
- − Depreciation
- −$18,182
- Taxable income
- $5,375
- Est. tax owed @ 24.0%
- −$1,290
- After-tax cash flow
- $14,117/yr
For passive investors: Depreciation is non-cash, so a rental often shows a tax loss while cash-flowing — sheltering income. Rental losses are passive: they offset passive income freely, and up to $25,000/yr can offset ordinary (W-2) income if you actively participate and your MAGI is under $100k (phasing out to $0 by $150k); unused losses carry forward. On sale, claimed depreciation is recaptured at up to 25%, and gains may owe capital-gains tax (a 1031 exchange can defer both). Figures are a year-1 estimate at your 24.0% rate — not tax advice; consult a CPA.
Schools (NCES district)
- District
- Barnstable
- NCES district ID
- 2502310
- Math proficiency
- 25% ▼ -20.00%
- Reading proficiency
- 42% ▼ -9.00%
- Median HH income
- $61,692
- Composite
- 30.16/100
- National rank
- #6322
- State rank
- #237 of 302 in MA
Livability — Barnstable Town
- Score
- 66/100
- State rank
- #169
- US rank
- #11289
Category grades
Schools grade is shown separately in the Schools card above.
Census & demographics
- Census place
- Barnstable Town, MA
- County
- Barnstable County · 16,071 people
- City population
- 48,715
- Metro
- Barnstable Town, MA
- Population (ZIP)
- 16,071
- Household income
- $61,143
- Rent vs Own
- Severe rent burden
- 1557.0
Population outlook (Barnstable County) Hauer SSP2
- Today (2025)
- 208,497 people
- By 2030
- 202,530 · -2.9%
- By 2040
- 184,936 · -11.3%
- By 2050
- 167,489 · -19.7%
- By 2075
- 144,938 · -30.5%
- By 2100
- 117,312 · -43.7%
Race, ethnicity, and origin ACS 2023
- Neighborhood character
- Diverse neighborhood (Simpson 0.68)
- Race & ethnicity
- White 54% Two or more races 15% Black 14% Hispanic / Latino 12% Asian 2%
- Hispanic origin (detail)
- Puerto Rican 2% Dominican 1%
- Common ancestry
- Estonian 11% Russian 5% Lithuanian 4%
- Foreign-born
- 32% · Canada, Dominican Republic, Vietnam
- Languages at home
- 66% English-only · Other Indo-European 20% Spanish 7% Russian/Polish/Slavic 1%
Political lean MEDSL · Barnstable
- 2024 margin
- Strong D (+20.8) · D 59.6% · R 38.9% · Other 1.5%
- 2008→2024 swing
- +6.7pp toward D · 2008: 14.0pp · 2024: 20.8pp
- All cycles
- 2024: D+20.8 2020: D+24.4 2016: D+13.4 2012: D+7.6 2008: D+14.0
Not yet ingested
- Civics
- —
Market trends
- HPI YoY
- ▼ -128.47%
- Current HPI
- 383.3481
- Rent YoY
- —
- Metro
- Barnstable Town, MA
- State GDP YoY
- ▲ 2.28%
- F500 in state
- 38
Industry mix (Fortune 500 HQ in MA)
| Industry | F500 HQs | Revenue |
|---|---|---|
| Technology | 3 | $17B |
|
||
| Insurance | 2 | $84B |
|
||
| Retail | 2 | $76B |
|
||
| Life Sciences | 1 | $43B |
|
||
| Energy Technology | 1 | $31B |
|
||
| Aerospace / Defense | 1 | $18B |
|
||
Price history
+564.9% since first listed12 events — show timeline
- 2026-01-12 Listed $625,000 MLS PIN
- 2020-03-17 Listing Removed — CCIMLS
- 2020-03-17 Listing Removed — CCIMLS
- 2019-09-04 Listing Removed — CCIMLS
- 2018-01-31 Sold (MLS) $212,000 MLS PIN
- 2017-11-08 Pending — MLS PIN
- 2017-11-08 Listed $215,000 MLS PIN
- 2006-04-12 Listed $249,900 CCIMLS
- 2006-01-20 Listed $269,000 CCIMLS
- 2005-10-19 Sold (Public Records) $218,000 Public Records
- 2005-10-03 Listed $259,999 CCIMLS
- 1990-08-15 Sold (Public Records) $94,000 Public Records
Property tax history
+4.7%/yrLatest (2023): $2,639 · -15.3% YoY. Source: county tax records.
Cash-flow waterfall
monthlySold comps — $/sqft
last 12 mo · ≤1 miLoading sold comps…