625 Summit Pass Ln · Princeton, TX
Flood risk No data
- FEMA flood zone
- —
- Chance of flooding over 30 yrs
- —
- Est. flood insurance / yr
- —
Fire risk No data
- Est. fire insurance / yr
- —
Heat risk No data
- Hot days now (above threshold)
- —
- Hot days in 30 yrs
- —
Wind risk No data
- Chance of severe wind over 30 yrs
- —
Air-quality risk No data
- Unhealthy air days now
- —
- Unhealthy air days in 30 yrs
- —
Risk factors via First Street. Map © Google.
Why this score? — see what drove the C grade
The composite is a weighted blend of 9 inputs, each scored 0–100. Each bar is that input's sub-score; the figure is the points it added to the 100-point composite (weight × sub-score).
- Cash flow +18.0/30.0
- ARV discount +15.0/15.0
- 1% rule +6.3/10.0
- DSCR +5.6/10.0
- Schools +4.2/10.0
- Livability +3.1/5.0
- Rent growth +2.2/5.0
- Condition / age +2.2/5.0
- Appreciation +0.0/10.0
$183,890
🖨 Deal sheet 📄 Offer letter ✓ Due diligence
Listing remarks
This is 3 bedroom 2 bathroom property
Key facts
- 6,381 sq ft lot
- 2 garage spots
- Built 2022
Property features AI
Exterior
- Parking: Attached 2-car garage
- Utilities: Public water
- Home design: Residential property; Built in 2022; Slab foundation; Composition roof
- Construction: Brick and wood siding exterior
- Exterior features: Located in a subdivision
Interior
- Bedrooms: Primary bedroom on the first floor; Second bedroom on the first floor; Third bedroom on the first floor
- Bathrooms: 2 full bathrooms
- Heating & cooling: Central heating (electric); Central air conditioning (electric)
- Interior features: 3 total rooms
Neighborhood map
What this means for you Summary
Snapshot
- This is a 3-bed/2.0-bath single-family listed at $184k. Condition is rated fair.
Deal economics
- At list price, monthly cash flow is $157 ($2k/yr) — positive.
- The deal already cash-flows at list — no discount required.
- Meets the 1% rule at list price ($2k rent vs $184k).
- Recommended offer: $181k (1.5% below list) — sets the bar for market timing.
- Cap rate 7.3% vs local median 4.5% in Princeton — top-decile yield for the area; either an underpriced asset or a hidden risk that comps aren't pricing in. Stress-test before assuming the spread holds.
Location & tenants
- Location reads 62/100 on livability (#969 in TX) — a middle-class / working-renter tenant base. Strengths: employment A+, housing A+, cost of living A; Watch: amenities F, commute F, health & safety F.
- Princeton ISD (suburban): math 51% / reading 47% proficiency, ranked #188 of 826 in TX (top 23%) — families likely to look elsewhere, expect single-tenant / working-renter base with shorter leases.
- Zoned schools: Harper El (math 50% / reading 41%, grade D-, #1,112 of 4,322 statewide, top 26%, 436 students, 56% FRL); Clark Middle (math 53% / reading 42%, grade C-, #408 of 1,662 statewide, top 25%, 707 students, 66% FRL); Princeton H S (math 52% / reading 54%, grade C-, #437 of 1,632 statewide, top 27%, 1,521 students, 57% FRL) — zoned schools at 60% FRL track the district average.
- Market conditions: Rents soft (-1.0%/yr); 1404 active listings in the ZIP; 39 comparable units currently listed for rent nearby; rentals at typical pace (median 25d on market — plan ~3-4 weeks tenant-placement turnaround); solid renter incomes; 19,194 units permitted in Collin County in 2024 (3,988 in 5+ unit buildings).
Forward outlook
- Local home prices are declining (-3.0%/yr); year-one equity from $1k of loan paydown is wiped out by about $6k of value loss. Plan a longer hold.
- Collin County population projected at +60% by 2050 — long-run rental-demand tailwind backs the buy-and-hold thesis.
Negotiation context
- It's been on market 27 days — a 2% lower offer ($181k) is reasonable based on typical stale-listing flexibility.
- 2 sale attempts with the ask held roughly flat each time — persistent listings suggest the price (not the market) is what's stuck; bring a comps-based counter.
Risks & watch-outs
- Watch-outs: property tax is 2.9% of price.
Questions for the listing agent
- Have any recent inspections been done? Can we get a copy of the seller's disclosures and any deferred-maintenance estimates?
- Property tax is high relative to price — has the assessment been appealed recently, and will the sale trigger a re-assessment?
- Is there a deadline driving the sale (1031 exchange, divorce, estate, relocation)? That informs how much negotiation room exists.
- What's the average days-on-market for RENTAL listings here right now (not sales)? A rising rental-DOM trend means longer vacancies and softer asking-rent achievability than the comps imply.
- What's the recent tenant-quality profile in this submarket — average credit score on applications, eviction rate, late-payment / NSF rate, and stable-employment percentage? A property-management company in the area should have these aggregated.
- How much new for-sale + rental construction is in the pipeline within 1–3 miles? Heavy new supply typically softens prices + rents 12–24 months out; constrained supply supports both.
Investment metrics
- 1% rule
- 1.13% ✓
- Cap rate
- 7.31%
- Cash-on-cash
- 3.65%
- DSCR
- 1.16
- GRM
- 7.4
CMA / ARV
- ARV (median comp)
- $311,097
- List price
- $183,890
- Delta
- -40.89%
- Verdict
- UNDERPRICED
- Comps
- 20 within 1.0 mi
Show comp detail 12 sales within ~0.75 mi
| Address | Dist | Beds/Ba | Sqft | Sold | Price | $/sf | Match |
|---|---|---|---|---|---|---|---|
| 719 Stampede Ln | 0.32mi | 3/2.0 | 1,454 (0%) | 2mo | $295,000 | $203 | 84 |
| 1002 Dry Gulch Way | 0.68mi | 3/2.0 | 1,454 (0%) | 2mo | $265,000 | $182 | 66 |
| 624 Willow View Way | 0.24mi | 3/2.0 | 1,643 (+13%) | 1mo | $295,000 | $180 | 66 |
| 702 Stampede Ln | 0.34mi | 4/2.0 (+1) | 1,592 (+10%) | 2mo | $298,900 | $188 | 62 |
| 405 Saddle Club Way | 0.66mi | 3/2.0 | 1,536 (+6%) | 0mo | $275,000 | $179 | 59 |
| 701 Gallop Dr | 0.62mi | 3/2.0 | 1,536 (+6%) | 4mo | $275,000 | $179 | 59 |
| 2206 Zephyr Dr | 0.59mi | 3/2.0 | 1,628 (+12%) | 1mo | $294,990 | $181 | 51 |
| 405 Rawhide Way | 0.61mi | 3/2.0 | 1,622 (+12%) | 4mo | $275,000 | $170 | 49 |
| 906 Honey Maple St | 0.63mi | 3/2.0 | 1,652 (+14%) | 1mo | $265,000 | $160 | 47 |
| 1220 Hopes Lake Dr | 0.75mi | 3/2.0 | 1,611 (+11%) | 1mo | $273,490 | $170 | 46 |
| 1213 Wolfcity Dr | 0.66mi | 3/2.0 | 1,647 (+13%) | 3mo | $304,490 | $185 | 45 |
| 408 Rawhide Way | 0.63mi | 4/2.0 (+1) | 1,664 (+14%) | 2mo | $275,000 | $165 | 40 |
Match score weights: distance 35% · size 25% · config 20% · recency 20%. Top-matched comps best support the ARV.
Projected returns pro-forma
-3.0% appreciation · 0.0% rent growth · sell at horizon
- IRR
- -14.5%
- Equity multiple
- 0.50×
- Total profit
- $-25,763
- Equity at exit
- $27,419
- IRR
- -12.7%
- Equity multiple
- 0.37×
- Total profit
- $-32,507
- Equity at exit
- $15,899
Cash invested: $51,489 (down + closing). Projections, not guarantees.
Landlord ↔ Tenant lean methodology
- Overall (STATE)
- 87 Strongly Landlord-Friendly
- State Texas
- 87 Strongly Landlord-Friendly · R+5
- County
- — inherits STATE
- City
- — inherits STATE
ZIP-level market 75407
- Home prices YoY
- -30.3%
- Rents YoY
- -1.0%
- Active inventory
- 1404
- Price-to-rent
- 7.4×
Monthly cashflow live
- Estimated rent
- $2,082 high interval (Pro) →
- Mortgage (P&I)
- −$964
- Tax from tax record
- −$448 /mo · $5,371/yr
- Insurance
- −$77
- HOA
- −$0
- Vacancy / Maint / Mgmt
- −$437
- Net cashflow
- $157
Break-even live
UW: 25.0% down · 7.5% · 30yr · 1.5% tax · 5.0% vac · 8.0% maint · 8.0% mgmt
Financing live
Cash to close
- Down payment
- $45,972
- Closing costs
- $5,517
- Reserves months
- —
- Total cash needed
- —
Loan-product check · same deal, 3 products live
Conventional
25% down · 7.5% · 30yr
- Down + closing
- —
- Monthly P&I
- —
- Monthly cashflow
- —
- DSCR
- —
- Eligible?
- —
Personal DTI + credit; lowest rate.
DSCR
20% down · 8.5% · 30yr
- Down + closing
- —
- Monthly P&I
- —
- Monthly cashflow
- —
- DSCR
- —
- Eligible?
- —
No personal income docs; deal must DSCR.
Hard money
10% down · 12.0% · 12mo
- Down + closing
- —
- Monthly P&I
- —
- Monthly cashflow
- —
- DSCR
- —
- Eligible?
- —
Short-term bridge; refi at stabilization.
Rent comps 39 comps
| Address | Beds | Baths | Sqft | Rent | $/sqft | DOM | Units | Dist |
|---|---|---|---|---|---|---|---|---|
| 627 Willow View Way Princeton, TX | 4.0 | 2.0 | 1664 | $2,000 | $1.20 | 43d | 1 | 0.17mi |
| 1412 Chestnut Cove Dr Princeton, TX | 3.0 | 2.0 | 1633 | $2,000 | $1.22 | 20d | 1 | 0.28mi |
| 513 Spur Rdg Princeton, TX | 3.0 | 2.0 | 1622 | $2,200 | $1.36 | 17d | 1 | 0.36mi |
| 603 Smokey Trl Princeton, TX | 3.0 | 2.0 | 1622 | $2,100 | $1.29 | 18d | 1 | 0.39mi |
| 1501 Hidden Bluff Xing Princeton, TX | 4.0 | 2.0 | 1794 | $2,200 | $1.23 | 12d | 1 | 0.40mi |
| 408 Stampede Ln Princeton, TX | 4.0 | 2.0 | 1794 | $1,925 | $1.07 | 43d | 1 | 0.40mi |
| 611 Saddle Club Way Princeton, TX | 4.0 | 2.0 | 1828 | $2,100 | $1.15 | 43d | 1 | 0.54mi |
| 604 Saddle Club Way Princeton, TX | 4.0 | 2.0 | 1592 | $2,050 | $1.29 | 43d | 1 | 0.57mi |
| 1006 Honey Maple St Princeton, TX | 4.0 | 2.0 | 1842 | $1,950 | $1.06 | 43d | 1 | 0.65mi |
| 1008 Honey Maple St Princeton, TX | 4.0 | 2.0 | 1825 | $1,995 | $1.09 | 24d | 1 | 0.66mi |
| 420 Gunsmoke Trl Princeton, TX | 4.0 | 2.0 | 1865 | $1,975 | $1.06 | 7d | 1 | 0.74mi |
| 2230 Currents Rd Princeton, TX | 3.0 | 2.0 | 1836 | $2,099 | $1.14 | 43d | 1 | 0.76mi |
| 2440 Limerick Dr Princeton, TX | 4.0 | 2.0 | 1783 | $1,998 | $1.12 | 24d | 1 | 0.80mi |
| 203 Marsh Ln Princeton, TX | 3.0 | 2.5 | 1586 | $1,575 | $0.99 | 7d | 1 | 1.01mi |
| 204 Marsh Ln Princeton, TX | 4.0 | 2.5 | 1722 | $1,700 | $0.99 | 43d | 1 | 1.02mi |
| 303 Stone Ct Princeton, TX | 3.0 | 2.5 | 1586 | $1,700 | $1.07 | 24d | 1 | 1.02mi |
| 315 Stone Ct Princeton, TX | 3.0 | 2.5 | 1573 | $2,100 | $1.34 | 43d | 1 | 1.04mi |
| 220 Marsh Ln Princeton, TX | 4.0 | 2.5 | 1722 | $1,785 | $1.04 | 5d | 1 | 1.05mi |
| 229 Marsh Ln Princeton, TX | 3.0 | 2.5 | 1550 | $1,650 | $1.06 | 24d | 1 | 1.06mi |
| 1525 Farm to Market Road 982 Princeton, TX | 2.0–4.0 | 2.0–2.5 | 1551 | $2,332 | $1.50 | 1d | 54 | 1.17mi |
| 905 Silverbell St Princeton, TX | 3.0 | 2.0 | 1445 | $1,850 | $1.28 | 18d | 1 | 1.27mi |
| 810 Silverbell St Princeton, TX | 3.0 | 2.0 | 1602 | $1,749 | $1.09 | 7d | 1 | 1.29mi |
| 815 Evergreen St Princeton, TX | 4.0 | 2.0 | 1835 | $1,999 | $1.09 | 43d | 1 | 1.31mi |
| 780 Evergreen St Princeton, TX | 4.0 | 2.0 | 1838 | $2,069 | $1.13 | 43d | 1 | 1.34mi |
| 843 Ozark Path Princeton, TX | 3.0 | 2.0 | 1249 | $2,100 | $1.68 | 43d | 1 | 1.35mi |
| 1208 Sequoia Ln Princeton, TX | 4.0 | 2.0 | 1828 | $2,000 | $1.09 | 43d | 1 | 1.36mi |
| 922 Evergreen St Princeton, TX | 4.0 | 2.0 | 1838 | $1,900 | $1.03 | 5d | 1 | 1.36mi |
| 865 Table Rock St Princeton, TX | 3.0 | 2.0 | 1563 | $2,050 | $1.31 | 22d | 1 | 1.37mi |
| 366 Lake Erie Dr Princeton, TX | 4.0 | 2.5 | 1824 | $1,990 | $1.09 | 24d | 1 | 1.37mi |
| 715 Mulberry Dr Princeton, TX | 3.0 | 2.0 | 1298 | $1,695 | $1.31 | 24d | 1 | 1.42mi |
| 803 Table Rock St Princeton, TX | 4.0 | 2.5 | 1683 | $1,850 | $1.10 | 43d | 1 | 1.42mi |
| 882 Breakwater Dr Princeton, TX | 4.0 | 2.5 | 1824 | $2,250 | $1.23 | 22d | 1 | 1.42mi |
| 605 Grenada Lake Dr Princeton, TX | 3.0 | 2.0 | 1563 | $1,925 | $1.23 | 15d | 1 | 1.43mi |
| 846 Breakwater Dr Princeton, TX | 3.0 | 2.5 | 1824 | $2,000 | $1.10 | 3d | 1 | 1.45mi |
| 409 Buckeye Ave Princeton, TX | 4.0 | 2.0 | 1726 | $1,850 | $1.07 | 43d | 1 | 1.46mi |
| 417 Sweet Shade Ln Princeton, TX | 4.0 | 2.0 | 1726 | $1,900 | $1.10 | 17d | 1 | 1.46mi |
| 414 Sweet Shade Ln Princeton, TX | 3.0 | 2.0 | 1700 | $1,900 | $1.12 | 43d | 1 | 1.46mi |
| 771 Bayonet St Princeton, TX | 3.0 | 2.0 | 1516 | $1,850 | $1.22 | 22d | 1 | 1.49mi |
| 120 Spurgeon St Princeton, TX | 3.0 | 2.0 | 1608 | $1,599 | $0.99 | 15d | 1 | 1.49mi |
Listing history 16 events
-
2026-06-13statusdays on market $183,890 Pending 27 DOM
-
2026-06-09days on market $183,890 Active 26 DOM
-
2026-06-08days on market $183,890 Active 25 DOM
-
2026-06-07days on market $183,890 Active 24 DOM
-
2026-06-04days on market $183,890 Active 21 DOM
-
2026-06-03days on market $183,890 Active 20 DOM
-
2026-06-02days on market $183,890 Active 19 DOM
-
2026-06-01days on market $183,890 Active 18 DOM
-
2026-05-31days on market $183,890 Active 17 DOM
-
2026-05-14$183,890 Active 37-char remark
-
2026-03-26historical
-
2025-06-30price $291,000
-
2025-05-10price $285,000
-
2025-04-06price $305,000
-
2025-03-22price $315,000
-
2025-03-21$310,000 Active
ⓘ Source: listings_history table (triggers on properties + properties_extension) + one-shot
backfill from property_details.listing_events for pre-trigger history.
Tax reassessment forecast TX · Resets to sale price
- Current annual tax
- $5,371 · $448/mo
- Projected year-2 tax
- $5,371 · $448/mo
- Expected delta
- $0/yr ($0/mo · 0.0%)
ⓘ Screening estimate from a state-policy table — verify with the county assessor before closing.
Nearby sold comps map
Loading sold comps map…
Walkable amenities ~0.75 mi
Loading nearby amenities…
Taxation est. · year 1
- Rental income
- $24,990
- − Mortgage interest
- −$10,301
- − Property taxes
- −$5,371
- − Insurance
- −$919
- − Repairs & maintenance
- −$1,999
- − Management
- −$1,999
- − Depreciation
- −$5,350
- Taxable loss
- −$950
- Est. tax savings @ 24.0%
- +$228
- After-tax cash flow
- $2,107/yr
For passive investors: Depreciation is non-cash, so a rental often shows a tax loss while cash-flowing — sheltering income. Rental losses are passive: they offset passive income freely, and up to $25,000/yr can offset ordinary (W-2) income if you actively participate and your MAGI is under $100k (phasing out to $0 by $150k); unused losses carry forward. On sale, claimed depreciation is recaptured at up to 25%, and gains may owe capital-gains tax (a 1031 exchange can defer both). Figures are a year-1 estimate at your 24.0% rate — not tax advice; consult a CPA.
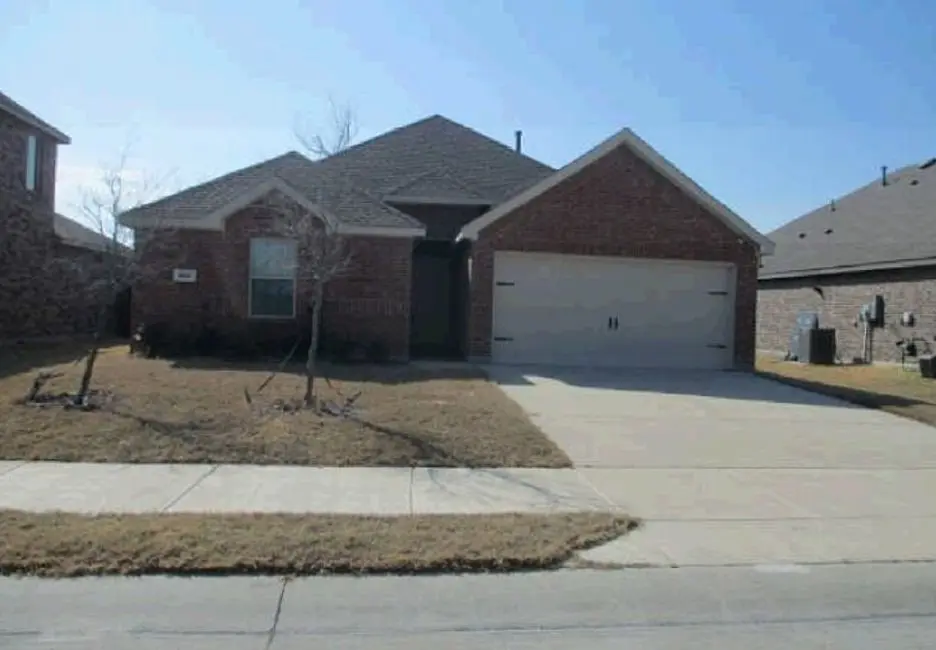
Condition & rehab AI · 1 photo
This single-family home requires moderate renovations, focusing on exterior repairs and maintenance to improve its resale and rental value.
Repairs flagged
- Major Brick siding — Significant weathering
- Major Roof shingles — Aged and likely to leak
Value-add opportunities
- Both Paint exterior walls — Enhances curb appeal and value
- Both Replace roof shingles — Prevents leaks and extends home's lifespan
- Both Repair brick siding — Improves home's appearance and value
Renovation cost estimate screening
| Repair item | Severity | Est. cost |
|---|---|---|
| Brick siding · Significant weathering | Major | $15,000–50,000 |
| Roof shingles · Aged and likely to leak | Major | $15,000–50,000 |
| Total estimated repair cost · 2 items | $30,000–100,000 |
Value-add ROI direction
- Both Paint exterior walls — Enhances curb appeal and value ↑
- Both Replace roof shingles — Prevents leaks and extends home's lifespan ↑
- Both Repair brick siding — Improves home's appearance and value ↑
ⓘ Cost ranges are severity-bucket heuristics (US national rule-of-thumb). Get contractor quotes + a written scope before underwriting a rehab budget.
Schools (NCES district)
- District
- Princeton ISD
- NCES district ID
- 4835850
- Math proficiency
- 51% ▼ -8.00%
- Reading proficiency
- 47% ▬ 0.00%
- Median HH income
- $54,827
- Composite
- 42.44/100
- National rank
- #3226
- State rank
- #188 of 826 in TX
Livability — Princeton
- Score
- 62/100
- State rank
- #969
- US rank
- #17215
Category grades
Schools grade is shown separately in the Schools card above.
Census & demographics
- Census place
- Princeton, TX
- County
- Collin County · 1,159,394 people
- City population
- 34,171
- Metro
- Dallas-Fort Worth-Arlington, TX
- Population (ZIP)
- 34,171
- Household income
- $100,037
- Rent vs Own
- Severe rent burden
- 368.0
Population outlook (Collin County) Hauer SSP2
- Today (2025)
- 1,210,074 people
- By 2030
- 1,358,201 · +12.2%
- By 2040
- 1,654,061 · +36.7%
- By 2050
- 1,937,359 · +60.1%
- By 2075
- 2,567,039 · +112.1%
- By 2100
- 2,952,048 · +144.0%
Race, ethnicity, and origin ACS 2023
- Neighborhood character
- Diverse neighborhood (Simpson 0.66)
- Race & ethnicity
- White 47% Hispanic / Latino 30% Black 17% Two or more races 10% Asian 4% Native American 1%
- Hispanic origin (detail)
- Mexican 26%
- Common ancestry
- Lithuanian 2% Romanian 1% Russian 1%
- Foreign-born
- 15% · Canada, China, Mexico
- Languages at home
- 70% English-only · Spanish 22% Other Indo-European 2% Other Asian/Pacific 1%
Political lean MEDSL · Collin
- 2024 margin
- R (+11.1) · D 43.1% · R 54.3% · Other 2.6%
- 2008→2024 swing
- +14.4pp toward D · 2008: -25.6pp · 2024: -11.1pp
- All cycles
- 2024: R+11.1 2020: R+4.3 2016: R+17.0 2012: R+31.6 2008: R+25.6
Not yet ingested
- Civics
- —
Market trends
- HPI YoY
- ▼ -103.99%
- Current HPI
- 238.9373
- Rent YoY
- ▼ -1.02%
- Metro
- Dallas-Fort Worth-Arlington, TX
- State GDP YoY
- ▲ 3.95%
- F500 in state
- 110
Industry mix (Fortune 500 HQ in TX)
| Industry | F500 HQs | Revenue |
|---|---|---|
| Energy | 16 | $1,198B |
|
||
| Technology | 5 | $198B |
|
||
| Engineering / Construction | 4 | $72B |
|
||
| Energy Services | 3 | $60B |
|
||
| Utilities | 3 | $41B |
|
||
| Healthcare | 2 | $330B |
|
||
Price history
-40.7% since first listed8 events — show timeline
- 2026-06-10 Pending — HARMLS
- 2026-05-14 Listed $183,890 HARMLS
- 2026-03-26 Listing Removed — NTREIS
- 2025-06-30 Price Changed $291,000 NTREIS
- 2025-05-10 Price Changed $285,000 NTREIS
- 2025-04-06 Price Changed $305,000 NTREIS
- 2025-03-22 Price Changed $315,000 NTREIS
- 2025-03-21 Listed $310,000 NTREIS
Property tax history
+99.4%/yrLatest (2025): $5,371 · -2.7% YoY. Source: county tax records.
Cash-flow waterfall
monthlySold comps — $/sqft
last 12 mo · ≤1 miLoading sold comps…