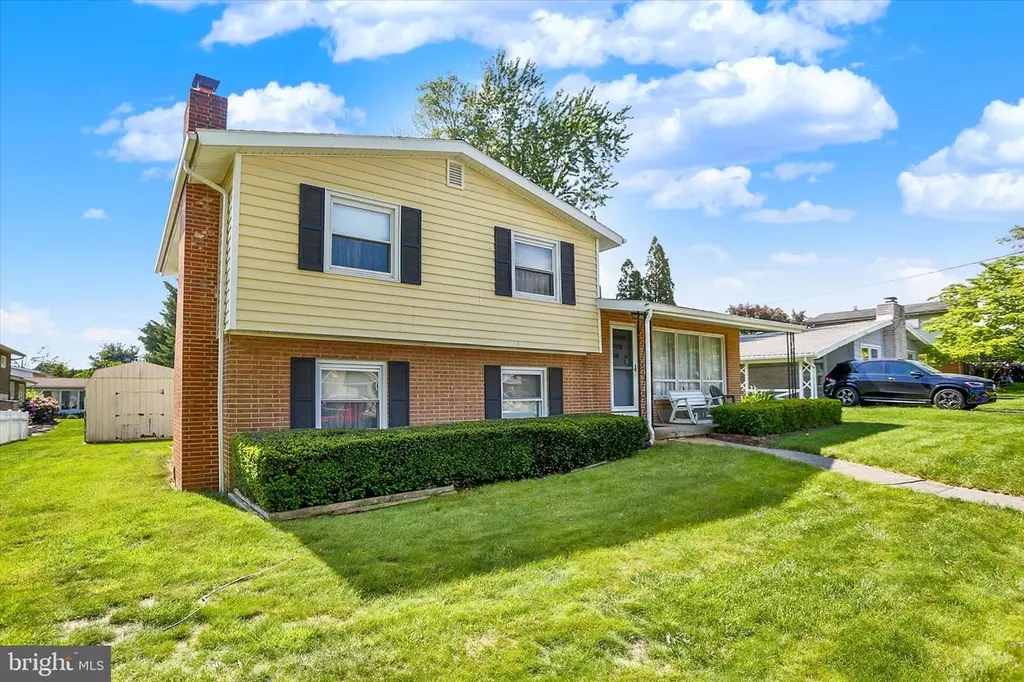
202 Wood St · Camp Hill, PA
Flood risk 1/10 · Minimal
- FEMA flood zone
- X (unshaded)
- Chance of flooding over 30 yrs
- 0.0%
- Est. flood insurance / yr
- $507 – $1,088
Fire risk 1/10 · Minimal
- Est. fire insurance / yr
- $511 – $949
Heat risk 5/10 · Moderate
- Hot days now (above 100°F)
- 7 days/yr
- Hot days in 30 yrs
- 15 days/yr
Wind risk 3/10 · Minor
- Chance of severe wind over 30 yrs
- 5.0%
Air-quality risk 3/10 · Minor
- Unhealthy air days now
- 2 days/yr
- Unhealthy air days in 30 yrs
- 4 days/yr
Risk factors via First Street. Map © Google.
Why this score? — see what drove the D+ grade
The composite is a weighted blend of 9 inputs, each scored 0–100. Each bar is that input's sub-score; the figure is the points it added to the 100-point composite (weight × sub-score).
- ARV discount +15.0/15.0
- Cash flow +9.9/30.0
- Schools +5.2/10.0
- Livability +4.7/5.0
- 1% rule +4.1/10.0
- Rent growth +4.0/5.0
- DSCR +2.8/10.0
- Condition / age +2.5/5.0
- Appreciation +0.0/10.0
$199,900
🖨 Deal sheet 📄 Offer letter ✓ Due diligence
Listing remarks
Amazing opportunity for an investor or a buyer with contracting experience to gain instant sweat equity. This home has an amazing floor plan with vaulted ceilings and a spacious kitchen. The homes contain 3 nicely sized bedrooms and 1 full and 2 half baths. There is enough room in the half bath in the lower level to convert it to a full bathroom. The lower level has a charming family room with a wood stove as well as an office or 4th bedroom. Just some TLC, and you have a great home.
Key facts
- 7,405 sq ft lot
- Built 1956
Neighborhood map
What this means for you Summary
Snapshot
- This is a 3-bed/2.0-bath single-family listed at $200k.
Deal economics
- At list price, monthly cash flow is $-126 ($-2k/yr) — negative.
- To cash-flow at today's rent, offer at most $178k (11.1% below list).
- To meet the 1% rule (rent ≥ 1% of price), the offer needs to be $181k (9.3% below list).
- Recommended offer: $178k (11.1% below list) — sets the bar for cash-flow.
- Cap rate 5.5% vs local median 2.9% in Camp Hill — top-decile yield for the area; either an underpriced asset or a hidden risk that comps aren't pricing in. Stress-test before assuming the spread holds.
Location & tenants
- Location reads 93/100 on livability (#5 in PA, #14 nationally) — a professional / high-income tenant draw. Strengths: crime A+, employment A+, housing A+.
- Camp Hill SD (suburban): math 49% / reading 70% proficiency, ranked #69 of 539 in PA (top 13%) — acceptable for families but not a draw, mixed tenant base, ~2y average lease; only 10% free/reduced lunch — higher-income household profile.
- Zoned schools: Camp Hill Shs (math 67%, 416 students, 14% FRL) — zoned schools at 14% FRL track the district average.
- Market conditions: Rents rising fast (+6.1%/yr); 148 active listings in the ZIP; 2 comparable units currently listed for rent nearby; solid renter incomes; 1,052 units permitted in Cumberland County in 2024 (310 in 5+ unit buildings).
Forward outlook
- Local home prices are declining (-3.0%/yr); year-one equity from $1k of loan paydown is wiped out by about $6k of value loss. Plan a longer hold.
- Cumberland County population projected at +17% by 2050 — long-run rental-demand tailwind backs the buy-and-hold thesis.
Negotiation context
- Only 0 days on market — expect competitive offers; lowballing is unlikely to land.
Risks & watch-outs
- Watch-outs: property tax is 2.6% of price; built in 1956 — expect roof / HVAC / electrical / plumbing capex.
- Climate carrying-cost: extreme-heat days projected 7→15/yr by 2055 (HVAC capex compounding) — expect insurance premiums to compound above CPI over the hold.
Questions for the listing agent
- What do current leases actually rent for vs. the listed asking? Can we see a recent rent roll and the last 12 months of T-12 income?
- Built in 1956 — when were the roof, HVAC, electrical panel, plumbing, and water heater last replaced?
- Property tax is high relative to price — has the assessment been appealed recently, and will the sale trigger a re-assessment?
- Is there a deadline driving the sale (1031 exchange, divorce, estate, relocation)? That informs how much negotiation room exists.
- Schools are A-rated — typically a magnet for longer-tenancy family renters. What's the average tenant stay here, and is there a school-zone premium baked into asking?
- The area grade is low — what's the realistic commute time and amenity access for the typical tenant pool here? Any planned neighborhood developments (good or bad) we should know about?
- What's the average days-on-market for RENTAL listings here right now (not sales)? A rising rental-DOM trend means longer vacancies and softer asking-rent achievability than the comps imply.
- What's the recent tenant-quality profile in this submarket — average credit score on applications, eviction rate, late-payment / NSF rate, and stable-employment percentage? A property-management company in the area should have these aggregated.
- How much new for-sale + rental construction is in the pipeline within 1–3 miles? Heavy new supply typically softens prices + rents 12–24 months out; constrained supply supports both.
Investment metrics
- 1% rule
- 0.91% ✗
- Cap rate
- 5.54%
- Cash-on-cash
- -2.70%
- DSCR
- 0.88
- GRM
- 9.2
CMA / ARV
- ARV (on-the-fly)
- $330,055
- Comps found
- 12
Show comp detail 12 sales within ~0.75 mi
| Address | Dist | Beds/Ba | Sqft | Sold | Price | $/sf | Match |
|---|---|---|---|---|---|---|---|
| 202 Wood St | 0.00mi | 3/2.0 | 1,765 (0%) | 0mo | $199,900 | $113 | 100 |
| 403 Penn Ayr Rd | 0.20mi | 3/2.0 | 1,717 (-3%) | 2mo | $350,000 | $204 | 85 |
| 3417 Walnut St | 0.20mi | 3/1.0 | 1,713 (-3%) | 2mo | $315,000 | $184 | 80 |
| 5 Round Hill Rd | 0.18mi | 3/1.5 | 1,665 (-6%) | 2mo | $310,000 | $186 | 78 |
| 514 Susan Rd | 0.36mi | 3/2.0 | 1,730 (-2%) | 6mo | $285,000 | $165 | 75 |
| 3407 Logan St | 0.10mi | 4/2.0 (+1) | 1,930 (+9%) | 1mo | $407,000 | $211 | 73 |
| 3468 Green St | 0.36mi | 3/2.0 | 1,869 (+6%) | 4mo | $279,900 | $150 | 70 |
| 3425 Logan St | 0.04mi | 4/2.5 (+1) | 2,005 (+14%) | 5mo | $375,000 | $187 | 64 |
| 370 Beverly Rd | 0.51mi | 4/2.0 (+1) | 1,931 (+9%) | 1mo | $355,000 | $184 | 54 |
| 3105 Harvard Ave | 0.72mi | 3/2.0 | 1,906 (+8%) | 0mo | $450,000 | $236 | 53 |
| 2702 Logan St | 0.66mi | 4/1.5 (+1) | 1,801 (+2%) | 8mo | $550,000 | $305 | 52 |
| 165 S 32nd St | 0.60mi | 2/1.0 (-1) | 1,520 (-14%) | 5mo | $300,000 | $197 | 36 |
Match score weights: distance 35% · size 25% · config 20% · recency 20%. Top-matched comps best support the ARV.
Projected returns pro-forma
-3.0% appreciation · 6.14% rent growth · sell at horizon
- IRR
- -16.8%
- Equity multiple
- 0.39×
- Total profit
- $-34,369
- Equity at exit
- $29,806
- IRR
- -3.2%
- Equity multiple
- 0.75×
- Total profit
- $-13,837
- Equity at exit
- $17,284
Cash invested: $55,972 (down + closing). Projections, not guarantees.
Landlord ↔ Tenant lean methodology
- Overall (STATE)
- 62 Landlord-Friendly
- State Pennsylvania
- 62 Landlord-Friendly · EVEN
- County
- — inherits STATE
- City
- — inherits STATE
ZIP-level market 17011
- Rents YoY
- 6.1%
- Active inventory
- 148
- Price-to-rent
- 9.2×
Monthly cashflow live
- Estimated rent
- $1,814 medium interval (Pro) →
- Mortgage (P&I)
- −$1,048
- Tax from tax record
- −$427 /mo · $5,125/yr
- Insurance
- −$83
- HOA
- −$0
- Vacancy / Maint / Mgmt
- −$381
- Net cashflow
- $-126
Break-even live
UW: 25.0% down · 7.5% · 30yr · 1.5% tax · 5.0% vac · 8.0% maint · 8.0% mgmt
Financing live
Cash to close
- Down payment
- $49,975
- Closing costs
- $5,997
- Reserves months
- —
- Total cash needed
- —
Loan-product check · same deal, 3 products live
Conventional
25% down · 7.5% · 30yr
- Down + closing
- —
- Monthly P&I
- —
- Monthly cashflow
- —
- DSCR
- —
- Eligible?
- —
Personal DTI + credit; lowest rate.
DSCR
20% down · 8.5% · 30yr
- Down + closing
- —
- Monthly P&I
- —
- Monthly cashflow
- —
- DSCR
- —
- Eligible?
- —
No personal income docs; deal must DSCR.
Hard money
10% down · 12.0% · 12mo
- Down + closing
- —
- Monthly P&I
- —
- Monthly cashflow
- —
- DSCR
- —
- Eligible?
- —
Short-term bridge; refi at stabilization.
Rent comps 2 comps
| Address | Beds | Baths | Sqft | Rent | $/sqft | DOM | Units | Dist |
|---|---|---|---|---|---|---|---|---|
| 121 November Dr Camp Hill, PA | 1.0–3.0 | 1.0–2.0 | 1076 | $1,745 | $1.62 | 14d | 32 | 0.75mi |
| 20 House Ave Camp Hill, PA | 2.0 | 2.0 | 1243 | $1,720 | $1.38 | 14d | 2 | 1.48mi |
Listing history 2 events
-
2026-05-21$199,900
-
2026-05-21historical
ⓘ Source: listings_history table (triggers on properties + properties_extension) + one-shot
backfill from property_details.listing_events for pre-trigger history.
Tax reassessment forecast PA · Partial reset (capped growth)
- Current annual tax
- $5,125 · $427/mo
- Projected year-2 tax
- $5,125 · $427/mo
- Expected delta
- $0/yr ($0/mo · 0.0%)
ⓘ Screening estimate from a state-policy table — verify with the county assessor before closing.
Climate risk First Street
- Flood 1/10 Low FEMA zone X (unshaded) · 0% chance over 30 yrs
- Wildfire 1/10 Low
- Heat 5/10 Major 7 d/yr ≥100°F today · 15 d/yr by 30 yrs out
- Wind 3/10 Moderate 5% chance of damaging wind over 30 yrs
- Air quality 3/10 Moderate 2 unhealthy d/yr today · 4 by 30 yrs out
Nearby sold comps map
Loading sold comps map…
Walkable amenities ~0.75 mi
Loading nearby amenities…
Taxation est. · year 1
- Rental income
- $21,763
- − Mortgage interest
- −$11,198
- − Property taxes
- −$5,125
- − Insurance
- −$1,000
- − Repairs & maintenance
- −$1,741
- − Management
- −$1,741
- − Depreciation
- −$5,815
- Taxable loss
- −$4,857
- Est. tax savings @ 24.0%
- +$1,166
- After-tax cash flow
- $-346/yr
For passive investors: Depreciation is non-cash, so a rental often shows a tax loss while cash-flowing — sheltering income. Rental losses are passive: they offset passive income freely, and up to $25,000/yr can offset ordinary (W-2) income if you actively participate and your MAGI is under $100k (phasing out to $0 by $150k); unused losses carry forward. On sale, claimed depreciation is recaptured at up to 25%, and gains may owe capital-gains tax (a 1031 exchange can defer both). Figures are a year-1 estimate at your 24.0% rate — not tax advice; consult a CPA.
Schools (NCES district)
- District
- Camp Hill SD
- NCES district ID
- 4204860
- Math proficiency
- 49% ▼ -14.00%
- Reading proficiency
- 70% ▼ -14.00%
- Median HH income
- $66,472
- Composite
- 52.15/100
- National rank
- #1614
- State rank
- #69 of 539 in PA
Livability — Camp Hill
- Score
- 93/100
- State rank
- #5
- US rank
- #14
Category grades
Schools grade is shown separately in the Schools card above.
Census & demographics
- Census place
- Camp Hill, PA
- County
- Cumberland County · 257,673 people
- City population
- 39,664
- Metro
- Harrisburg-Carlisle, PA
- Population (ZIP)
- 39,664
- Household income
- $92,556
- Rent vs Own
- Severe rent burden
- 858.0
Population outlook (Cumberland County) Hauer SSP2
- Today (2025)
- 267,950 people
- By 2030
- 278,105 · +3.8%
- By 2040
- 296,552 · +10.7%
- By 2050
- 312,937 · +16.8%
- By 2075
- 349,233 · +30.3%
- By 2100
- 361,875 · +35.1%
Race, ethnicity, and origin ACS 2023
- Neighborhood character
- Predominantly White (74%)
- Race & ethnicity
- White 74% Black 8% Hispanic / Latino 7% Two or more races 6% Asian 6%
- Hispanic origin (detail)
- Mexican 2% Puerto Rican 2%
- Common ancestry
- Italian 3% Romanian 3% Lithuanian 3%
- Foreign-born
- 9% · Canada, Vietnam, China
- Languages at home
- 88% English-only · Spanish 4% Other Asian/Pacific 2% Other Indo-European 1%
Political lean MEDSL · Cumberland
- 2024 margin
- Lean R (+9.4) · D 44.6% · R 54.1% · Other 1.3%
- 2008→2024 swing
- +4.2pp toward D · 2008: -13.6pp · 2024: -9.4pp
- All cycles
- 2024: R+9.4 2020: R+10.6 2016: R+18.6 2012: R+18.5 2008: R+13.6
Not yet ingested
- Civics
- —
Market trends
- HPI YoY
- ▼ -232.65%
- Current HPI
- 254.4755
- Rent YoY
- ▲ 6.14%
- Metro
- Harrisburg-Carlisle, PA
- State GDP YoY
- ▲ 1.68%
- F500 in state
- 34
Industry mix (Fortune 500 HQ in PA)
| Industry | F500 HQs | Revenue |
|---|---|---|
| Healthcare | 2 | $309B |
|
||
| Insurance | 2 | $27B |
|
||
| Telecommunications / Media | 1 | $124B |
|
||
| Industrial Distribution | 1 | $22B |
|
||
| Financial Services | 1 | $20B |
|
||
| Chemicals / Materials | 1 | $18B |
|
||
Price history
2 events — show timeline
- 2026-05-21 Listing Removed — BRIGHT MLS
- 2026-05-21 Listed $199,900 BRIGHT MLS
Property tax history
+3.1%/yrLatest (2026): $5,125 · +3.0% YoY. Source: county tax records.
Cash-flow waterfall
monthlySold comps — $/sqft
last 12 mo · ≤1 miLoading sold comps…