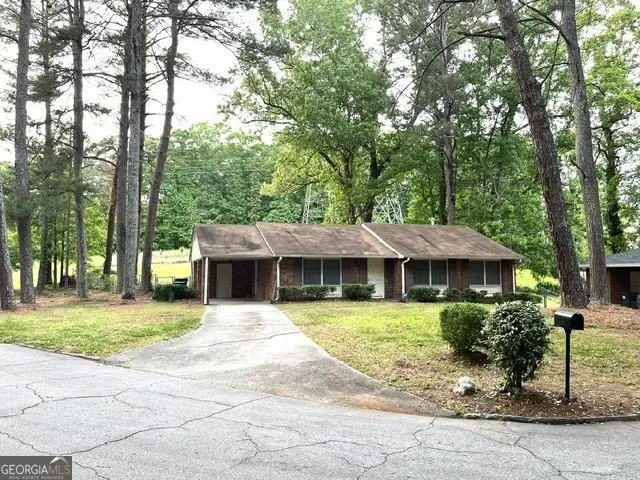
3201 Beech Dr · East Point, GA
Flood risk 1/10 · Minimal
- FEMA flood zone
- X (unshaded)
- Chance of flooding over 30 yrs
- 0.0%
- Est. flood insurance / yr
- $473 – $860
Fire risk 1/10 · Minimal
- Est. fire insurance / yr
- $963 – $1,789
Heat risk 5/10 · Moderate
- Hot days now (above 103°F)
- 7 days/yr
- Hot days in 30 yrs
- 18 days/yr
Wind risk 6/10 · Moderate
- Chance of severe wind over 30 yrs
- 27.0%
Air-quality risk 3/10 · Minor
- Unhealthy air days now
- 3 days/yr
- Unhealthy air days in 30 yrs
- 3 days/yr
Risk factors via First Street. Map © Google.
Why this score? — see what drove the C+ grade
The composite is a weighted blend of 9 inputs, each scored 0–100. Each bar is that input's sub-score; the figure is the points it added to the 100-point composite (weight × sub-score).
- Cash flow +19.9/30.0
- ARV discount +15.0/15.0
- DSCR +6.3/10.0
- 1% rule +5.3/10.0
- Schools +4.5/10.0
- Livability +3.6/5.0
- Rent growth +2.8/5.0
- Condition / age +2.5/5.0
- Appreciation +0.0/10.0
$190,000
🖨 Deal sheet 📄 Offer letter ✓ Due diligence
Listing remarks
Well built home with hardwood floors covered with carpet. Older stainless still appliances and granite countertops. Located near a park with tennis and basketball courts. Minutes to shopping, airport, expressways, downtown Atlanta. Large lot for gardening.
Key facts
- Large lot
- Granite countertops
- Hardwood floors
Tags
Property features AI
Finance
- Other: Located in East Point (zip 30344)
- HOA & community: No homeowners association; Community amenities include park, playground, street lights, and tennis courts
Exterior
- Parking: Attached carport
- Utilities: Public water; Public sewer; Electricity available; Natural gas available; Sewer connected
- Home design: Single family residence (house); Resale property; Built in 1957
- Construction: Brick construction
- Exterior features: Level lot; Composition roof
Interior
- Kitchen: Dishwasher; Refrigerator; Stainless steel appliances
- Bedrooms: 3 bedrooms on the main level
- Flooring: Carpet; Hardwood
- Bathrooms: 2 full bathrooms (both on main level)
- Heating & cooling: Central heating (natural gas); Central air conditioning
- Interior features: One-level layout; Bonus room; Crawl space foundation; Public records list living area as 1,886
- Laundry & utility: Laundry closet; Electric water heater
Neighborhood map
What this means for you Summary
Snapshot
- This is a 3-bed/2.5-bath single-family listed at $190k.
Deal economics
- At list price, monthly cash flow is $231 ($3k/yr) — positive.
- The deal already cash-flows at list — no discount required.
- Meets the 1% rule at list price ($2k rent vs $190k).
- Recommended offer: $187k (1.5% below list) — sets the bar for market timing.
- Cap rate 7.8% vs local median 5.1% in East Point — top-decile yield for the area; either an underpriced asset or a hidden risk that comps aren't pricing in. Stress-test before assuming the spread holds.
Location & tenants
- Location reads 72/100 on livability (#72 in GA) — a middle-class / working-renter tenant base. Strengths: commute A+, cost of living A+, housing A+; Watch: employment D+, crime F, amenities F.
- Fulton County (suburban): math 49% / reading 53% proficiency, ranked #12 of 174 in GA (top 7%) — acceptable for families but not a draw, mixed tenant base, ~2y average lease.
- Zoned schools: Woodland Middle School (math 14% / reading 17%, grade F, #392 of 470 statewide, top 84%, 799 students, 100% FRL); Tri-Cities High School (math 5% / reading 30%, grade F, #264 of 424 statewide, top 63%, 1,483 students, 100% FRL) — zoned schools average 100% FRL vs 41% district-wide (59 pts higher); higher-poverty schools than district average — tighter screening recommended.
- Zoned-school proficiency averages 16% at this address vs 51% district-wide (-34 pts) — the specific schools serving this property underperform the Fulton County average; the district grade overstates school quality for this exact location.
- Market conditions: Rents rising (+1.4%/yr); 283 active listings in the ZIP; 33 comparable units currently listed for rent nearby; rentals at typical pace (median 24d on market — plan ~3-4 weeks tenant-placement turnaround); 45% of comp listings sitting > 30 days — soft ceiling on asking rent; 11,565 units permitted in Fulton County in 2024 (8,159 in 5+ unit buildings).
- This rent runs 34% of the median local income ($68k/yr) — at the standard rent-burdened threshold; future hikes will face affordability resistance.
Forward outlook
- Local home prices are declining (-3.0%/yr); year-one equity from $1k of loan paydown is wiped out by about $6k of value loss. Plan a longer hold.
- Fulton County population projected at +38% by 2050 — long-run rental-demand tailwind backs the buy-and-hold thesis.
Negotiation context
- It's been on market 19 days — a 2% lower offer ($187k) is reasonable based on typical stale-listing flexibility.
- Current owner paid $46k; list at $190k implies a 313% gain — meaningful room to come down on a strong offer.
Risks & watch-outs
- Watch-outs: built in 1957 — expect roof / HVAC / electrical / plumbing capex.
- Climate carrying-cost: major wind risk, 27% chance of damaging wind over 30y; extreme-heat days projected 7→18/yr by 2055 (HVAC capex compounding) — expect insurance premiums to compound above CPI over the hold.
Questions for the listing agent
- Built in 1957 — when were the roof, HVAC, electrical panel, plumbing, and water heater last replaced?
- Is there a deadline driving the sale (1031 exchange, divorce, estate, relocation)? That informs how much negotiation room exists.
- Schools are F-rated, which usually means shorter tenancies and higher turnover. Who's the typical renter profile here, and what's been the actual vacancy rate?
- Crime grade is F in this area — have there been break-ins, vandalism, or insurance claims at this property in the last 3 years? What carrier currently insures it and at what premium?
- What's the average days-on-market for RENTAL listings here right now (not sales)? A rising rental-DOM trend means longer vacancies and softer asking-rent achievability than the comps imply.
- What's the recent tenant-quality profile in this submarket — average credit score on applications, eviction rate, late-payment / NSF rate, and stable-employment percentage? A property-management company in the area should have these aggregated.
- How much new for-sale + rental construction is in the pipeline within 1–3 miles? Heavy new supply typically softens prices + rents 12–24 months out; constrained supply supports both.
Investment metrics
- 1% rule
- 1.03% ✓
- Cap rate
- 7.75%
- Cash-on-cash
- 5.21%
- DSCR
- 1.23
- GRM
- 8.1
CMA / ARV
- ARV (median comp)
- $360,832
- List price
- $190,000
- Delta
- -47.34%
- Verdict
- UNDERPRICED
- Comps
- 20 within 1.0 mi
Show comp detail 5 sales within ~0.75 mi
| Address | Dist | Beds/Ba | Sqft | Sold | Price | $/sf | Match |
|---|---|---|---|---|---|---|---|
| 2511 Meadow Lark Dr | 0.36mi | 3/2.0 | 1,694 (-10%) | 9mo | $267,500 | $158 | 57 |
| 3384 Mount Olive Rd | 0.54mi | 3/2.0 | 1,780 (-6%) | 8mo | $217,000 | $122 | 57 |
| 3449 Parkview Dr | 0.49mi | 4/2.0 (+1) | 1,975 (+5%) | 11mo | $475,000 | $241 | 53 |
| 3244 Mount Olive Rd | 0.43mi | 3/2.0 | 1,632 (-14%) | 9mo | $368,000 | $225 | 48 |
| 3415 Rugby Cir | 0.50mi | 3/1.5 | 2,010 (+7%) | 22mo | $366,775 | $182 | 44 |
Match score weights: distance 35% · size 25% · config 20% · recency 20%. Top-matched comps best support the ARV.
Projected returns pro-forma
-3.0% appreciation · 1.35% rent growth · sell at horizon
- IRR
- -10.1%
- Equity multiple
- 0.64×
- Total profit
- $-19,252
- Equity at exit
- $28,330
- IRR
- -3.1%
- Equity multiple
- 0.80×
- Total profit
- $-10,389
- Equity at exit
- $16,428
Cash invested: $53,200 (down + closing). Projections, not guarantees.
Landlord ↔ Tenant lean methodology
- Overall (STATE)
- 90 Strongly Landlord-Friendly
- State Georgia
- 90 Strongly Landlord-Friendly · R+3
- County
- — inherits STATE
- City
- — inherits STATE
ZIP-level market 30344
- Home prices YoY
- -31.0%
- Rents YoY
- 1.4%
- Active inventory
- 283
- Price-to-rent
- 8.1×
Monthly cashflow live
- Estimated rent
- $1,954 high interval (Pro) →
- Mortgage (P&I)
- −$996
- Tax est. 1.5%
- −$238 /mo · $2,850/yr
- Insurance
- −$79
- HOA
- −$0
- Vacancy / Maint / Mgmt
- −$410
- Net cashflow
- $231
Break-even live
UW: 25.0% down · 7.5% · 30yr · 1.5% tax · 5.0% vac · 8.0% maint · 8.0% mgmt
Financing live
Cash to close
- Down payment
- $47,500
- Closing costs
- $5,700
- Reserves months
- —
- Total cash needed
- —
Loan-product check · same deal, 3 products live
Conventional
25% down · 7.5% · 30yr
- Down + closing
- —
- Monthly P&I
- —
- Monthly cashflow
- —
- DSCR
- —
- Eligible?
- —
Personal DTI + credit; lowest rate.
DSCR
20% down · 8.5% · 30yr
- Down + closing
- —
- Monthly P&I
- —
- Monthly cashflow
- —
- DSCR
- —
- Eligible?
- —
No personal income docs; deal must DSCR.
Hard money
10% down · 12.0% · 12mo
- Down + closing
- —
- Monthly P&I
- —
- Monthly cashflow
- —
- DSCR
- —
- Eligible?
- —
Short-term bridge; refi at stabilization.
Rent comps 33 comps
| Address | Beds | Baths | Sqft | Rent | $/sqft | DOM | Units | Dist |
|---|---|---|---|---|---|---|---|---|
| 3168 Beech Dr Atlanta, GA | 3.0 | 2.0 | 1402 | $1,500 | $1.07 | 43d | 1 | 0.11mi |
| 2420 Heaton Dr Atlanta, GA | 1.0–3.0 | 1.5–2.0 | 1103 | $1,750 | $1.59 | 43d | 1 | 0.25mi |
| 3031 Remington St Atlanta, GA | 3.0 | 2.0 | 1369 | $1,200 | $0.88 | 18d | 1 | 0.45mi |
| 2658 Rolling Brook Trl Atlanta, GA | 3.0 | 2.0 | 1754 | $1,850 | $1.05 | 43d | 1 | 0.53mi |
| 3211 Flamingo Dr Atlanta, GA | 3.0 | 2.0 | 1485 | $1,900 | $1.28 | 43d | 1 | 0.54mi |
| 3437 Harris Dr Atlanta, GA | 3.0 | 1.0 | 1556 | $1,650 | $1.06 | 43d | 1 | 0.64mi |
| 3184 Pollard St Atlanta, GA | 3.0 | 2.0 | 1400 | $1,800 | $1.29 | 43d | 1 | 0.65mi |
| 2145 Park Ter Atlanta, GA | 4.0 | 4.0 | 2500 | $3,100 | $1.24 | 5d | 1 | 0.77mi |
| 3447 Pierce St Atlanta, GA | 2.0 | 1.0 | 1560 | $1,345 | $0.86 | 43d | 1 | 0.82mi |
| 2523 Ben Hill Rd Atlanta, GA | 3.0 | 1.5 | 1412 | $3,000 | $2.12 | 21d | 1 | 0.89mi |
| 3483 Napoleon St Atlanta, GA | 3.0 | 2.0 | 1749 | $2,589 | $1.48 | 43d | 1 | 0.90mi |
| 2933 Cloverhurst Dr Atlanta, GA | 4.0 | 3.0 | 1550 | $2,500 | $1.61 | 20d | 1 | 1.00mi |
| 1962 Washington Rd Atlanta, GA | 4.0 | 2.0 | 2114 | $2,100 | $0.99 | 43d | 1 | 1.07mi |
| 1988 Virginia Ave Atlanta, GA | 4.0 | 2.0 | 1450 | $2,325 | $1.60 | 5d | 1 | 1.07mi |
| 1875 Dunlap Ave Atlanta, GA | 2.0 | 1.0 | 1650 | $1,875 | $1.14 | 43d | 1 | 1.14mi |
| 1861 Lyle Ave Unit 2 Atlanta, GA | 2.0 | 2.0 | 1250 | $1,600 | $1.28 | 43d | 1 | 1.16mi |
| 1863 Phillips Ave Atlanta, GA | 3.0 | 2.5 | 1470 | $2,115 | $1.44 | 10d | 1 | 1.17mi |
| 1845 Vesta Ave Atlanta, GA | 3.0 | 2.0 | 1581 | $2,128 | $1.35 | 24d | 1 | 1.21mi |
| 1827 Dunlap Ave Atlanta, GA | 3.0 | 2.0 | 1250 | $3,200 | $2.56 | 43d | 1 | 1.23mi |
| 3544 College St Atlanta, GA | 3.0 | 2.5 | 2000 | $2,650 | $1.32 | 1d | 1 | 1.27mi |
| 1809 Vesta Ave Atlanta, GA | 2.0 | 1.0 | 1768 | $2,900 | $1.64 | 43d | 1 | 1.28mi |
| 1804 Mercer Ave Atlanta, GA | 3.0 | 2.0 | 2250 | $2,600 | $1.16 | 43d | 1 | 1.29mi |
| 2801 Ridgeview Dr SW Atlanta, GA | 3.0 | 3.0 | 1588 | $2,500 | $1.57 | 18d | 1 | 1.30mi |
| 3181 Church St Unit A Atlanta, GA | 2.0 | 2.0 | 1646 | $1,750 | $1.06 | 21d | 1 | 1.30mi |
| 2514 Riggs Dr Atlanta, GA | 4.0 | 2.0 | 1274 | $2,000 | $1.57 | 43d | 1 | 1.31mi |
| 3122 Meadowstone Ln SW Atlanta, GA | 3.0 | 2.5 | 1336 | $2,540 | $1.90 | 24d | 1 | 1.32mi |
| 3122 Meadowstone Ln SW Atlanta, GA | 3.0 | 2.5 | 1336 | $2,440 | $1.83 | 17d | 1 | 1.32mi |
| 2886 Ridgeview Dr SW Atlanta, GA | 3.0 | 2.5 | 1792 | $2,175 | $1.21 | 2d | 1 | 1.34mi |
| 1755 Lyle Ave Atlanta, GA | 3.0 | 2.5 | 1973 | $2,600 | $1.32 | 18d | 1 | 1.36mi |
| 3181 Meadowstone Ln SW Atlanta, GA | 3.0 | 2.5 | 1536 | $2,300 | $1.50 | 18d | 1 | 1.40mi |
| 3181 Meadowstone Ln SW Atlanta, GA | 3.0 | 2.5 | 2184 | $2,200 | $1.01 | 7d | 1 | 1.40mi |
| 2609 Charlestown Dr Atlanta, GA | 2.0–3.0 | 1.5–2.5 | 1360 | $1,675 | $1.23 | 1d | 23 | 1.40mi |
| 1717 W Taylor Ave Atlanta, GA | 3.0 | 2.5 | 2100 | $1,791 | $0.85 | 12d | 1 | 1.48mi |
Listing history 4 events
-
2026-05-17status Under Contract 256-char remark
-
2026-04-28$190,000 New 256-char remark
-
1978-12-01soldstatus $46,000
-
1978-07-20soldstatus $50,780
ⓘ Source: listings_history table (triggers on properties + properties_extension) + one-shot
backfill from property_details.listing_events for pre-trigger history.
Climate risk First Street
- Flood 1/10 Low FEMA zone X (unshaded) · 0% chance over 30 yrs
- Wildfire 1/10 Low
- Heat 5/10 Major 7 d/yr ≥103°F today · 18 d/yr by 30 yrs out
- Wind 6/10 Major 27% chance of damaging wind over 30 yrs
- Air quality 3/10 Moderate 3 unhealthy d/yr today · 3 by 30 yrs out
Nearby sold comps map
Loading sold comps map…
Walkable amenities ~0.75 mi
Loading nearby amenities…
Taxation est. · year 1
- Rental income
- $23,451
- − Mortgage interest
- −$10,643
- − Property taxes
- −$2,850
- − Insurance
- −$950
- − Repairs & maintenance
- −$1,876
- − Management
- −$1,876
- − Depreciation
- −$5,527
- Taxable loss
- −$272
- Est. tax savings @ 24.0%
- +$65
- After-tax cash flow
- $2,835/yr
For passive investors: Depreciation is non-cash, so a rental often shows a tax loss while cash-flowing — sheltering income. Rental losses are passive: they offset passive income freely, and up to $25,000/yr can offset ordinary (W-2) income if you actively participate and your MAGI is under $100k (phasing out to $0 by $150k); unused losses carry forward. On sale, claimed depreciation is recaptured at up to 25%, and gains may owe capital-gains tax (a 1031 exchange can defer both). Figures are a year-1 estimate at your 24.0% rate — not tax advice; consult a CPA.
Schools (NCES district)
- District
- Fulton County
- NCES district ID
- 1302280
- Math proficiency
- 49% ▼ -2.00%
- Reading proficiency
- 53% ▬ 0.00%
- Median HH income
- $68,035
- Composite
- 45.33/100
- National rank
- #2640
- State rank
- #12 of 174 in GA
Livability — East Point
- Score
- 72/100
- State rank
- #72
- US rank
- #6314
Category grades
Schools grade is shown separately in the Schools card above.
Census & demographics
- Census place
- East Point, GA
- County
- Fulton County · 1,094,430 people
- City population
- 35,456
- Metro
- Atlanta-Sandy Springs-Alpharetta, GA
- Population (ZIP)
- 35,456
- Household income
- $68,380
- Rent vs Own
- Severe rent burden
- 2226.0
Population outlook (Fulton County) Hauer SSP2
- Today (2025)
- 1,203,707 people
- By 2030
- 1,299,706 · +8.0%
- By 2040
- 1,488,256 · +23.6%
- By 2050
- 1,664,580 · +38.3%
- By 2075
- 2,036,072 · +69.2%
- By 2100
- 2,222,402 · +84.6%
Race, ethnicity, and origin ACS 2023
- Neighborhood character
- Predominantly Black (74%)
- Race & ethnicity
- Black 74% White 11% Hispanic / Latino 11% Two or more races 6%
- Hispanic origin (detail)
- Mexican 7% Puerto Rican 1%
- Common ancestry
- Italian 1% Swiss 1% Russian 1%
- Foreign-born
- 6% · Canada, Jamaica
- Languages at home
- 87% English-only · Spanish 9% Other Indo-European 1% German/W. Germanic 1%
Political lean MEDSL · Fulton
- 2024 margin
- Solid D (+44.9) · D 71.9% · R 27.0% · Other 1.1%
- 2008→2024 swing
- +9.8pp toward D · 2008: 35.0pp · 2024: 44.9pp
- All cycles
- 2024: D+44.9 2020: D+46.4 2016: D+42.1 2012: D+29.6 2008: D+35.0
Not yet ingested
- Civics
- —
Market trends
- HPI YoY
- ▼ -113.15%
- Current HPI
- 251.7916
- Rent YoY
- ▲ 1.35%
- Metro
- Atlanta-Sandy Springs-Alpharetta, GA
- State GDP YoY
- ▲ 2.66%
- F500 in state
- 28
Industry mix (Fortune 500 HQ in GA)
| Industry | F500 HQs | Revenue |
|---|---|---|
| Paper / Packaging | 2 | $29B |
|
||
| Retail | 1 | $160B |
|
||
| Transportation / Logistics | 1 | $91B |
|
||
| Airlines | 1 | $62B |
|
||
| Consumer Goods | 1 | $47B |
|
||
| Utilities | 1 | $25B |
|
||
Price history
+274.2% since first listed4 events — show timeline
- 2026-05-17 Pending — GAMLS
- 2026-04-28 Listed $190,000 GAMLS
- 1978-12-01 Sold (Public Records) $46,000 Public Records
- 1978-07-20 Sold (Public Records) $50,780 Public Records
Property tax history
-5.8%/yrLatest (2025): $290 · +4.7% YoY. Source: county tax records.
Cash-flow waterfall
monthlySold comps — $/sqft
last 12 mo · ≤1 miLoading sold comps…