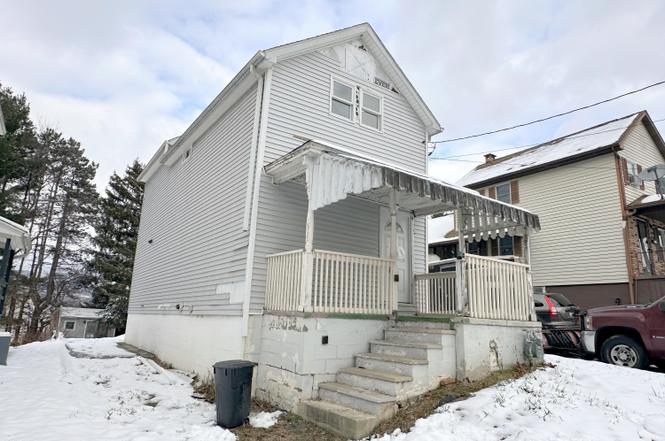
534 Second Ave · Jessup, PA
Flood risk 6/10 · Moderate
- FEMA flood zone
- X (unshaded)
- Chance of flooding over 30 yrs
- 0.72%
- Est. flood insurance / yr
- $473 – $860
Fire risk 1/10 · Minimal
- Est. fire insurance / yr
- $511 – $949
Heat risk 3/10 · Minor
- Hot days now (above 92°F)
- 8 days/yr
- Hot days in 30 yrs
- 18 days/yr
Wind risk 3/10 · Minor
- Chance of severe wind over 30 yrs
- 4.0%
Air-quality risk 2/10 · Minimal
- Unhealthy air days now
- 1 days/yr
- Unhealthy air days in 30 yrs
- 1 days/yr
Risk factors via First Street. Map © Google.
Why this score? — see what drove the C- grade
The composite is a weighted blend of 9 inputs, each scored 0–100. Each bar is that input's sub-score; the figure is the points it added to the 100-point composite (weight × sub-score).
- Cash flow +20.4/30.0
- ARV discount +9.9/15.0
- DSCR +6.5/10.0
- 1% rule +5.4/10.0
- Schools +3.9/10.0
- Livability +3.4/5.0
- Rent growth +2.5/5.0
- Condition / age +2.5/5.0
- Appreciation +0.0/10.0
$127,500
🖨 Deal sheet (PDF) 📄 Offer letter ✓ Due diligence
Listing remarks
2 STORY HOME, IT APPEARS TO HAVE BEEN REMODELED IN THE LAST FEW YEARS. INSULATION, DRYWALL, PLUMBING, 200 AMP SERVICE, HARDWOOD & TILE FLOORS, WOOD KITCHEN CABINETS WITH SELF CLOSING DRAWERS, ISLAND, JACUZZI TUB, FIRST FLOOR 1/2 BATH WITH A POCKET DOOR, CENTRAL AC, RINNAI ON DEMAND HOT WATER HEATER, SMALL PORCH RIGHT OFF THE MASTER BEDROOM, AND MUCHMORE. IT APPEARS THAT IT JUST NEEDS A FEW SMALL ITEMS, SUCH AS SOME EXTERIOR PAINTING, AND A FEW PIECES OF SIDING, ETC. . TO FINISH. ALL UTILITIES ARE ON AND FUNCTIONING! PERFECT FOR SOMONE TO MOVE IN AND FINISH THE EXTERIOR IN THE SPRING!!! THIS WILL BE A CASH, OR CONVENTIONAL LOAN SALE ONLY ! ''''''AGENTS, SEE PRIVATE REMARKS''''''All in
Key facts
- Remodeled
- Tile floors
- Self closing drawers
Tags
Neighborhood map
What this means for you Summary
Snapshot
- This is a 2-bed/1.5-bath single-family listed at $128k.
Deal economics
- At list price, monthly cash flow is $167 ($2k/yr) — positive.
- The deal already cash-flows at list — no discount required.
- Meets the 1% rule at list price ($1k rent vs $128k).
- Recommended offer: $120k (6.0% below list) — sets the bar for market timing.
Location & tenants
- Location reads 67/100 on livability (#988 in PA) — a middle-class / working-renter tenant base. Strengths: crime A+, cost of living A+, housing A+; Watch: amenities F, commute F, health & safety F.
- Valley View SD (rural): math 34% / reading 57% proficiency, ranked #269 of 539 in PA (top 50%) — families likely to look elsewhere, expect single-tenant / working-renter base with shorter leases.
- Zoned schools: Valley View Intrmd Sch (math 28% / reading 60%, grade F, #858 of 1,518 statewide, top 57%, 540 students, 34% FRL); Valley View Ms (math 8% / reading 52%, grade F, #382 of 512 statewide, top 75%, 563 students, 38% FRL); Valley View Hs (math 72%, 761 students, 25% FRL) — zoned schools at 32% FRL track the district average.
- Market conditions: 15 active listings in the ZIP; 3 comparable units currently listed for rent nearby; rentals at typical pace (median 15d on market — plan ~3-4 weeks tenant-placement turnaround); 251 units permitted in Lackawanna County in 2024 (0 in 5+ unit buildings).
Forward outlook
- Local home prices are declining (-3.0%/yr); year-one equity from $882 of loan paydown is wiped out by about $4k of value loss. Plan a longer hold.
- Lackawanna County population projected to shrink 4% by 2050 — rents likely to lag national; underwrite the cash flow, not the appreciation.
Negotiation context
- It's been on market 63 days — a 6% lower offer ($120k) is reasonable based on typical stale-listing flexibility.
- 3 sale attempts since 22y ago; this cycle's ask has dropped $12k (9%) from the opening price — seller is motivated, your offer sets the floor, not the list.
Risks & watch-outs
- Watch-outs: built in 1930 — expect roof / HVAC / electrical / plumbing capex.
- Climate carrying-cost: major flood risk — expect insurance premiums to compound above CPI over the hold.
Questions for the listing agent
- It's been on market 63 days. Have you received any prior offers? Is the seller open to a 6% concession, seller financing, or rate buy-down credit?
- Built in 1930 — when were the roof, HVAC, electrical panel, plumbing, and water heater last replaced?
- Why hasn't it sold? Are there any deal-killer items the seller is aware of (foundation, flood, title, zoning, code violations)?
- Is there a deadline driving the sale (1031 exchange, divorce, estate, relocation)? That informs how much negotiation room exists.
- Schools are D-rated, which usually means shorter tenancies and higher turnover. Who's the typical renter profile here, and what's been the actual vacancy rate?
- What's the average days-on-market for RENTAL listings here right now (not sales)? A rising rental-DOM trend means longer vacancies and softer asking-rent achievability than the comps imply.
- What's the recent tenant-quality profile in this submarket — average credit score on applications, eviction rate, late-payment / NSF rate, and stable-employment percentage? A property-management company in the area should have these aggregated.
- How much new for-sale + rental construction is in the pipeline within 1–3 miles? Heavy new supply typically softens prices + rents 12–24 months out; constrained supply supports both.
Investment metrics
- 1% rule
- 1.04% ✓
- Cap rate
- 7.86%
- Cash-on-cash
- 5.60%
- DSCR
- 1.25
- GRM
- 8.0
CMA / ARV
- ARV (on-the-fly)
- $134,680
- Comps found
- 7
Show comp detail 7 sales within ~0.75 mi
| Address | Dist | Beds/Ba | Sqft | Sold | Price | $/sf | Match |
|---|---|---|---|---|---|---|---|
| 522 1st Ave | 0.11mi | 2/1.0 | 829 (-9%) | 1mo | $180,000 | $217 | 77 |
| 130 Buttonwood St | 0.43mi | 2/1.0 | 867 (-5%) | 1mo | $154,500 | $178 | 69 |
| 343 Atlantic St | 0.28mi | 2/2.0 | 881 (-3%) | 18mo | $119,000 | $135 | 65 |
| 121 River St | 0.44mi | 2/1.0 | 908 (-0%) | 19mo | $105,000 | $116 | 62 |
| 313 Dolph St | 0.45mi | 2/1.0 | 1,010 (+11%) | 1mo | $149,900 | $148 | 58 |
| 100 Vass St | 0.54mi | 2/1.0 | 984 (+8%) | 3mo | $187,975 | $191 | 57 |
| 127 Olga St | 0.65mi | 2/1.0 | 1,000 (+10%) | 3mo | $89,900 | $90 | 48 |
Match score weights: distance 35% · size 25% · config 20% · recency 20%. Top-matched comps best support the ARV.
Projected returns pro-forma
-3.0% appreciation · 3.0% rent growth · sell at horizon
- IRR
- -7.6%
- Equity multiple
- 0.72×
- Total profit
- $-10,031
- Equity at exit
- $19,011
- IRR
- 2.0%
- Equity multiple
- 1.14×
- Total profit
- $5,008
- Equity at exit
- $11,024
Cash invested: $35,700 (down + closing). Projections, not guarantees.
Landlord ↔ Tenant lean methodology
- Overall (STATE)
- 62 Landlord-Friendly
- State Pennsylvania
- 62 Landlord-Friendly · EVEN
- County
- — inherits STATE
- City
- — inherits STATE
ZIP-level market 18434
- Home prices YoY
- -19.9%
- Active inventory
- 15
- Price-to-rent
- 8.0×
Monthly cashflow live
- Estimated rent
- $1,326 medium interval (Pro) →
- Mortgage (P&I)
- −$669
- Tax est. 1.5%
- −$159 /mo · $1,912/yr
- Insurance
- −$53
- HOA
- −$0
- Vacancy / Maint / Mgmt
- −$279
- Net cashflow
- $167
Break-even live
Sensitivity live
| Price | -10% $255 | -5% $211 | +0% $167 | +5% $123 | +10% $78 |
|---|---|---|---|---|---|
| Rent | -10% $62 | -5% $114 | +0% $167 | +5% $219 | +10% $271 |
| Rate | -1.0pp $231 | -0.5pp $199 | base $167 | +0.5pp $134 | +1.0pp $100 |
UW: 25.0% down · 7.5% · 30yr · 1.5% tax · 5.0% vac · 8.0% maint · 8.0% mgmt
Financing live
Cash to close
- Down payment
- $31,875
- Closing costs
- $3,825
- Reserves months
- —
- Total cash needed
- —
Loan-product check · same deal, 3 products live
Conventional
25% down · 7.5% · 30yr
- Down + closing
- —
- Monthly P&I
- —
- Monthly cashflow
- —
- DSCR
- —
- Eligible?
- —
Personal DTI + credit; lowest rate.
DSCR
20% down · 8.5% · 30yr
- Down + closing
- —
- Monthly P&I
- —
- Monthly cashflow
- —
- DSCR
- —
- Eligible?
- —
No personal income docs; deal must DSCR.
Hard money
10% down · 12.0% · 12mo
- Down + closing
- —
- Monthly P&I
- —
- Monthly cashflow
- —
- DSCR
- —
- Eligible?
- —
Short-term bridge; refi at stabilization.
Rent comps 3 comps
| Address | Beds | Baths | Sqft | Rent | $/sqft | DOM | Units | Dist |
|---|---|---|---|---|---|---|---|---|
| 101 Clarkson Ave Unit 2 Jessup, PA | 3.0 | 1.0 | 1000 | $1,500 | $1.50 | 15d | 1 | 0.64mi |
| 1017 Main St Unit 2 Peckville, PA | 1.0 | 1.0 | 700 | $1,050 | $1.50 | 15d | 1 | 0.94mi |
| 104 Adams Ave Apt 2 Olyphant, PA | 2.0 | 1.0 | 900 | $1,300 | $1.44 | 15d | 1 | 1.35mi |
Listing history 6 events
-
2026-02-19status Pending
-
2026-01-09price $127,500
-
2026-01-01status Active
-
2025-12-20status Pending
-
2025-12-05$139,900 Active
-
2004-06-05$48,000
ⓘ Source: listings_history table (triggers on properties + properties_extension) + one-shot
backfill from property_details.listing_events for pre-trigger history.
Climate risk First Street
- Flood 6/10 Major FEMA zone X (unshaded) · 72% chance over 30 yrs
- Wildfire 1/10 Low
- Heat 3/10 Moderate 8 d/yr ≥92°F today · 18 d/yr by 30 yrs out
- Wind 3/10 Moderate 4% chance of damaging wind over 30 yrs
- Air quality 2/10 Low 1 unhealthy d/yr today · 1 by 30 yrs out
Nearby sold comps map
Loading sold comps map…
Walkable amenities ~0.75 mi
Loading nearby amenities…
Taxation est. · year 1
- Rental income
- $15,915
- − Mortgage interest
- −$7,142
- − Property taxes
- −$1,912
- − Insurance
- −$638
- − Repairs & maintenance
- −$1,273
- − Management
- −$1,273
- − Depreciation
- −$3,709
- Taxable loss
- −$33
- Est. tax savings @ 24.0%
- +$8
- After-tax cash flow
- $2,007/yr
For passive investors: Depreciation is non-cash, so a rental often shows a tax loss while cash-flowing — sheltering income. Rental losses are passive: they offset passive income freely, and up to $25,000/yr can offset ordinary (W-2) income if you actively participate and your MAGI is under $100k (phasing out to $0 by $150k); unused losses carry forward. On sale, claimed depreciation is recaptured at up to 25%, and gains may owe capital-gains tax (a 1031 exchange can defer both). Figures are a year-1 estimate at your 24.0% rate — not tax advice; consult a CPA.
Schools (NCES district)
- District
- Valley View SD
- NCES district ID
- 4224650
- Math proficiency
- 34% ▼ -10.00%
- Reading proficiency
- 57% ▼ -12.00%
- Median HH income
- $45,562
- Composite
- 38.54/100
- National rank
- #4174
- State rank
- #269 of 539 in PA
Livability — Jessup
- Score
- 67/100
- State rank
- #988
- US rank
- #10864
Category grades
Schools grade is shown separately in the Schools card above.
Census & demographics
- Census place
- Jessup, PA
- City population
- 4,019
- Population (ZIP)
- 4,019
Population outlook (Lackawanna County) Hauer SSP2
- Today (2025)
- 210,652 people
- By 2030
- 208,623 · -1.0%
- By 2040
- 203,980 · -3.2%
- By 2050
- 201,069 · -4.5%
- By 2075
- 205,026 · -2.7%
- By 2100
- 210,851 · +0.1%
Race, ethnicity, and origin ACS 2023
- Neighborhood character
- Predominantly White (82%)
- Race & ethnicity
- White 82% Two or more races 16% Hispanic / Latino 10%
- Hispanic origin (detail)
- Puerto Rican 9%
- Common ancestry
- Romanian 23% Scotch-Irish 10% Dutch 2%
- Foreign-born
- 2% · Canada
- Languages at home
- 93% English-only · Spanish 5% Other Indo-European 2% Tagalog/Filipino 1%
Political lean MEDSL · Lackawanna
- 2024 margin
- Toss-up / Even · D 51.0% · R 48.3%
- 2008→2024 swing
- -23.2pp toward R · 2008: 26.0pp · 2024: 2.8pp
- All cycles
- 2024: D+2.8 2020: D+8.4 2016: D+3.4 2012: D+27.4 2008: D+26.0
Not yet ingested
- Civics
- —
Market trends
- HPI YoY
- ▼ -46.04%
- Current HPI
- 184.8942
- Rent YoY
- —
- Metro
- —
- State GDP YoY
- ▲ 1.68%
- F500 in state
- 34
Industry mix (Fortune 500 HQ in PA)
| Industry | F500 HQs | Revenue |
|---|---|---|
| Healthcare | 2 | $309B |
|
||
| Insurance | 2 | $27B |
|
||
| Telecommunications / Media | 1 | $124B |
|
||
| Industrial Distribution | 1 | $22B |
|
||
| Financial Services | 1 | $20B |
|
||
| Chemicals / Materials | 1 | $18B |
|
||
Price history
+165.6% since first listed6 events — show timeline
- 2026-02-19 Pending — GSBR as distributed by MLS GRID
- 2026-01-09 Price Changed $127,500 GSBR as distributed by MLS GRID
- 2026-01-01 Relisted — GSBR as distributed by MLS GRID
- 2025-12-20 Pending — GSBR as distributed by MLS GRID
- 2025-12-05 Listed $139,900 GSBR as distributed by MLS GRID
- 2004-06-05 Listed $48,000 GSBR as distributed by MLS GRID
Property tax history
+36.4%/yrLatest (2026): $36,789 · +2364.7% YoY. Source: county tax records.
Cash-flow waterfall
monthlySold comps — $/sqft
last 12 mo · ≤1 miLoading sold comps…