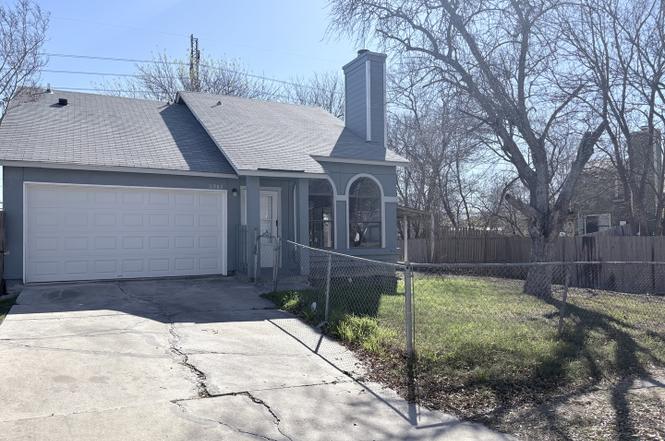
6002 Glacier Sun · San Antonio, TX
Flood risk 1/10 · Minimal
- FEMA flood zone
- X (unshaded)
- Chance of flooding over 30 yrs
- 0.0%
- Est. flood insurance / yr
- $507 – $1,088
Fire risk 4/10 · Minor
- Est. fire insurance / yr
- $1,222 – $2,270
Heat risk 8/10 · Major
- Hot days now (above 108°F)
- 7 days/yr
- Hot days in 30 yrs
- 22 days/yr
Wind risk 8/10 · Major
- Chance of severe wind over 30 yrs
- 80.0%
Air-quality risk 2/10 · Minimal
- Unhealthy air days now
- 0 days/yr
- Unhealthy air days in 30 yrs
- 1 days/yr
Risk factors via First Street. Map © Google.
Why this score? — see what drove the D+ grade
The composite is a weighted blend of 9 inputs, each scored 0–100. Each bar is that input's sub-score; the figure is the points it added to the 100-point composite (weight × sub-score).
- Cash flow +14.2/30.0
- ARV discount +11.0/15.0
- 1% rule +5.1/10.0
- DSCR +4.3/10.0
- Livability +4.0/5.0
- Rent growth +2.7/5.0
- Condition / age +2.5/5.0
- Schools +2.4/10.0
- Appreciation +0.0/10.0
$165,000
🖨 Deal sheet (PDF) 📄 Offer letter ✓ Due diligence
Listing remarks
This freshly updated home features 3 bedrooms, 2 bathrooms, and stylish laminate flooring throughout-no carpet! Enjoy a bright and spacious living room, a generous backyard perfect for entertaining or relaxing, and an oversized garage offering plenty of storage or workspace. Located in the desirable Sunrise area, this home combines comfort, functionality, and convenience.
Key facts
- Oversized garage
- Generous backyard
- 6,708 sq ft lot
Tags
Property features AI
Finance
- Other: Possession at closing/funding; For sale
- HOA & community: Located in the Sunrise subdivision
Exterior
- Parking: Attached 2-car garage
- Utilities: City water and sewer
- Home design: Pre-owned single-family property; Slab entry/foundation
- Construction: Approximately 41 years old; Composition roof; Slab foundation
- Exterior features: Stucco and siding exterior
Interior
- Kitchen: Eat-in kitchen; Solid countertops; Custom cabinets; Garbage disposal
- Bedrooms: Master bedroom with walk-in closet, ceiling fan, and full bath (10 x 14); Bedroom 2 (9 x 13); Bedroom 3 (9 x 13); All bedrooms located on the lower level
- Flooring: Laminate flooring
- Bathrooms: Two full bathrooms; Master bath with tub/shower combination and single vanity (7 x 10)
- Heating & cooling: Central heating (electric); Central air conditioning
- Interior features: Ceiling fans; Disposal; Smoke alarm; Electric water heater; Solid countertops; Custom cabinets; City garbage service; Open floor plan; Cable TV available; High-speed internet; Telephone
- Laundry & utility: Washer connection; Dryer connection; Utility room inside; Laundry room on main level
Neighborhood map
What this means for you Summary
Snapshot
- This is a 4-bed/2.0-bath single-family listed at $165k.
Deal economics
- At list price, monthly cash flow is $27 ($322/yr) — positive.
- The deal already cash-flows at list — no discount required.
- Meets the 1% rule at list price ($2k rent vs $165k).
- Recommended offer: $150k (9.0% below list) — sets the bar for market timing.
- Cap rate 6.5% vs local median 3.8% in San Antonio — top-decile yield for the area; either an underpriced asset or a hidden risk that comps aren't pricing in. Stress-test before assuming the spread holds.
Location & tenants
- Location reads 80/100 on livability (#31 in TX, #1,616 nationally) — a professional / high-income tenant draw. Strengths: amenities A+, commute A+, cost of living A+; Watch: crime F.
- Judson ISD (suburban): math 21% / reading 33% proficiency, ranked #660 of 826 in TX (top 80%) — low school quality limits family demand, transient renter base, plan for 1-2y turnover.
- Zoned schools: Candlewood El (math 12% / reading 22%, grade F, #3,836 of 4,322 statewide, top 91%, 519 students, 90% FRL); Henry Metzger Middle (math 12% / reading 20%, grade F, #1,543 of 1,662 statewide, top 94%, 953 students, 90% FRL); Karen Wagner H S (math 12% / reading 29%, grade F, #1,389 of 1,632 statewide, top 86%, 2,366 students, 80% FRL) — zoned schools average 86% FRL vs 57% district-wide (30 pts higher); higher-poverty schools than district average — tighter screening recommended.
- Market conditions: Rents flat; 193 active listings in the ZIP; 40 comparable units currently listed for rent nearby; rentals at typical pace (median 26d on market — plan ~3-4 weeks tenant-placement turnaround); 8,308 units permitted in Bexar County in 2024 (2,506 in 5+ unit buildings).
Forward outlook
- Local home prices are declining (-3.0%/yr); year-one equity from $1k of loan paydown is wiped out by about $5k of value loss. Plan a longer hold.
- Bexar County population projected at +50% by 2050 — long-run rental-demand tailwind backs the buy-and-hold thesis.
Negotiation context
- It's been on market 92 days — a 9% lower offer ($150k) is reasonable based on typical stale-listing flexibility.
Risks & watch-outs
- Watch-outs: property tax is 2.5% of price.
- Climate carrying-cost: severe wind risk, 80% chance of damaging wind over 30y; extreme-heat days projected 7→22/yr by 2055 (HVAC capex compounding) — expect insurance premiums to compound above CPI over the hold.
Questions for the listing agent
- It's been on market 92 days. Have you received any prior offers? Is the seller open to a 9% concession, seller financing, or rate buy-down credit?
- Property tax is high relative to price — has the assessment been appealed recently, and will the sale trigger a re-assessment?
- Why hasn't it sold? Are there any deal-killer items the seller is aware of (foundation, flood, title, zoning, code violations)?
- Is there a deadline driving the sale (1031 exchange, divorce, estate, relocation)? That informs how much negotiation room exists.
- Crime grade is F in this area — have there been break-ins, vandalism, or insurance claims at this property in the last 3 years? What carrier currently insures it and at what premium?
- The area grade is low — what's the realistic commute time and amenity access for the typical tenant pool here? Any planned neighborhood developments (good or bad) we should know about?
- What's the average days-on-market for RENTAL listings here right now (not sales)? A rising rental-DOM trend means longer vacancies and softer asking-rent achievability than the comps imply.
- What's the recent tenant-quality profile in this submarket — average credit score on applications, eviction rate, late-payment / NSF rate, and stable-employment percentage? A property-management company in the area should have these aggregated.
- How much new for-sale + rental construction is in the pipeline within 1–3 miles? Heavy new supply typically softens prices + rents 12–24 months out; constrained supply supports both.
Investment metrics
- 1% rule
- 1.01% ✓
- Cap rate
- 6.49%
- Cash-on-cash
- 0.70%
- DSCR
- 1.03
- GRM
- 8.3
CMA / ARV
- ARV (on-the-fly)
- $178,752
- Comps found
- 12
Show comp detail 12 sales within ~0.75 mi
| Address | Dist | Beds/Ba | Sqft | Sold | Price | $/sf | Match |
|---|---|---|---|---|---|---|---|
| 6002 Glacier Sun | 0.00mi | 3/2.0 (-1) | 1,344 (0%) | 1mo | $165,000 | $123 | 94 |
| 3717 Candleknoll Cir | 0.27mi | 3/2.0 (-1) | 1,265 (-6%) | 2mo | $188,000 | $149 | 70 |
| 3842 Candleglenn | 0.09mi | 3/2.5 (-1) | 1,501 (+12%) | 0mo | $155,000 | $103 | 69 |
| 5807 Summer Fest | 0.64mi | 4/2.0 | 1,352 (+1%) | 2mo | $180,000 | $133 | 67 |
| 3717 Candlecreek Ct | 0.22mi | 3/2.5 (-1) | 1,501 (+12%) | 0mo | $199,999 | $133 | 63 |
| 6143 Lyndell Spgs | 0.28mi | 3/2.5 (-1) | 1,501 (+12%) | 1mo | $208,000 | $139 | 60 |
| 6508 Buffalo Rnch | 0.75mi | 3/2.0 (-1) | 1,360 (+1%) | 1mo | $140,000 | $103 | 57 |
| 3519 Candlehead Ln | 0.57mi | 4/2.0 | 1,224 (-9%) | 2mo | $195,000 | $159 | 57 |
| 4106 Alaskian Sunrise | 0.26mi | 3/1.0 (-1) | 1,153 (-14%) | 2mo | $110,000 | $95 | 54 |
| 6011 Meadow Sunrise Dr | 0.51mi | 3/2.0 (-1) | 1,521 (+13%) | 1mo | $150,000 | $99 | 48 |
| 4738 Georges Farm | 0.69mi | 3/2.0 (-1) | 1,471 (+9%) | 1mo | $199,500 | $136 | 46 |
| 4727 Gavlick Farm | 0.66mi | 3/2.0 (-1) | 1,189 (-12%) | 2mo | $119,950 | $101 | 44 |
Match score weights: distance 35% · size 25% · config 20% · recency 20%. Top-matched comps best support the ARV.
Projected returns pro-forma
-3.0% appreciation · 0.75% rent growth · sell at horizon
- IRR
- -18.0%
- Equity multiple
- 0.38×
- Total profit
- $-28,585
- Equity at exit
- $24,602
- IRR
- -15.9%
- Equity multiple
- 0.21×
- Total profit
- $-36,635
- Equity at exit
- $14,266
Cash invested: $46,200 (down + closing). Projections, not guarantees.
Landlord ↔ Tenant lean methodology
- Overall (STATE)
- 87 Strongly Landlord-Friendly
- State Texas
- 87 Strongly Landlord-Friendly · R+5
- County
- — inherits STATE
- City
- — inherits STATE
ZIP-level market 78244
- Home prices YoY
- -4.4%
- Rents YoY
- 0.8%
- Active inventory
- 193
- Price-to-rent
- 8.3×
Monthly cashflow live
- Estimated rent
- $1,659 high interval (Pro) →
- Mortgage (P&I)
- −$865
- Tax from tax record
- −$349 /mo · $4,193/yr
- Insurance
- −$69
- HOA
- −$0
- Vacancy / Maint / Mgmt
- −$348
- Net cashflow
- $27
Break-even live
Sensitivity live
| Price | -10% $120 | -5% $74 | +0% $27 | +5% $-20 | +10% $-67 |
|---|---|---|---|---|---|
| Rent | -10% $-104 | -5% $-39 | +0% $27 | +5% $92 | +10% $158 |
| Rate | -1.0pp $110 | -0.5pp $69 | base $27 | +0.5pp $-16 | +1.0pp $-59 |
UW: 25.0% down · 7.5% · 30yr · 1.5% tax · 5.0% vac · 8.0% maint · 8.0% mgmt
Financing live
Cash to close
- Down payment
- $41,250
- Closing costs
- $4,950
- Reserves months
- —
- Total cash needed
- —
Loan-product check · same deal, 3 products live
Conventional
25% down · 7.5% · 30yr
- Down + closing
- —
- Monthly P&I
- —
- Monthly cashflow
- —
- DSCR
- —
- Eligible?
- —
Personal DTI + credit; lowest rate.
DSCR
20% down · 8.5% · 30yr
- Down + closing
- —
- Monthly P&I
- —
- Monthly cashflow
- —
- DSCR
- —
- Eligible?
- —
No personal income docs; deal must DSCR.
Hard money
10% down · 12.0% · 12mo
- Down + closing
- —
- Monthly P&I
- —
- Monthly cashflow
- —
- DSCR
- —
- Eligible?
- —
Short-term bridge; refi at stabilization.
Rent comps 40 comps
| Address | Beds | Baths | Sqft | Rent | $/sqft | DOM | Units | Dist |
|---|---|---|---|---|---|---|---|---|
| 4001 Colonial Sun Dr San Antonio, TX | 3.0 | 2.0 | 1344 | $1,400 | $1.04 | 0d | 1 | 0.07mi |
| 4001 Colonial Sun Dr San Antonio, TX | 3.0 | 2.0 | 1344 | $1,400 | $1.04 | 45d | 1 | 0.07mi |
| 6254 Eddie Way San Antonio, TX | 3.0 | 2.5 | 1225 | $1,375 | $1.12 | 45d | 1 | 0.11mi |
| 4014 Sunrise Creek Dr San Antonio, TX | 3.0 | 2.0 | 1100 | $1,600 | $1.45 | 45d | 1 | 0.11mi |
| 6230 Eddie Way San Antonio, TX | 3.0 | 2.5 | 1225 | $1,350 | $1.10 | 25d | 1 | 0.16mi |
| 6222 Eddie Way San Antonio, TX | 3.0 | 2.5 | 1225 | $1,350 | $1.10 | 25d | 1 | 0.18mi |
| 6222 Eddie Way Unit 2 San Antonio, TX | 3.0 | 2.5 | 1225 | $1,350 | $1.10 | 5d | 1 | 0.18mi |
| 6214 Eddie Way Unit 2 San Antonio, TX | 3.0 | 2.5 | 1225 | $1,600 | $1.31 | 23d | 1 | 0.19mi |
| 6214 Eddie Way San Antonio, TX | 3.0 | 2.5 | 1225 | $1,600 | $1.31 | 22d | 1 | 0.19mi |
| 3713 Candlebluff Dr San Antonio, TX | 3.0 | 2.5 | 1501 | $2,100 | $1.40 | 16d | 1 | 0.20mi |
| 6210 Eddie Way Unit 1 San Antonio, TX | 3.0 | 2.5 | 1225 | $1,350 | $1.10 | 45d | 1 | 0.20mi |
| 6210 Eddie Way Unit 1 San Antonio, TX | 3.0 | 2.5 | 1225 | $1,350 | $1.10 | 4d | 1 | 0.20mi |
| 6206 Eddie Way Unit 2 San Antonio, TX | 3.0 | 2.5 | 1225 | $1,350 | $1.10 | 4d | 1 | 0.21mi |
| 6206 Eddie Way Unit 2 San Antonio, TX | 3.0 | 2.5 | 1225 | $1,350 | $1.10 | 25d | 1 | 0.21mi |
| 3710 Candleglenn San Antonio, TX | 3.0 | 2.5 | 1582 | $1,650 | $1.04 | 5d | 1 | 0.22mi |
| 4047 Indian Sunrise San Antonio, TX | 3.0 | 1.0 | 1089 | $1,150 | $1.06 | 45d | 1 | 0.26mi |
| 4002 Fire Sun San Antonio, TX | 3.0 | 2.0 | 1004 | $1,800 | $1.79 | 25d | 1 | 0.27mi |
| 3633 Candlebrook Ln San Antonio, TX | 3.0 | 2.0 | 1621 | $1,495 | $0.92 | 25d | 1 | 0.27mi |
| 3327 Candlemoon Dr San Antonio, TX | 3.0 | 2.0 | 1344 | $1,550 | $1.15 | 45d | 1 | 0.28mi |
| 5840 Glacier Sun Dr San Antonio, TX | 3.0 | 2.0 | 1344 | $1,749 | $1.30 | 3d | 1 | 0.29mi |
| 4110 Alaskian Sunrise San Antonio, TX | 4.0 | 2.5 | 1360 | $1,200 | $0.88 | 0d | 1 | 0.31mi |
| 4111 Sunrise Terrace Dr San Antonio, TX | 4.0 | 2.0 | 1220 | $1,700 | $1.39 | 3d | 1 | 0.31mi |
| 4111 Sunrise Terrace Dr San Antonio, TX | 4.0 | 2.0 | 1220 | $1,800 | $1.48 | 45d | 1 | 0.31mi |
| 4122 Alaskian Sunrise San Antonio, TX | 3.0 | 2.0 | 1454 | $1,495 | $1.03 | 45d | 1 | 0.33mi |
| 4078 Enchanted Sun San Antonio, TX | 3.0 | 1.0 | 1056 | $1,250 | $1.18 | 25d | 1 | 0.35mi |
| 3603 Aranda Flds Converse, TX | 3.0 | 2.0 | 1346 | $1,650 | $1.23 | 45d | 1 | 0.41mi |
| 4123 Frontier Sun San Antonio, TX | 3.0 | 2.0 | 1086 | $1,350 | $1.24 | 45d | 1 | 0.42mi |
| 6231 Post Ml San Antonio, TX | 3.0 | 2.0 | 1447 | $1,495 | $1.03 | 25d | 1 | 0.43mi |
| 6231 Post Ml San Antonio, TX | 3.0 | 2.0 | 1447 | $1,495 | $1.03 | 22d | 1 | 0.43mi |
| 4102 Dakota Sun San Antonio, TX | 3.0 | 1.0 | 1202 | $1,350 | $1.12 | 45d | 1 | 0.43mi |
| 6402 Candleview Ct San Antonio, TX | 3.0 | 2.0 | 1319 | $1,499 | $1.14 | 6d | 1 | 0.43mi |
| 2726 Candleridge Dr San Antonio, TX | 3.0 | 2.0 | 1430 | $1,349 | $0.94 | 25d | 1 | 0.43mi |
| 3643 Cameron Spgs San Antonio, TX | 3.0 | 1.5 | 1501 | $1,180 | $0.79 | 4d | 1 | 0.44mi |
| 4066 Sunrise Pass San Antonio, TX | 3.0 | 2.0 | 977 | $1,550 | $1.59 | 6d | 1 | 0.45mi |
| 3511 Dunlap Flds Converse, TX | 3.0 | 2.0 | 1317 | $1,650 | $1.25 | 12d | 1 | 0.45mi |
| 6106 Candletree San Antonio, TX | 5.0 | 2.5 | 1633 | $2,600 | $1.59 | 0d | 1 | 0.46mi |
| 3669 Candlehead Ln San Antonio, TX | 3.0 | 2.5 | 1294 | $1,700 | $1.31 | 45d | 1 | 0.46mi |
| 4082 Sunrise Pass San Antonio, TX | 3.0 | 1.0 | 1125 | $1,285 | $1.14 | 0d | 1 | 0.47mi |
| 4162 Frontier Sun San Antonio, TX | 3.0 | 2.5 | 1246 | $1,400 | $1.12 | 45d | 1 | 0.47mi |
| 3422 Dunlap Flds Converse, TX | 3.0 | 2.0 | 1450 | $1,540 | $1.06 | 22d | 1 | 0.48mi |
Listing history 6 events
-
2026-04-29status Pending
-
2026-04-14historical Active Option
-
2026-01-27$165,000 New
-
2024-02-01soldstatus
-
1999-03-15soldstatus
-
1986-05-01soldstatus
ⓘ Source: listings_history table (triggers on properties + properties_extension) + one-shot
backfill from property_details.listing_events for pre-trigger history.
Tax reassessment forecast TX · Resets to sale price
- Current annual tax
- $4,193 · $349/mo
- Projected year-2 tax
- $4,193 · $349/mo
- Expected delta
- $0/yr ($0/mo · 0.0%)
ⓘ Screening estimate from a state-policy table — verify with the county assessor before closing.
Climate risk First Street
- Flood 1/10 Low FEMA zone X (unshaded) · 0% chance over 30 yrs
- Wildfire 4/10 Moderate
- Heat 8/10 Severe 7 d/yr ≥108°F today · 22 d/yr by 30 yrs out
- Wind 8/10 Severe 80% chance of damaging wind over 30 yrs
- Air quality 2/10 Low 0 unhealthy d/yr today · 1 by 30 yrs out
Nearby sold comps map
Loading sold comps map…
Walkable amenities ~0.75 mi
Loading nearby amenities…
Taxation est. · year 1
- Rental income
- $19,904
- − Mortgage interest
- −$9,243
- − Property taxes
- −$4,193
- − Insurance
- −$825
- − Repairs & maintenance
- −$1,592
- − Management
- −$1,592
- − Depreciation
- −$4,800
- Taxable loss
- −$2,342
- Est. tax savings @ 24.0%
- +$562
- After-tax cash flow
- $884/yr
For passive investors: Depreciation is non-cash, so a rental often shows a tax loss while cash-flowing — sheltering income. Rental losses are passive: they offset passive income freely, and up to $25,000/yr can offset ordinary (W-2) income if you actively participate and your MAGI is under $100k (phasing out to $0 by $150k); unused losses carry forward. On sale, claimed depreciation is recaptured at up to 25%, and gains may owe capital-gains tax (a 1031 exchange can defer both). Figures are a year-1 estimate at your 24.0% rate — not tax advice; consult a CPA.
Schools (NCES district)
- District
- Judson ISD
- NCES district ID
- 4824990
- Math proficiency
- 21% ▼ -21.00%
- Reading proficiency
- 33% ▼ -7.00%
- Median HH income
- $57,542
- Composite
- 24.39/100
- National rank
- #7689
- State rank
- #660 of 826 in TX
Livability — San Antonio
- Score
- 80/100
- State rank
- #31
- US rank
- #1616
Category grades
Schools grade is shown separately in the Schools card above.
Census & demographics
- Census place
- San Antonio, TX
- County
- Bexar County · 1,990,555 people
- City population
- 1,806,925
- Metro
- San Antonio-New Braunfels, TX
- Population (ZIP)
- 38,092
- Household income
- $71,128
- Rent vs Own
- Severe rent burden
- 677.0
Population outlook (Bexar County) Hauer SSP2
- Today (2025)
- 2,336,851 people
- By 2030
- 2,560,728 · +9.6%
- By 2040
- 3,020,569 · +29.3%
- By 2050
- 3,493,522 · +49.5%
- By 2075
- 4,668,459 · +99.8%
- By 2100
- 5,533,242 · +136.8%
Race, ethnicity, and origin ACS 2023
- Neighborhood character
- Diverse neighborhood (Simpson 0.68)
- Race & ethnicity
- Hispanic / Latino 46% Black 27% Two or more races 24% White 20% Asian 2%
- Hispanic origin (detail)
- Mexican 38% Puerto Rican 2% Cuban 2%
- Common ancestry
- Slovak 2% Lithuanian 1% Italian 1%
- Foreign-born
- 14% · Canada, Vietnam
- Languages at home
- 68% English-only · Spanish 28% Vietnamese 1% Tagalog/Filipino 1%
Political lean MEDSL · Bexar
- 2024 margin
- Lean D (+9.8) · D 54.3% · R 44.6% · Other 1.1%
- 2008→2024 swing
- +4.2pp toward D · 2008: 5.6pp · 2024: 9.8pp
- All cycles
- 2024: D+9.8 2020: D+18.2 2016: D+13.5 2012: D+4.6 2008: D+5.6
Not yet ingested
- Civics
- —
Market trends
- HPI YoY
- ▼ -11.42%
- Current HPI
- 249.3834
- Rent YoY
- ▲ 0.75%
- Metro
- San Antonio-New Braunfels, TX
- State GDP YoY
- ▲ 3.95%
- F500 in state
- 110
Industry mix (Fortune 500 HQ in TX)
| Industry | F500 HQs | Revenue |
|---|---|---|
| Energy | 16 | $1,198B |
|
||
| Technology | 5 | $198B |
|
||
| Engineering / Construction | 4 | $72B |
|
||
| Energy Services | 3 | $60B |
|
||
| Utilities | 3 | $41B |
|
||
| Healthcare | 2 | $330B |
|
||
Price history
6 events — show timeline
- 2026-04-29 Pending — LERA
- 2026-04-14 Contingent — LERA
- 2026-01-27 Listed $165,000 LERA
- 2024-02-01 Sold (Public Records) — Public Records
- 1999-03-15 Sold (Public Records) — Public Records
- 1986-05-01 Sold (Public Records) — Public Records
Property tax history
+14.0%/yrLatest (2025): $4,193 · -1.7% YoY. Source: county tax records.
Cash-flow waterfall
monthlySold comps — $/sqft
last 12 mo · ≤1 miLoading sold comps…