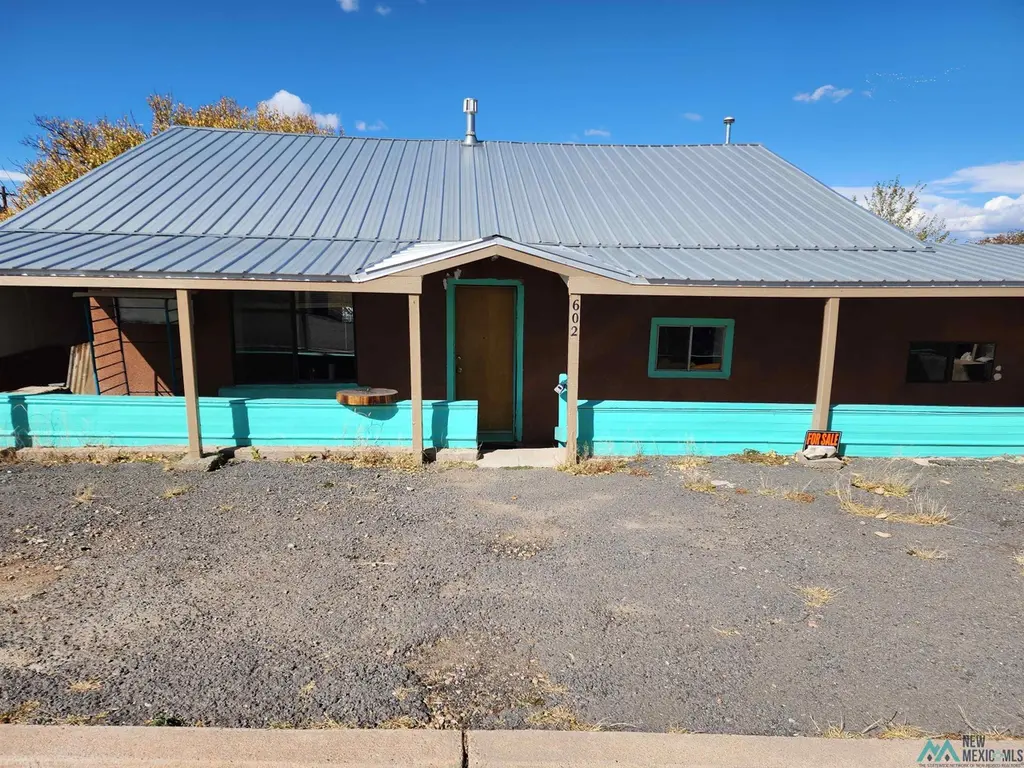
602 Stonewood Ave · Wagon Mound, NM
Flood risk No data
- FEMA flood zone
- —
- Chance of flooding over 30 yrs
- —
- Est. flood insurance / yr
- —
Fire risk No data
- Est. fire insurance / yr
- —
Heat risk No data
- Hot days now (above threshold)
- —
- Hot days in 30 yrs
- —
Wind risk No data
- Chance of severe wind over 30 yrs
- —
Air-quality risk No data
- Unhealthy air days now
- —
- Unhealthy air days in 30 yrs
- —
Risk factors via First Street. Map © Google.
Why this score? — see what drove the D+ grade
The composite is a weighted blend of 9 inputs, each scored 0–100. Each bar is that input's sub-score; the figure is the points it added to the 100-point composite (weight × sub-score).
- Cash flow +18.8/30.0
- ARV discount +7.5/15.0
- DSCR +5.9/10.0
- Appreciation +5.0/10.0
- 1% rule +3.8/10.0
- Livability +2.8/5.0
- Rent growth +2.5/5.0
- Condition / age +2.0/5.0
- Schools +1.3/10.0
$135,000
🖨 Deal sheet 📄 Offer letter ✓ Due diligence
Listing remarks MLS
Come see this lovely 3-bedroom, 1 bath home. Owner has completed a few upgrades and continues to improve.
Key facts
- Adobe home
- Santa fe trail views
- Two municipal lots
Tags
Neighborhood map
What this means for you Summary
Snapshot
- This is a 3-bed/1.0-bath single-family listed at $135k. Condition is rated fair.
Deal economics
- At list price, monthly cash flow is $136 ($2k/yr) — positive.
- The deal already cash-flows at list — no discount required.
- To meet the 1% rule (rent ≥ 1% of price), the offer needs to be $118k (12.4% below list).
- Recommended offer: $118k (12.4% below list) — sets the bar for 1% rule.
Location & tenants
- Location reads 55/100 on livability (#215 in NM) — a working-class tenant base; expect higher turnover. Strengths: cost of living A+, crime A; Watch: health & safety C-, schools F, amenities F.
- Wagon Mound Public Schools (rural): math 11% / reading 11% proficiency, ranked #86 of 95 in NM (top 90%) — low school quality limits family demand, transient renter base, plan for 1-2y turnover; 87% free/reduced lunch — lower-income household profile, screen leases tightly.
- Market conditions: 2 active listings in the ZIP.
Forward outlook
- In year one you build about $5k of equity ($933 loan paydown + $4k appreciation (3.0% local appreciation)).
- Mora County population projected at -38% by 2050 — secular population decline; favor cash flow + early exit over multi-decade hold.
- At projected returns (3.0% appreciation + 3.0% rent growth), your $38k cash investment doubles in ~5 years — after that, you're playing with house money.
- By year 7, paydown + projected appreciation supports a ~$32k cash-out refi (75% LTV) — recoverable capital for the next deal without selling this one.
Negotiation context
- It's been on market 590 days — a 12% lower offer ($119k) is reasonable based on typical stale-listing flexibility.
- 4 sale attempts since 5y ago with the ask held roughly flat each time — persistent listings suggest the price (not the market) is what's stuck; bring a comps-based counter.
Risks & watch-outs
- Watch-outs: built in 1950 — expect roof / HVAC / electrical / plumbing capex.
Questions for the listing agent
- It's been on market 590 days. Have you received any prior offers? Is the seller open to a 12% concession, seller financing, or rate buy-down credit?
- Have any recent inspections been done? Can we get a copy of the seller's disclosures and any deferred-maintenance estimates?
- Built in 1950 — when were the roof, HVAC, electrical panel, plumbing, and water heater last replaced?
- Why hasn't it sold? Are there any deal-killer items the seller is aware of (foundation, flood, title, zoning, code violations)?
- Is there a deadline driving the sale (1031 exchange, divorce, estate, relocation)? That informs how much negotiation room exists.
- Schools are F-rated, which usually means shorter tenancies and higher turnover. Who's the typical renter profile here, and what's been the actual vacancy rate?
- The area grade is low — what's the realistic commute time and amenity access for the typical tenant pool here? Any planned neighborhood developments (good or bad) we should know about?
- What's the average days-on-market for RENTAL listings here right now (not sales)? A rising rental-DOM trend means longer vacancies and softer asking-rent achievability than the comps imply.
- What's the recent tenant-quality profile in this submarket — average credit score on applications, eviction rate, late-payment / NSF rate, and stable-employment percentage? A property-management company in the area should have these aggregated.
- How much new for-sale + rental construction is in the pipeline within 1–3 miles? Heavy new supply typically softens prices + rents 12–24 months out; constrained supply supports both.
Investment metrics
- 1% rule
- 0.88% ✗
- Cap rate
- 7.50%
- Cash-on-cash
- 4.30%
- DSCR
- 1.19
- GRM
- 9.5
CMA / ARV
No comps found within radius.
Projected returns pro-forma
3.0% appreciation · 3.0% rent growth · sell at horizon
- IRR
- 11.5%
- Equity multiple
- 1.66×
- Total profit
- $24,834
- Equity at exit
- $60,702
- IRR
- 13.6%
- Equity multiple
- 3.02×
- Total profit
- $76,236
- Equity at exit
- $93,549
Cash invested: $37,800 (down + closing). Projections, not guarantees.
Landlord ↔ Tenant lean methodology
- Overall (STATE)
- 55 Moderately Landlord-Leaning
- State New Mexico
- 55 Moderately Landlord-Leaning · D+3
- County
- — inherits STATE
- City
- — inherits STATE
ZIP-level market 87752
- Active inventory
- 2
- Price-to-rent
- 9.5×
Monthly cashflow live
- Estimated rent
- $1,183 medium interval (Pro) →
- Mortgage (P&I)
- −$708
- Tax from tax record
- −$35 /mo · $419/yr
- Insurance
- −$56
- HOA
- −$0
- Vacancy / Maint / Mgmt
- −$248
- Net cashflow
- $136
Break-even live
UW: 25.0% down · 7.5% · 30yr · 1.5% tax · 5.0% vac · 8.0% maint · 8.0% mgmt
Financing live
Cash to close
- Down payment
- $33,750
- Closing costs
- $4,050
- Reserves months
- —
- Total cash needed
- —
Loan-product check · same deal, 3 products live
Conventional
25% down · 7.5% · 30yr
- Down + closing
- —
- Monthly P&I
- —
- Monthly cashflow
- —
- DSCR
- —
- Eligible?
- —
Personal DTI + credit; lowest rate.
DSCR
20% down · 8.5% · 30yr
- Down + closing
- —
- Monthly P&I
- —
- Monthly cashflow
- —
- DSCR
- —
- Eligible?
- —
No personal income docs; deal must DSCR.
Hard money
10% down · 12.0% · 12mo
- Down + closing
- —
- Monthly P&I
- —
- Monthly cashflow
- —
- DSCR
- —
- Eligible?
- —
Short-term bridge; refi at stabilization.
Listing history 22 events
-
2026-06-18days on market $135,000 Active 590 DOM
-
2026-06-17days on market $135,000 Active 589 DOM
-
2026-06-16days on market $135,000 Active 588 DOM
-
2026-06-15days on market $135,000 Active 587 DOM
-
2026-06-13days on market $135,000 Active 585 DOM
-
2026-06-12days on market $135,000 Active 584 DOM
-
2026-06-09days on market $135,000 Active 581 DOM
-
2026-06-08days on market $135,000 Active 580 DOM
-
2026-06-07days on market $135,000 Active 579 DOM
-
2026-06-05days on market $135,000 Active 577 DOM
-
2026-06-04days on market $135,000 Active 575 DOM
-
2026-06-02days on market $135,000 Active 574 DOM
-
2026-06-01days on market $135,000 Active 573 DOM
-
2026-05-31days on market $135,000 Active 572 DOM
-
2025-05-12price $135,000 105-char remark
Show marketing remark (105 chars)
Come see this lovely 3-bedroom, 1 bath home. Owner has completed a few upgrades and continues to improve.
-
2024-11-05$140,000 Active 105-char remark
Show marketing remark (105 chars)
Come see this lovely 3-bedroom, 1 bath home. Owner has completed a few upgrades and continues to improve.
-
2023-09-05price $155,000
-
2023-09-05price $155,000
-
2023-07-31$160,000 Active
-
2022-09-01soldstatus
-
2021-11-08$135,000
-
2021-11-08$135,000
ⓘ Source: listings_history table (triggers on properties + properties_extension) + one-shot
backfill from property_details.listing_events for pre-trigger history.
Tax reassessment forecast NM · Resets to sale price
- Current annual tax
- $419 · $35/mo
- Projected year-2 tax
- $1,080 · $90/mo
- Expected delta
- +$661/yr (+$55/mo · 157.7%)
ⓘ Screening estimate from a state-policy table — verify with the county assessor before closing.
Nearby sold comps map
Loading sold comps map…
Walkable amenities ~0.75 mi
Loading nearby amenities…
Taxation est. · year 1
- Rental income
- $14,198
- − Mortgage interest
- −$7,562
- − Property taxes
- −$419
- − Insurance
- −$675
- − Repairs & maintenance
- −$1,136
- − Management
- −$1,136
- − Depreciation
- −$3,927
- Taxable loss
- −$657
- Est. tax savings @ 24.0%
- +$158
- After-tax cash flow
- $1,785/yr
For passive investors: Depreciation is non-cash, so a rental often shows a tax loss while cash-flowing — sheltering income. Rental losses are passive: they offset passive income freely, and up to $25,000/yr can offset ordinary (W-2) income if you actively participate and your MAGI is under $100k (phasing out to $0 by $150k); unused losses carry forward. On sale, claimed depreciation is recaptured at up to 25%, and gains may owe capital-gains tax (a 1031 exchange can defer both). Figures are a year-1 estimate at your 24.0% rate — not tax advice; consult a CPA.
Condition & rehab AI · 1 photo
This single-family home requires significant exterior and interior repairs to improve its condition and value.
Repairs flagged
- Major Exterior siding — Significant damage and debris
- Major Exposed subflooring — Structural damage
- Major Painted walls — Peeling and damage
Value-add opportunities
- Both Paint and repair exterior siding — Enhances curb appeal and structural integrity
- Both Replace exposed subflooring — Stabilizes structure and improves safety
- Both Paint interior walls — Improves aesthetics and reduces maintenance costs
Renovation cost estimate screening
| Repair item | Severity | Est. cost |
|---|---|---|
| Exterior siding · Significant damage and debris | Major | $15,000–50,000 |
| Exposed subflooring · Structural damage | Major | $15,000–50,000 |
| Painted walls · Peeling and damage | Major | $15,000–50,000 |
| Total estimated repair cost · 3 items | $45,000–150,000 |
Value-add ROI direction
- Both Paint and repair exterior siding — Enhances curb appeal and structural integrity ↑
- Both Replace exposed subflooring — Stabilizes structure and improves safety ↑
- Both Paint interior walls — Improves aesthetics and reduces maintenance costs ↑
ⓘ Cost ranges are severity-bucket heuristics (US national rule-of-thumb). Get contractor quotes + a written scope before underwriting a rehab budget.
Schools (NCES district)
- District
- Wagon Mound Public Schools
- NCES district ID
- 3502730
- Math proficiency
- 11% —
- Reading proficiency
- 11% —
- Median HH income
- $34,073
- Composite
- 12.55/100
- National rank
- #14560
- State rank
- #86 of 95 in NM
Livability — Wagon Mound
- Score
- 55/100
- State rank
- #215
- US rank
- #23583
Category grades
Schools grade is shown separately in the Schools card above.
Census & demographics
- Census place
- Wagon Mound, NM
- Population (ZIP)
- 706
Population outlook (Mora County) Hauer SSP2
- Today (2025)
- 3,991 people
- By 2030
- 3,684 · -7.7%
- By 2040
- 3,032 · -24.0%
- By 2050
- 2,461 · -38.3%
- By 2075
- 1,595 · -60.0%
- By 2100
- 1,000 · -74.9%
Race, ethnicity, and origin ACS 2023
- Neighborhood character
- Majority Hispanic (64%)
- Race & ethnicity
- Hispanic / Latino 64% White 35% Two or more races 18% Native American 2%
- Hispanic origin (detail)
- Mexican 21% Puerto Rican 3%
- Common ancestry
- Lithuanian 21% Portuguese 20% Italian 3%
- Foreign-born
- 0% · Canada
- Languages at home
- 57% English-only · Spanish 42% Arabic 1%
Political lean MEDSL · Mora
- 2024 margin
- D (+17.2) · D 57.9% · R 40.6% · Other 1.5%
- 2008→2024 swing
- -40.7pp toward R · 2008: 57.9pp · 2024: 17.2pp
- All cycles
- 2024: D+17.2 2020: D+31.4 2016: D+35.9 2012: D+52.3 2008: D+57.9
Not yet ingested
- Civics
- —
Market trends
- HPI YoY
- —
- Current HPI
- —
- Rent YoY
- —
- Metro
- —
- State GDP YoY
- —
- F500 in state
- 0
Price history
+0.0% since first listed8 events — show timeline
- 2025-05-12 Price Changed $135,000 NMMLS
- 2024-11-05 Listed $140,000 NMMLS
- 2023-09-05 Price Changed $155,000 NMMLS
- 2023-09-05 Price Changed $155,000 Santa Fe MLS
- 2023-07-31 Listed $160,000 Santa Fe MLS
- 2022-09-01 Sold (MLS) — NMMLS
- 2021-11-08 Listed $135,000 NMMLS
- 2021-11-08 Listed $135,000 Santa Fe MLS
Cash-flow waterfall
monthlySold comps — $/sqft
last 12 mo · ≤1 miLoading sold comps…