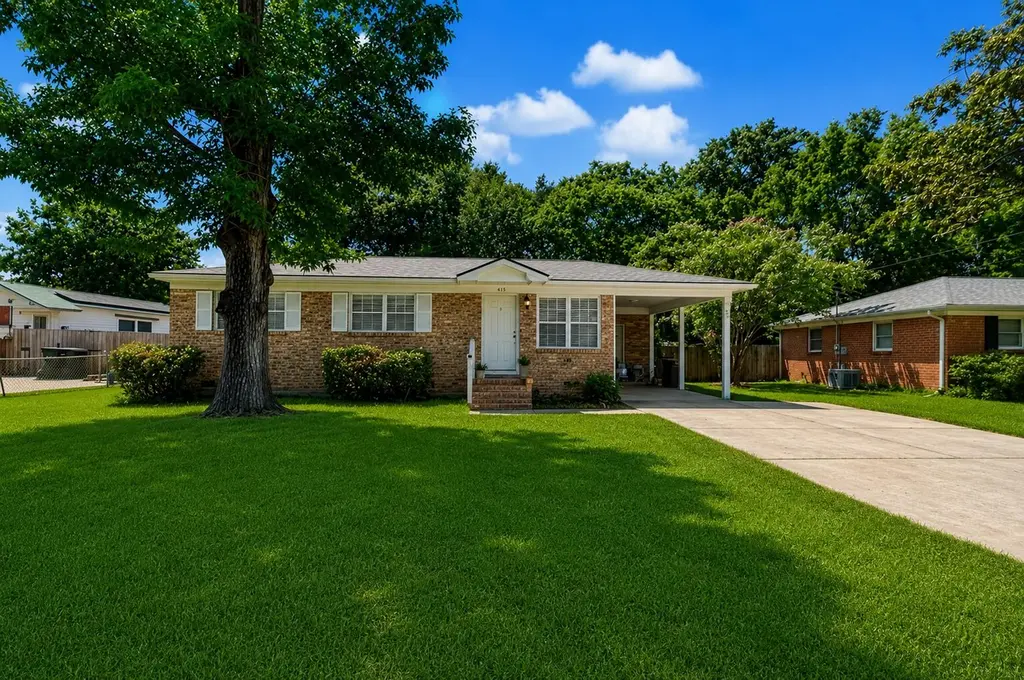
415 Mary Scott Dr · Goose Creek, SC
Flood risk 1/10 · Minimal
- FEMA flood zone
- X (unshaded)
- Chance of flooding over 30 yrs
- 0.0%
- Est. flood insurance / yr
- $507 – $1,088
Fire risk 3/10 · Minor
- Est. fire insurance / yr
- $783 – $1,453
Heat risk 9/10 · Severe
- Hot days now (above 109°F)
- 7 days/yr
- Hot days in 30 yrs
- 17 days/yr
Wind risk 8/10 · Major
- Chance of severe wind over 30 yrs
- 98.0%
Air-quality risk 2/10 · Minimal
- Unhealthy air days now
- 2 days/yr
- Unhealthy air days in 30 yrs
- 2 days/yr
Risk factors via First Street. Map © Google.
Why this score? — see what drove the D- grade
The composite is a weighted blend of 9 inputs, each scored 0–100. Each bar is that input's sub-score; the figure is the points it added to the 100-point composite (weight × sub-score).
- Cash flow +15.5/30.0
- DSCR +4.8/10.0
- Rent growth +3.6/5.0
- Schools +3.6/10.0
- Livability +3.4/5.0
- 1% rule +3.2/10.0
- ARV discount +3.2/15.0
- Condition / age +2.5/5.0
- Appreciation +0.0/10.0
$250,000
🖨 Deal sheet (PDF) 📄 Offer letter ✓ Due diligence
Listing remarks MLS
Move-in ready home with large back yard and plenty of updates. Don't miss the opportunity to call this home yours. its minutes from everything. Freshly painted. Washer & Dryer Convey.
Key facts
- Stunning garden
- Massive backyard
- Close to i-26
Tags
Property features AI
Exterior
- Parking: 1-car carport
- Utilities: Public sewer; Berkeley Electric Co-Op service; City of Goose Creek utility service
- Home design: Single-family detached home; One story
- Construction: Architectural roof
- Exterior features: Wrought iron fencing
Interior
- Kitchen: Electric range; Refrigerator
- Bedrooms: 3 bedrooms; Master bedroom with ceiling fan
- Flooring: Wood floors
- Bathrooms: 1 bathroom
- Heating & cooling: Central heating; Central air conditioning
- Interior features: Smooth ceilings; Ceiling fans; Eat-in kitchen
Neighborhood map
What this means for you Summary
Snapshot
- This is a 3-bed/1.0-bath single-family listed at $250k.
Deal economics
- At list price, monthly cash flow is $99 ($1k/yr) — positive.
- The deal already cash-flows at list — no discount required.
- To meet the 1% rule (rent ≥ 1% of price), the offer needs to be $204k (18.5% below list).
- Recommended offer: $204k (18.5% below list) — sets the bar for 1% rule.
- Cap rate 6.8% vs local median 4.0% in Goose Creek — top-decile yield for the area; either an underpriced asset or a hidden risk that comps aren't pricing in. Stress-test before assuming the spread holds.
Location & tenants
- Location reads 67/100 on livability (#103 in SC) — a middle-class / working-renter tenant base. Strengths: housing A+, employment A, cost of living B+; Watch: amenities F, commute F, health & safety F.
- Berkeley 01 (suburban): math 35% / reading 48% proficiency, ranked #30 of 80 in SC (top 38%) — families likely to look elsewhere, expect single-tenant / working-renter base with shorter leases.
- Zoned schools: Boulder Bluff Elementary (math 25% / reading 34%, grade F, #399 of 597 statewide, top 69%, 633 students, 100% FRL); Sedgefield Middle (math 13% / reading 26%, grade F, #182 of 229 statewide, top 80%, 986 students, 100% FRL); Goose Creek High (math 33% / reading 68%, grade D+, #150 of 196 statewide, top 76%, 1,981 students, 52% FRL) — zoned schools average 84% FRL vs 48% district-wide (36 pts higher); higher-poverty schools than district average — tighter screening recommended.
- Market conditions: Rents rising fast (+4.5%/yr); 266 active listings in the ZIP; 2 comparable units currently listed for rent nearby; solid renter incomes; 3,183 units permitted in Berkeley County in 2024 (580 in 5+ unit buildings).
Forward outlook
- Local home prices are declining (-3.0%/yr); year-one equity from $2k of loan paydown is wiped out by about $8k of value loss. Plan a longer hold.
- Berkeley County population projected at +48% by 2050 — long-run rental-demand tailwind backs the buy-and-hold thesis.
Negotiation context
- Only 12 days on market — expect competitive offers; lowballing is unlikely to land.
- 5 sale attempts since 15y ago with the ask held roughly flat each time — persistent listings suggest the price (not the market) is what's stuck; bring a comps-based counter.
- Current owner paid $185k; 35% above their basis — modest negotiation headroom, anchor on the comps not their cost.
Risks & watch-outs
- Climate carrying-cost: severe wind risk, 98% chance of damaging wind over 30y; extreme-heat days projected 7→17/yr by 2055 (HVAC capex compounding) — expect insurance premiums to compound above CPI over the hold.
Questions for the listing agent
- Built in 1975 — when were the roof, HVAC, electrical panel, plumbing, and water heater last replaced?
- Is there a deadline driving the sale (1031 exchange, divorce, estate, relocation)? That informs how much negotiation room exists.
- The area grade is low — what's the realistic commute time and amenity access for the typical tenant pool here? Any planned neighborhood developments (good or bad) we should know about?
- What's the average days-on-market for RENTAL listings here right now (not sales)? A rising rental-DOM trend means longer vacancies and softer asking-rent achievability than the comps imply.
- What's the recent tenant-quality profile in this submarket — average credit score on applications, eviction rate, late-payment / NSF rate, and stable-employment percentage? A property-management company in the area should have these aggregated.
- How much new for-sale + rental construction is in the pipeline within 1–3 miles? Heavy new supply typically softens prices + rents 12–24 months out; constrained supply supports both.
Investment metrics
- 1% rule
- 0.82% ✗
- Cap rate
- 6.77%
- Cash-on-cash
- 1.70%
- DSCR
- 1.08
- GRM
- 10.2
CMA / ARV
- ARV (on-the-fly)
- $228,000
- Comps found
- 12
Show comp detail 12 sales within ~0.75 mi
| Address | Dist | Beds/Ba | Sqft | Sold | Price | $/sf | Match |
|---|---|---|---|---|---|---|---|
| 423 Jean Wells Dr | 0.08mi | 3/1.0 | 956 (+5%) | 7mo | $225,000 | $235 | 82 |
| 401 Mary Scott Dr | 0.09mi | 3/1.0 | 874 (-4%) | 10mo | $212,000 | $243 | 80 |
| 419 Anita Dr | 0.23mi | 3/1.0 | 1,000 (+10%) | 4mo | $258,000 | $258 | 70 |
| 445 Robin Dr | 0.23mi | 3/1.0 | 1,008 (+10%) | 2mo | $175,000 | $174 | 70 |
| 316 Anne St | 0.27mi | 3/1.0 | 1,000 (+10%) | 2mo | $292,000 | $292 | 69 |
| 435 Anita Dr | 0.27mi | 3/1.0 | 1,000 (+10%) | 3mo | $250,000 | $250 | 69 |
| 413 Sarah Dr | 0.17mi | 3/1.0 | 1,040 (+14%) | 3mo | $240,000 | $231 | 66 |
| 420 Tammie Avenue Ave | 0.29mi | 3/1.5 | 975 (+7%) | 8mo | $125,000 | $128 | 66 |
| 419 Tammie Ave Ave | 0.30mi | 3/1.5 | 971 (+6%) | 11mo | $180,000 | $185 | 64 |
| 413 Madeline Dr | 0.17mi | 3/2.0 | 1,008 (+10%) | 12mo | $286,000 | $284 | 61 |
| 318 Jean Wells Dr | 0.45mi | 3/1.0 | 1,008 (+10%) | 5mo | $257,500 | $255 | 58 |
| 349 Water Oak Dr | 0.64mi | 3/2.0 | 975 (+7%) | 3mo | $264,000 | $271 | 52 |
Match score weights: distance 35% · size 25% · config 20% · recency 20%. Top-matched comps best support the ARV.
Projected returns pro-forma
-3.0% appreciation · 4.52% rent growth · sell at horizon
- IRR
- -12.1%
- Equity multiple
- 0.56×
- Total profit
- $-31,138
- Equity at exit
- $37,276
- IRR
- -1.2%
- Equity multiple
- 0.91×
- Total profit
- $-6,014
- Equity at exit
- $21,615
Cash invested: $70,000 (down + closing). Projections, not guarantees.
Landlord ↔ Tenant lean methodology
- Overall (STATE)
- 90 Strongly Landlord-Friendly
- State South Carolina
- 90 Strongly Landlord-Friendly · R+6
- County
- — inherits STATE
- City
- — inherits STATE
ZIP-level market 29445
- Home prices YoY
- -18.0%
- Rents YoY
- 4.5%
- Active inventory
- 266
- Price-to-rent
- 10.2×
Monthly cashflow live
- Estimated rent
- $2,038 medium interval (Pro) →
- Mortgage (P&I)
- −$1,311
- Tax from tax record
- −$95 /mo · $1,144/yr
- Insurance
- −$104
- HOA
- −$0
- Vacancy / Maint / Mgmt
- −$428
- Net cashflow
- $99
Break-even live
Sensitivity live
| Price | -10% $241 | -5% $170 | +0% $99 | +5% $28 | +10% $-42 |
|---|---|---|---|---|---|
| Rent | -10% $-62 | -5% $19 | +0% $99 | +5% $180 | +10% $260 |
| Rate | -1.0pp $225 | -0.5pp $163 | base $99 | +0.5pp $34 | +1.0pp $-32 |
UW: 25.0% down · 7.5% · 30yr · 1.5% tax · 5.0% vac · 8.0% maint · 8.0% mgmt
Financing live
Cash to close
- Down payment
- $62,500
- Closing costs
- $7,500
- Reserves months
- —
- Total cash needed
- —
Loan-product check · same deal, 3 products live
Conventional
25% down · 7.5% · 30yr
- Down + closing
- —
- Monthly P&I
- —
- Monthly cashflow
- —
- DSCR
- —
- Eligible?
- —
Personal DTI + credit; lowest rate.
DSCR
20% down · 8.5% · 30yr
- Down + closing
- —
- Monthly P&I
- —
- Monthly cashflow
- —
- DSCR
- —
- Eligible?
- —
No personal income docs; deal must DSCR.
Hard money
10% down · 12.0% · 12mo
- Down + closing
- —
- Monthly P&I
- —
- Monthly cashflow
- —
- DSCR
- —
- Eligible?
- —
Short-term bridge; refi at stabilization.
Rent comps 2 comps
| Address | Beds | Baths | Sqft | Rent | $/sqft | DOM | Units | Dist |
|---|---|---|---|---|---|---|---|---|
| 35 Elmwood Pl Goose Creek, SC | 3.0 | 1.5 | 900 | $1,699 | $1.89 | 25d | 1 | 0.83mi |
| 200 Branchwood Dr Goose Creek, SC | 2.0–3.0 | 2.0 | 943 | $1,575 | $1.67 | 5d | 3 | 1.32mi |
Listing history 9 events
-
2026-06-21days on market $250,000 Active 12 DOM
-
2026-06-18days on market $250,000 Active 9 DOM
-
2026-06-17days on market $250,000 Active 8 DOM
-
2026-06-16days on market $250,000 Active 7 DOM
-
2026-06-15days on market $250,000 Active 6 DOM
-
2026-06-13days on market $250,000 Active 4 DOM
-
2026-06-13days on market $250,000 Active 3 DOM
-
2026-06-10remarks 493-char remark
-
2026-06-10$250,000 Active 1 DOM
ⓘ Source: listings_history table (triggers on properties + properties_extension) + one-shot
backfill from property_details.listing_events for pre-trigger history.
Tax reassessment forecast SC · Resets to sale price
- Current annual tax
- $1,144 · $95/mo
- Projected year-2 tax
- $1,425 · $119/mo
- Expected delta
- +$281/yr (+$23/mo · 24.5%)
ⓘ Screening estimate from a state-policy table — verify with the county assessor before closing.
Climate risk First Street
- Flood 1/10 Low FEMA zone X (unshaded) · 0% chance over 30 yrs
- Wildfire 3/10 Moderate
- Heat 9/10 Extreme 7 d/yr ≥109°F today · 17 d/yr by 30 yrs out
- Wind 8/10 Severe 98% chance of damaging wind over 30 yrs
- Air quality 2/10 Low 2 unhealthy d/yr today · 2 by 30 yrs out
Nearby sold comps map
Loading sold comps map…
Walkable amenities ~0.75 mi
Loading nearby amenities…
Taxation est. · year 1
- Rental income
- $24,451
- − Mortgage interest
- −$14,004
- − Property taxes
- −$1,144
- − Insurance
- −$1,250
- − Repairs & maintenance
- −$1,956
- − Management
- −$1,956
- − Depreciation
- −$7,273
- Taxable loss
- −$3,132
- Est. tax savings @ 24.0%
- +$752
- After-tax cash flow
- $1,941/yr
For passive investors: Depreciation is non-cash, so a rental often shows a tax loss while cash-flowing — sheltering income. Rental losses are passive: they offset passive income freely, and up to $25,000/yr can offset ordinary (W-2) income if you actively participate and your MAGI is under $100k (phasing out to $0 by $150k); unused losses carry forward. On sale, claimed depreciation is recaptured at up to 25%, and gains may owe capital-gains tax (a 1031 exchange can defer both). Figures are a year-1 estimate at your 24.0% rate — not tax advice; consult a CPA.
Schools (NCES district)
- District
- Berkeley 01
- NCES district ID
- 4501170
- Math proficiency
- 35% ▼ -8.00%
- Reading proficiency
- 48% ▼ -2.00%
- Median HH income
- $52,724
- Composite
- 35.95/100
- National rank
- #4799
- State rank
- #30 of 80 in SC
Livability — Goose Creek
- Score
- 67/100
- State rank
- #103
- US rank
- #10912
Category grades
Schools grade is shown separately in the Schools card above.
Census & demographics
- Census place
- Goose Creek, SC
- County
- Berkeley County · 198,768 people
- City population
- 59,227
- Metro
- Charleston-North Charleston, SC
- Population (ZIP)
- 59,227
- Household income
- $81,594
- Rent vs Own
- Severe rent burden
- 1308.0
Population outlook (Berkeley County) Hauer SSP2
- Today (2025)
- 254,184 people
- By 2030
- 279,677 · +10.0%
- By 2040
- 329,379 · +29.6%
- By 2050
- 375,557 · +47.8%
- By 2075
- 476,740 · +87.6%
- By 2100
- 535,945 · +110.8%
Race, ethnicity, and origin ACS 2023
- Neighborhood character
- Diverse neighborhood (Simpson 0.63)
- Race & ethnicity
- White 55% Black 23% Hispanic / Latino 11% Two or more races 9% Asian 3%
- Hispanic origin (detail)
- Mexican 4% Puerto Rican 3%
- Common ancestry
- Slovak 2% Lithuanian 2% Italian 1%
- Foreign-born
- 9% · Canada, Jamaica, Vietnam
- Languages at home
- 86% English-only · Spanish 8% Other Indo-European 2% Tagalog/Filipino 2%
Political lean MEDSL · Berkeley
- 2024 margin
- R (+16.3) · D 41.1% · R 57.4% · Other 1.4%
- 2008→2024 swing
- -3.2pp toward R · 2008: -13.1pp · 2024: -16.3pp
- All cycles
- 2024: R+16.3 2020: R+11.7 2016: R+17.4 2012: R+18.9 2008: R+13.1
Not yet ingested
- Civics
- —
Market trends
- HPI YoY
- ▼ -66.40%
- Current HPI
- 301.8653
- Rent YoY
- ▲ 4.52%
- Metro
- Charleston-North Charleston, SC
- State GDP YoY
- ▲ 4.51%
- F500 in state
- 2
Industry mix (Fortune 500 HQ in SC)
| Industry | F500 HQs | Revenue |
|---|---|---|
| Packaging | 1 | $7B |
|
||
Price history
+632.7% since first listed15 events — show timeline
- 2026-06-09 Listed $250,000 Charleston Trident MLS
- 2021-04-19 Sold (Public Records) $185,000 Public Records
- 2021-04-16 Sold (MLS) $185,000 Charleston Trident MLS
- 2021-03-10 Contingent — Charleston Trident MLS
- 2021-03-09 Listed $185,000 Charleston Trident MLS
- 2017-03-31 Sold (Public Records) $110,500 Public Records
- 2017-03-30 Sold (MLS) $110,500 Charleston Trident MLS
- 2017-03-05 Contingent — Charleston Trident MLS
- 2017-02-28 Listed $108,500 Charleston Trident MLS
- 2012-05-22 Sold (Public Records) $82,500 Public Records
- 2012-05-11 Sold (MLS) $82,500 Charleston Trident MLS
- 2011-12-12 Listed $85,000 Charleston Trident MLS
- 2011-02-18 Sold (MLS) $20,500 Charleston Trident MLS
- 2011-01-19 Listed $19,999 Charleston Trident MLS
- 1995-09-26 Sold (Public Records) $34,121 Public Records
Property tax history
+0.3%/yrLatest (2025): $1,144 · +2.2% YoY. Source: county tax records.
Cash-flow waterfall
monthlySold comps — $/sqft
last 12 mo · ≤1 miLoading sold comps…