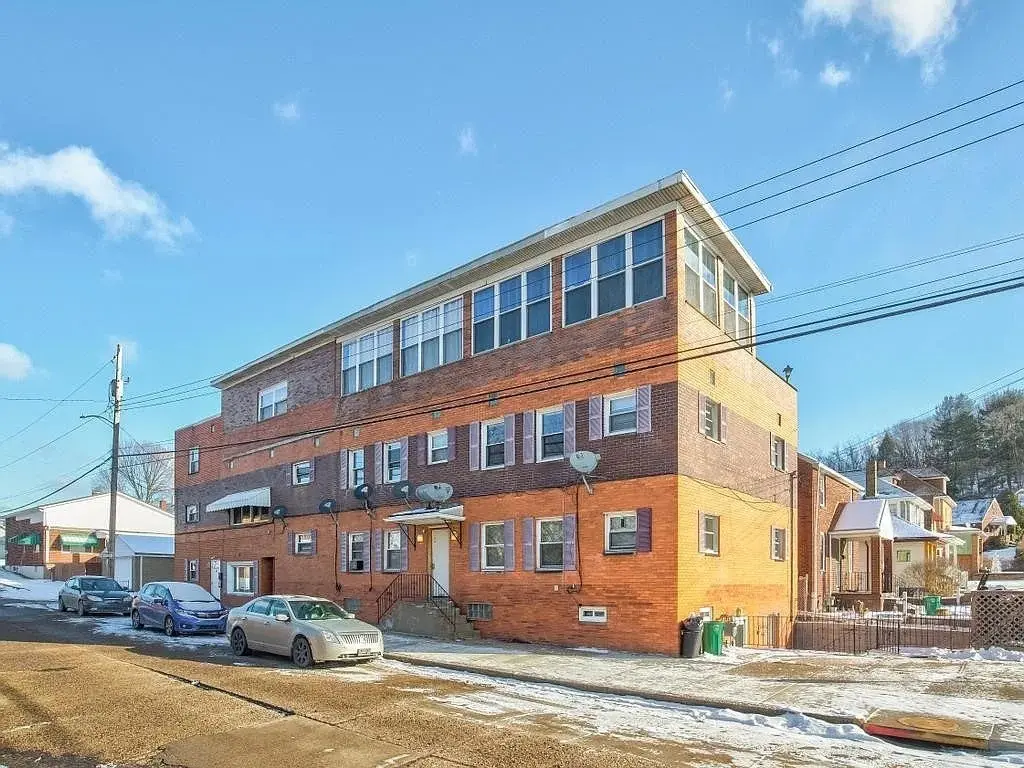
 8-Plex
801 23rd St · Ambridge, PA
Flood risk 7/10 · Major
- FEMA flood zone
- X (unshaded)
- Chance of flooding over 30 yrs
- 0.99%
- Est. flood insurance / yr
- $507 – $1,088
Fire risk 1/10 · Minimal
- Est. fire insurance / yr
- $511 – $949
Heat risk 4/10 · Minor
- Hot days now (above 97°F)
- 7 days/yr
- Hot days in 30 yrs
- 19 days/yr
Wind risk 2/10 · Minimal
- Chance of severe wind over 30 yrs
- —
Air-quality risk 3/10 · Minor
- Unhealthy air days now
- 2 days/yr
- Unhealthy air days in 30 yrs
- 3 days/yr
Risk factors via First Street. Map © Google.
Why this score? — see what drove the B- grade
The composite is a weighted blend of 9 inputs, each scored 0–100. Each bar is that input's sub-score; the figure is the points it added to the 100-point composite (weight × sub-score).
- Cash flow +30.0/30.0
- DSCR +10.0/10.0
- 1% rule +9.3/10.0
- ARV discount +7.5/15.0
- Livability +3.9/5.0
- Schools +3.1/10.0
- Rent growth +2.5/5.0
- Condition / age +2.5/5.0
- Appreciation +0.0/10.0
$555,000
🖨 Deal sheet 📄 Offer letter ✓ Due diligence
Multi-family units
County records classify this as Multi-Family (5+ Unit). Listing-text estimate: 8 units. confirmed
5+ unit building — per-unit beds/baths from public records are typically unavailable; the breakdown below (if shown) is an estimate from the listing text.
Listing remarks MLS
8 unit brick, 3 story apartment in the heart of Ambridge. Solid investment opportunity in an vibrant area. 7 of the 8 units are rented. Coin operated laundry provides additional income. No lawn maintenance reduces expenses. Potential BRRRR opportunity. A short drive to the Shell cracker plant, Pittsburgh International Airport and downtown Pittsburgh.
Key facts
- No lawn maintenance
- 3,920 sq ft lot
- Built 1957
Tags
Neighborhood map
What this means for you Summary
Snapshot
- This is a 8 × 1-bed/1-bath units multifamily listed at $555k.
Deal economics
- At list price, monthly cash flow is $2k ($29k/yr) — positive. Per door: $303/mo.
- The deal already cash-flows at list — no discount required.
- Meets the 1% rule at list price ($8k rent vs $555k).
- Recommended offer: $538k (3.0% below list) — sets the bar for market timing.
- Cap rate 11.7% vs local median 6.6% in Ambridge — top-decile yield for the area; either an underpriced asset or a hidden risk that comps aren't pricing in. Stress-test before assuming the spread holds.
Location & tenants
- Location reads 78/100 on livability (#293 in PA, #2,594 nationally) — a middle-class / working-renter tenant base. Strengths: commute A+, cost of living A+, housing A+; Watch: schools D+, employment D+, crime F.
- Ambridge Area SD (suburban): math 23% / reading 48% proficiency, ranked #408 of 539 in PA (top 76%) — families likely to look elsewhere, expect single-tenant / working-renter base with shorter leases.
- Market conditions: 58 active listings in the ZIP; 272 units permitted in Beaver County in 2024 (80 in 5+ unit buildings).
- At $7,952/mo this rent would consume 160% of the median local household income ($60k/yr) (locally 397% of renters already pay >50% of income on rent) — very limited rent-growth headroom before tenants either downsize or default.
Forward outlook
- Local home prices are declining (-3.0%/yr); year-one equity from $4k of loan paydown is wiped out by about $17k of value loss. Plan a longer hold.
- Beaver County population projected at -14% by 2050 — secular population decline; favor cash flow + early exit over multi-decade hold.
- At projected returns (-3.0% appreciation + 3.0% rent growth), your $155k cash investment doubles in ~7 years — after that, you're playing with house money.
Negotiation context
- It's been on market 58 days — a 3% lower offer ($538k) is reasonable based on typical stale-listing flexibility.
- 9 sale attempts since 4y ago with the ask held roughly flat each time — persistent listings suggest the price (not the market) is what's stuck; bring a comps-based counter.
Risks & watch-outs
- Watch-outs: flood insurance adds $66/mo; built in 1957 — expect roof / HVAC / electrical / plumbing capex.
- Climate carrying-cost: major flood risk — expect insurance premiums to compound above CPI over the hold.
Questions for the listing agent
- It's been on market 58 days. Have you received any prior offers? Is the seller open to a 3% concession, seller financing, or rate buy-down credit?
- Can we see the unit-by-unit rent roll, current vacancy, and any below-market leases? What's the average tenancy length?
- What capital expenditures (roof, boiler, parking lot, exteriors) have been made in the last 5 years, and what's planned in the next 2?
- Built in 1957 — when were the roof, HVAC, electrical panel, plumbing, and water heater last replaced?
- What's the actual annual flood-insurance premium (NFIP or private), and is the property in a SFHA with mandatory coverage?
- Is there a deadline driving the sale (1031 exchange, divorce, estate, relocation)? That informs how much negotiation room exists.
- Schools are D-rated, which usually means shorter tenancies and higher turnover. Who's the typical renter profile here, and what's been the actual vacancy rate?
- Crime grade is F in this area — have there been break-ins, vandalism, or insurance claims at this property in the last 3 years? What carrier currently insures it and at what premium?
- What's the average days-on-market for RENTAL listings here right now (not sales)? A rising rental-DOM trend means longer vacancies and softer asking-rent achievability than the comps imply.
- What's the recent tenant-quality profile in this submarket — average credit score on applications, eviction rate, late-payment / NSF rate, and stable-employment percentage? A property-management company in the area should have these aggregated.
- How much new apartment / multifamily construction is in the pipeline within 1–3 miles? Heavy new supply (>2% of stock underway) typically softens rents 12–24 months out; light construction supports rent growth.
Investment metrics
- 1% rule
- 1.43% ✓
- Cap rate
- 11.68%
- Cash-on-cash
- 19.26%
- DSCR
- 1.86
- GRM
- 5.8
CMA / ARV
- ARV (median comp)
- $103,176
- List price
- $555,000
- Delta
- 437.91%
- Verdict
- OVERPRICED
- Comps
- 1 within 2.0 mi
Projected returns pro-forma
-3.0% appreciation · 3.0% rent growth · sell at horizon
- IRR
- 10.5%
- Equity multiple
- 1.42×
- Total profit
- $64,784
- Equity at exit
- $82,752
- IRR
- 19.6%
- Equity multiple
- 2.65×
- Total profit
- $256,004
- Equity at exit
- $47,986
Cash invested: $155,400 (down + closing). Projections, not guarantees.
Landlord ↔ Tenant lean methodology
- Overall (STATE)
- 62 Landlord-Friendly
- State Pennsylvania
- 62 Landlord-Friendly · EVEN
- County
- — inherits STATE
- City
- — inherits STATE
ZIP-level market 15003
- Home prices YoY
- -15.7%
- Active inventory
- 58
- Price-to-rent
- 46.5×
Monthly cashflow live
- Estimated rent
- $7,952 medium interval (Pro) →
- Mortgage (P&I)
- −$2,910
- Tax from tax record
- −$647 /mo · $7,761/yr
- Insurance
- −$231
- Flood insurance flood zone
- −$66 /mo · $798/yr
- HOA
- −$0
- Vacancy / Maint / Mgmt
- −$1,670
- Net cashflow
- $2,427
Break-even live
8-unit breakdown (identical units grouped — click to expand)
| Units | Beds | Baths | Est. rent |
|---|---|---|---|
| 8× units | 1 | 1 | $7,952 |
| #1 | 1 | 1 | $994 |
| #2 | 1 | 1 | $994 |
| #3 | 1 | 1 | $994 |
| #4 | 1 | 1 | $994 |
| #5 | 1 | 1 | $994 |
| #6 | 1 | 1 | $994 |
| #7 | 1 | 1 | $994 |
| #8 | 1 | 1 | $994 |
| Total (8 units) | $7,952 | ||
UW: 25.0% down · 7.5% · 30yr · 1.5% tax · 5.0% vac · 8.0% maint · 8.0% mgmt
Financing live
Cash to close
- Down payment
- $138,750
- Closing costs
- $16,650
- Reserves months
- —
- Total cash needed
- —
Loan-product check · same deal, 3 products live
Conventional
25% down · 7.5% · 30yr
- Down + closing
- —
- Monthly P&I
- —
- Monthly cashflow
- —
- DSCR
- —
- Eligible?
- —
Personal DTI + credit; lowest rate.
DSCR
20% down · 8.5% · 30yr
- Down + closing
- —
- Monthly P&I
- —
- Monthly cashflow
- —
- DSCR
- —
- Eligible?
- —
No personal income docs; deal must DSCR.
Hard money
10% down · 12.0% · 12mo
- Down + closing
- —
- Monthly P&I
- —
- Monthly cashflow
- —
- DSCR
- —
- Eligible?
- —
Short-term bridge; refi at stabilization.
Listing history 41 events
-
2026-06-18days on market $555,000 Active 58 DOM
-
2026-06-17days on market $555,000 Active 57 DOM
-
2026-06-16days on market $555,000 Active 56 DOM
-
2026-06-16price $555,000 Active 55 DOM
-
2026-06-15days on market $560,000 Active 55 DOM
-
2026-06-13days on market $560,000 Active 53 DOM
-
2026-06-13days on market $560,000 Active 52 DOM
-
2026-06-09days on market $560,000 Active 49 DOM
-
2026-06-08days on market $560,000 Active 48 DOM
-
2026-06-07days on market $560,000 Active 47 DOM
-
2026-06-03days on market $560,000 Active 43 DOM
-
2026-06-02days on market $560,000 Active 42 DOM
-
2026-06-01days on market $560,000 Active 41 DOM
-
2026-05-31days on market $560,000 Active 40 DOM
-
2026-04-21$560,000 Active 352-char remark
Show marketing remark (352 chars)
8 unit brick, 3 story apartment in the heart of Ambridge. Solid investment opportunity in an vibrant area. 7 of the 8 units are rented. Coin operated laundry provides additional income. No lawn maintenance reduces expenses. Potential BRRRR opportunity. A short drive to the Shell cracker plant, Pittsburgh International Airport and downtown Pittsburgh.
-
2026-04-04$560,000 Active 442-char remark
Show marketing remark (442 chars)
All brick three story apartment building in the heart of Ambridge! All 8 units have been updated. This building's location is ideal with it being just a few minutes from highway 65, 25 minutes to downtown Pittsburgh, 15 minutes to the Pittsburgh airport, and 15 minutes to the Shell Cracker plant. Enjoy a low maintenance income opportunity in a town that is in its early stages of growth. Don't miss out on this great investment opportunity!
-
2025-04-08soldstatus $510,000
-
2025-04-03soldstatus $510,000 Closed
-
2025-03-09status Pending
-
2025-01-29historical Contingent
-
2025-01-14$525,000 Active
-
2024-05-26historical $750
-
2024-05-23price $750
-
2024-05-16$775
-
2024-04-10historical $775
-
2024-04-05$775
-
2024-04-05historical $775
-
2024-03-13historical $775
-
2024-03-13$775
-
2024-01-31price $820
-
2024-01-24price $850
-
2024-01-18$900
-
2023-10-06historical $800
-
2023-10-02$800
-
2022-08-20status Pending
-
2022-08-19soldstatus $450,000 Closed
-
2022-06-23historical Contingent
-
2022-06-13$475,000 Active
-
2018-05-22soldstatus $303,460
-
2011-01-05soldstatus $220,000
-
1989-09-26soldstatus $150,000
ⓘ Source: listings_history table (triggers on properties + properties_extension) + one-shot
backfill from property_details.listing_events for pre-trigger history.
Tax reassessment forecast PA · Partial reset (capped growth)
- Current annual tax
- $7,761 · $647/mo
- Projected year-2 tax
- $8,265 · $689/mo
- Expected delta
- +$504/yr (+$42/mo · 6.5%)
ⓘ Screening estimate from a state-policy table — verify with the county assessor before closing.
Climate risk First Street
- Flood 7/10 Severe FEMA zone X (unshaded) · 99% chance over 30 yrs
- Wildfire 1/10 Low
- Heat 4/10 Moderate 7 d/yr ≥97°F today · 19 d/yr by 30 yrs out
- Wind 2/10 Low
- Air quality 3/10 Moderate 2 unhealthy d/yr today · 3 by 30 yrs out
Nearby sold comps map
Loading sold comps map…
Walkable amenities ~0.75 mi
Loading nearby amenities…
Taxation est. · year 1
- Rental income
- $95,424
- − Mortgage interest
- −$31,089
- − Property taxes
- −$7,761
- − Insurance
- −$3,572
- − Repairs & maintenance
- −$7,634
- − Management
- −$7,634
- − Depreciation
- −$16,145
- Taxable income
- $21,589
- Est. tax owed @ 24.0%
- −$5,181
- After-tax cash flow
- $23,944/yr
For passive investors: Depreciation is non-cash, so a rental often shows a tax loss while cash-flowing — sheltering income. Rental losses are passive: they offset passive income freely, and up to $25,000/yr can offset ordinary (W-2) income if you actively participate and your MAGI is under $100k (phasing out to $0 by $150k); unused losses carry forward. On sale, claimed depreciation is recaptured at up to 25%, and gains may owe capital-gains tax (a 1031 exchange can defer both). Figures are a year-1 estimate at your 24.0% rate — not tax advice; consult a CPA.
Schools (NCES district)
- District
- Ambridge Area SD
- NCES district ID
- 4202440
- Math proficiency
- 23% ▼ -12.00%
- Reading proficiency
- 48% ▼ -10.00%
- Median HH income
- $49,514
- Composite
- 30.62/100
- National rank
- #6190
- State rank
- #408 of 539 in PA
Livability — Ambridge
- Score
- 78/100
- State rank
- #293
- US rank
- #2594
Category grades
Schools grade is shown separately in the Schools card above.
Census & demographics
- Census place
- Ambridge, PA
- County
- Beaver County · 116,001 people
- City population
- 11,387
- Metro
- Pittsburgh, PA
- Population (ZIP)
- 11,387
- Household income
- $59,550
- Rent vs Own
- Severe rent burden
- 397.0
Population outlook (Beaver County) Hauer SSP2
- Today (2025)
- 164,976 people
- By 2030
- 161,449 · -2.1%
- By 2040
- 151,752 · -8.0%
- By 2050
- 141,155 · -14.4%
- By 2075
- 118,142 · -28.4%
- By 2100
- 91,740 · -44.4%
Race, ethnicity, and origin ACS 2023
- Neighborhood character
- Predominantly White (77%)
- Race & ethnicity
- White 77% Two or more races 10% Black 9% Hispanic / Latino 7%
- Hispanic origin (detail)
- Mexican 2% Puerto Rican 3%
- Common ancestry
- Romanian 7% Scotch-Irish 3% Subsaharan African 3%
- Foreign-born
- 3% · Canada
- Languages at home
- 95% English-only · Other Indo-European 2% Spanish 2% Russian/Polish/Slavic 1%
Political lean MEDSL · Beaver
- 2024 margin
- Strong R (+20.7) · D 39.2% · R 59.9%
- 2008→2024 swing
- -17.9pp toward R · 2008: -2.8pp · 2024: -20.7pp
- All cycles
- 2024: R+20.7 2020: R+17.7 2016: R+20.1 2012: R+6.6 2008: R+2.8
Not yet ingested
- Civics
- —
Market trends
- HPI YoY
- ▼ -46.42%
- Current HPI
- 249.8525
- Rent YoY
- —
- Metro
- Pittsburgh, PA
- State GDP YoY
- ▲ 1.68%
- F500 in state
- 34
Industry mix (Fortune 500 HQ in PA)
| Industry | F500 HQs | Revenue |
|---|---|---|
| Healthcare | 2 | $309B |
|
||
| Insurance | 2 | $27B |
|
||
| Telecommunications / Media | 1 | $124B |
|
||
| Industrial Distribution | 1 | $22B |
|
||
| Financial Services | 1 | $20B |
|
||
| Chemicals / Materials | 1 | $18B |
|
||
Price history
+273.3% since first listed27 events — show timeline
- 2026-04-21 Listed $560,000 West Penn MLS
- 2026-04-04 Listed $560,000 West Penn MLS
- 2025-04-08 Sold (Public Records) $510,000 Public Records
- 2025-04-03 Sold (MLS) $510,000 West Penn MLS
- 2025-03-09 Pending — West Penn MLS
- 2025-01-29 Contingent — West Penn MLS
- 2025-01-14 Listed $525,000 West Penn MLS
- 2024-05-26 Rental Removed $750 APPFOLIO
- 2024-05-23 Price Changed $750 APPFOLIO
- 2024-05-16 Listed for Rent $775 APPFOLIO
- 2024-04-10 Rental Removed $775 APPFOLIO
- 2024-04-05 Listed for Rent $775 APPFOLIO
- 2024-04-05 Rental Removed $775 APPFOLIO
- 2024-03-13 Rental Removed $775 APPFOLIO
- 2024-03-13 Listed for Rent $775 APPFOLIO
- 2024-01-31 Price Changed $820 APPFOLIO
- 2024-01-24 Price Changed $850 APPFOLIO
- 2024-01-18 Listed for Rent $900 APPFOLIO
- 2023-10-06 Rental Removed $800 APPFOLIO
- 2023-10-02 Listed for Rent $800 APPFOLIO
- 2022-08-20 Pending — West Penn MLS
- 2022-08-19 Sold (MLS) $450,000 West Penn MLS
- 2022-06-23 Contingent — West Penn MLS
- 2022-06-13 Listed $475,000 West Penn MLS
- 2018-05-22 Sold (Public Records) $303,460 Public Records
- 2011-01-05 Sold (Public Records) $220,000 Public Records
- 1989-09-26 Sold (Public Records) $150,000 Public Records
Property tax history
+4.2%/yrLatest (2026): $7,761 · +2.2% YoY. Source: county tax records.
Cash-flow waterfall
monthlySold comps — $/sqft
last 12 mo · ≤1 miLoading sold comps…