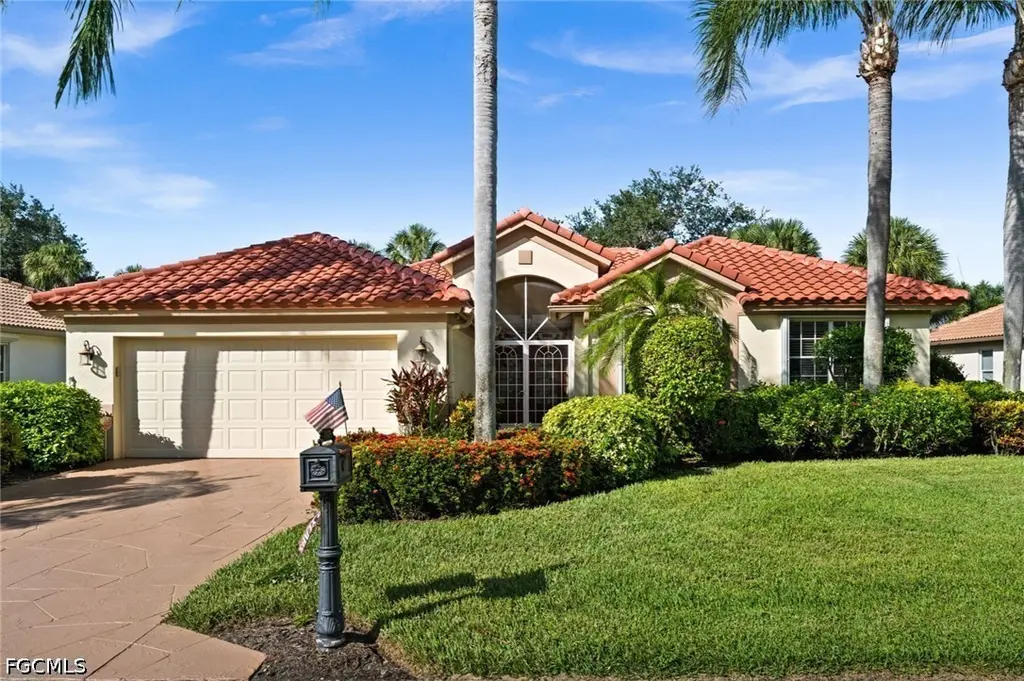
11175 Callaway Greens Dr · Gateway, FL
Flood risk 1/10 · Minimal
- FEMA flood zone
- X (unshaded)
- Chance of flooding over 30 yrs
- 0.0%
- Est. flood insurance / yr
- $507 – $1,088
Fire risk 3/10 · Minor
- Est. fire insurance / yr
- $947 – $1,759
Heat risk 9/10 · Severe
- Hot days now (above 107°F)
- 7 days/yr
- Hot days in 30 yrs
- 26 days/yr
Wind risk 10/10 · Severe
- Chance of severe wind over 30 yrs
- 99.0%
Air-quality risk 2/10 · Minimal
- Unhealthy air days now
- 1 days/yr
- Unhealthy air days in 30 yrs
- 1 days/yr
Risk factors via First Street. Map © Google.
Why this score? — see what drove the C- grade
The composite is a weighted blend of 9 inputs, each scored 0–100. Each bar is that input's sub-score; the figure is the points it added to the 100-point composite (weight × sub-score).
- Cash flow +17.8/30.0
- ARV discount +10.9/15.0
- 1% rule +6.0/10.0
- DSCR +5.6/10.0
- Schools +4.1/10.0
- Livability +3.5/5.0
- Rent growth +2.6/5.0
- Condition / age +2.5/5.0
- Appreciation +0.0/10.0
$490,000
🖨 Deal sheet (PDF) 📄 Offer letter ✓ Due diligence
Listing remarks MLS
Magnificent Waterfront Home With Full Extended Pool Lanai. Loads Ofupgrades Including Tile Throughout, Electric Rollsafe Shutters, Built-inoffice/Den And More. Price Includes A $30,000 Golf Equity Membership. (Limited To 375 Members. ) This Is A Fantastic House!
Key facts
- Gated community
- Vaulted ceiling
- Open floorplan
Tags
Property features AI
Finance
- Other: Community of 193 units
- Financial info: Pets allowed (call/conditional)
- HOA & community: Homeowners association with quarterly fee; Association covers management, cable TV, internet, irrigation water, grounds maintenance and security; Community amenities include pool, basketball court, dog park and sidewalks; Gated community
Exterior
- Parking: Attached garage with garage door opener; 2 covered garage spaces
- Security: Owned security system; Security gate with guard; Gated community; Smoke detector(s)
- Utilities: Public water; Public sewer; Cable available; High-speed internet available; Underground utilities
- Home design: Single-story; Entry on level 1; Resale property; Faces southwest; Property in a PUD
- Construction: Block, concrete and stucco construction; Tile roof; Built on a concrete foundation
- Exterior features: Lanai/porch (screened); Sprinkler/irrigation system; Shutters (manual); Rectangular lot; Northeast exposure; Lake view / waterfront
Interior
- Kitchen: Dishwasher; Disposal; Microwave; Range; Self-cleaning oven; Refrigerator; Breakfast bar; Pantry
- Bedrooms: Split bedroom layout
- Flooring: Tile flooring
- Bathrooms: 2 full bathrooms; Dual sinks; Separate shower; Bathtub
- Heating & cooling: Central heating (electric); Central air conditioning (electric); Ceiling fan(s)
- Interior features: Furnished; Breakfast bar; Bathtub; Dual sinks; Living/dining room; Pantry; Separate shower; Cable TV; Walk-in closet(s); Window treatments; Split bedrooms; Single-hung and sliding windows
- Laundry & utility: Washer and dryer included; Inside laundry with laundry tub
Neighborhood map
What this means for you Summary
Snapshot
- This is a 3-bed/2.0-bath single-family listed at $490k.
Deal economics
- At list price, monthly cash flow is $404 ($5k/yr) — positive.
- The deal already cash-flows at list — no discount required.
- Meets the 1% rule at list price ($5k rent vs $490k).
- Cap rate 7.3% vs local median 3.5% in Gateway — top-decile yield for the area; either an underpriced asset or a hidden risk that comps aren't pricing in. Stress-test before assuming the spread holds.
Location & tenants
- Location reads 69/100 on livability (#477 in FL) — a middle-class / working-renter tenant base. Strengths: crime A+, employment A+, housing A+; Watch: cost of living C-, amenities F, commute F.
- Lee (suburban): math 47% / reading 50% proficiency, ranked #42 of 73 in FL (top 58%) — families likely to look elsewhere, expect single-tenant / working-renter base with shorter leases.
- Market conditions: Rents flat; 811 active listings in the ZIP; 40 comparable units currently listed for rent nearby; rentals at typical pace (median 24d on market — plan ~3-4 weeks tenant-placement turnaround); high-income renter base; 15,411 units permitted in Lee County in 2024 (4,686 in 5+ unit buildings).
- At $5,374/mo this rent would consume 58% of the median local household income ($110k/yr) (locally 276% of renters already pay >50% of income on rent) — very limited rent-growth headroom before tenants either downsize or default.
Forward outlook
- Local home prices are declining (-3.0%/yr); year-one equity from $3k of loan paydown is wiped out by about $15k of value loss. Plan a longer hold.
- Lee County population projected at +44% by 2050 — long-run rental-demand tailwind backs the buy-and-hold thesis.
Negotiation context
- Only 10 days on market — expect competitive offers; lowballing is unlikely to land.
- Current owner paid $282k; list at $490k implies a 74% gain — meaningful room to come down on a strong offer.
Risks & watch-outs
- Climate carrying-cost: severe wind risk, 99% chance of damaging wind over 30y; extreme-heat days projected 7→26/yr by 2055 (HVAC capex compounding) — expect insurance premiums to compound above CPI over the hold.
Questions for the listing agent
- What does the HOA fee cover, when was the last increase, and are there any pending special assessments or reserve-fund shortfalls?
- Is there a deadline driving the sale (1031 exchange, divorce, estate, relocation)? That informs how much negotiation room exists.
- Schools are B-rated — typically a magnet for longer-tenancy family renters. What's the average tenant stay here, and is there a school-zone premium baked into asking?
- What's the average days-on-market for RENTAL listings here right now (not sales)? A rising rental-DOM trend means longer vacancies and softer asking-rent achievability than the comps imply.
- What's the recent tenant-quality profile in this submarket — average credit score on applications, eviction rate, late-payment / NSF rate, and stable-employment percentage? A property-management company in the area should have these aggregated.
- How much new for-sale + rental construction is in the pipeline within 1–3 miles? Heavy new supply typically softens prices + rents 12–24 months out; constrained supply supports both.
Investment metrics
- 1% rule
- 1.10% ✓
- Cap rate
- 7.28%
- Cash-on-cash
- 3.53%
- DSCR
- 1.16
- GRM
- 7.6
CMA / ARV
- ARV (on-the-fly)
- $529,620
- Comps found
- 12
Show comp detail 12 sales within ~0.75 mi
| Address | Dist | Beds/Ba | Sqft | Sold | Price | $/sf | Match |
|---|---|---|---|---|---|---|---|
| 11277 Callaway Greens Dr | 0.07mi | 3/2.0 | 1,660 (-9%) | 3mo | $490,000 | $295 | 80 |
| 11543 Golden Oak Ter | 0.36mi | 2/2.0 (-1) | 1,917 (+5%) | 1mo | $400,000 | $209 | 69 |
| 12560 Lake Run Dr | 0.47mi | 3/2.0 | 1,931 (+6%) | 4mo | $550,000 | $285 | 64 |
| 11425 Shady Blossom Dr | 0.28mi | 4/3.0 (+1) | 2,032 (+12%) | 1mo | $550,000 | $271 | 57 |
| 10614 Pistoia Dr | 0.54mi | 3/3.0 | 2,032 (+12%) | 5mo | $745,000 | $367 | 47 |
| 11148 Shady Lake Run | 0.17mi | 4/3.0 (+1) | 2,032 (+12%) | 21mo | $530,000 | $261 | 46 |
| 11974 Westmoreland Way | 0.67mi | 3/2.0 | 1,574 (-14%) | 1mo | $457,500 | $291 | 45 |
| 12421 Eagle Pointe Cir | 0.71mi | 3/2.5 | 2,021 (+11%) | 1mo | $350,000 | $173 | 45 |
| 11591 Shady Blossom Dr | 0.51mi | 4/3.0 (+1) | 2,032 (+12%) | 3mo | $565,000 | $278 | 45 |
| 10618 Pistoia Dr | 0.53mi | 4/3.0 (+1) | 2,032 (+12%) | 16mo | $727,500 | $358 | 33 |
| 11849 Grand Isles Ln | 0.64mi | 4/3.0 (+1) | 2,060 (+13%) | 14mo | $708,500 | $344 | 28 |
| 11855 Cantanzaro Ct | 0.69mi | 3/3.0 | 2,032 (+12%) | 22mo | $595,000 | $293 | 26 |
Match score weights: distance 35% · size 25% · config 20% · recency 20%. Top-matched comps best support the ARV.
Projected returns pro-forma
-3.0% appreciation · 0.37% rent growth · sell at horizon
- IRR
- -14.0%
- Equity multiple
- 0.51×
- Total profit
- $-67,187
- Equity at exit
- $73,061
- IRR
- -10.8%
- Equity multiple
- 0.43×
- Total profit
- $-77,880
- Equity at exit
- $42,366
Cash invested: $137,200 (down + closing). Projections, not guarantees.
Landlord ↔ Tenant lean methodology
- Overall (STATE)
- 87 Strongly Landlord-Friendly
- State Florida
- 87 Strongly Landlord-Friendly · R+3
- County
- — inherits STATE
- City
- — inherits STATE
ZIP-level market 33913
- Home prices YoY
- -10.3%
- Rents YoY
- 0.4%
- Active inventory
- 811
- Price-to-rent
- 7.6×
Monthly cashflow live
- Estimated rent
- $5,374 high interval (Pro) →
- Mortgage (P&I)
- −$2,570
- Tax from tax record
- −$608 /mo · $7,300/yr
- Insurance
- −$204
- HOA
- −$460
- Vacancy / Maint / Mgmt
- −$1,129
- Net cashflow
- $404
Break-even live
Sensitivity live
| Price | -10% $681 | -5% $542 | +0% $404 | +5% $265 | +10% $126 |
|---|---|---|---|---|---|
| Rent | -10% $-21 | -5% $191 | +0% $404 | +5% $616 | +10% $828 |
| Rate | -1.0pp $650 | -0.5pp $528 | base $404 | +0.5pp $277 | +1.0pp $148 |
UW: 25.0% down · 7.5% · 30yr · 1.5% tax · 5.0% vac · 8.0% maint · 8.0% mgmt
Financing live
Cash to close
- Down payment
- $122,500
- Closing costs
- $14,700
- Reserves months
- —
- Total cash needed
- —
Loan-product check · same deal, 3 products live
Conventional
25% down · 7.5% · 30yr
- Down + closing
- —
- Monthly P&I
- —
- Monthly cashflow
- —
- DSCR
- —
- Eligible?
- —
Personal DTI + credit; lowest rate.
DSCR
20% down · 8.5% · 30yr
- Down + closing
- —
- Monthly P&I
- —
- Monthly cashflow
- —
- DSCR
- —
- Eligible?
- —
No personal income docs; deal must DSCR.
Hard money
10% down · 12.0% · 12mo
- Down + closing
- —
- Monthly P&I
- —
- Monthly cashflow
- —
- DSCR
- —
- Eligible?
- —
Short-term bridge; refi at stabilization.
Rent comps 40 comps
| Address | Beds | Baths | Sqft | Rent | $/sqft | DOM | Units | Dist |
|---|---|---|---|---|---|---|---|---|
| 11442 Tiverton Trce Fort Myers, FL | 3.0 | 2.0 | 2010 | $9,500 | $4.73 | 24d | 1 | 0.46mi |
| 11343 Tiverton Trce Fort Myers, FL | 2.0 | 2.0 | 1685 | $4,000 | $2.37 | 4d | 1 | 0.48mi |
| 12021 Brassie Cir #201 Fort Myers, FL | 3.0 | 2.0 | 2343 | $2,700 | $1.15 | 4d | 1 | 0.60mi |
| 10529 Casella Way #102 Fort Myers, FL | 3.0 | 2.0 | 1722 | $4,500 | $2.61 | 24d | 1 | 0.68mi |
| 10820 Palazzo Way #203 Fort Myers, FL | 2.0 | 2.0 | 1235 | $5,400 | $4.37 | 24d | 1 | 0.71mi |
| 10520 Casella Way #101 Fort Myers, FL | 3.0 | 2.0 | 1722 | $7,000 | $4.07 | 24d | 1 | 0.73mi |
| 11230 Suffield St Fort Myers, FL | 2.0 | 2.0 | 1560 | $8,500 | $5.45 | 24d | 1 | 0.76mi |
| 11701 Avingston Ter Fort Myers, FL | 2.0 | 2.0 | 1553 | $5,500 | $3.54 | 15d | 1 | 0.78mi |
| 10791 Palazzo Way #301 Fort Myers, FL | 2.0 | 2.0 | 1390 | $5,300 | $3.81 | 24d | 1 | 0.79mi |
| 10455 Casella Way #202 Fort Myers, FL | 3.0 | 2.0 | 2319 | $7,200 | $3.10 | 24d | 1 | 0.80mi |
| 10751 Palazzo Way #103 Fort Myers, FL | 2.0 | 2.0 | 1235 | $5,000 | $4.05 | 24d | 1 | 0.90mi |
| 12797 Vista Pine Cir Fort Myers, FL | 4.0 | 2.0 | 2146 | $2,705 | $1.26 | 4d | 1 | 0.93mi |
| 11900 Grosseto Ct Fort Myers, FL | 2.0 | 2.0 | 1713 | $6,000 | $3.50 | 19d | 1 | 0.94mi |
| 11900 Grosseto Ct Fort Myers, FL | 2.0 | 2.0 | 1713 | $5,500 | $3.21 | 24d | 1 | 0.94mi |
| 12525 Astor Pl Unit 1049698P Fort Myers, FL | 3.0 | 2.0 | 2174 | $6,065 | $2.79 | 15d | 1 | 0.95mi |
| 10284 Livorno Dr Fort Myers, FL | 3.0 | 3.0 | 2202 | $7,000 | $3.18 | 4d | 1 | 0.95mi |
| 11225 Lithgow Ln Fort Myers, FL | 2.0 | 2.0 | 2153 | $8,000 | $3.72 | 24d | 1 | 0.96mi |
| 10711 Palazzo Way Unit 203 Fort Myers, FL | 2.0 | 2.0 | 1257 | $5,300 | $4.22 | 22d | 1 | 0.96mi |
| 10711 Palazzo Way Fort Myers, FL | 2.0 | 2.0 | 1257 | $3,900 | $3.10 | 16d | 2 | 0.96mi |
| 10879 Rutherford Rd Fort Myers, FL | 2.0 | 2.0 | 1566 | $3,500 | $2.23 | 24d | 1 | 0.98mi |
| 12482 Kentwood Ave Fort Myers, FL | 3.0 | 2.5 | 2251 | $4,900 | $2.18 | 19d | 1 | 0.98mi |
| 11012 Castlereagh St Fort Myers, FL | 3.0 | 3.0 | 2517 | $12,000 | $4.77 | 24d | 1 | 0.98mi |
| 10700 Palazzo Way #201 Fort Myers, FL | 2.0 | 2.0 | 1390 | $5,000 | $3.60 | 22d | 1 | 1.00mi |
| 12090 Summergate Cir #101 Fort Myers, FL | 3.0 | 2.0 | 1231 | $1,825 | $1.48 | 24d | 1 | 1.06mi |
| 10730 Cetrella Dr Fort Myers, FL | 3.0 | 2.0 | 1558 | $6,900 | $4.43 | 24d | 1 | 1.12mi |
| 10952 Clarendon St Fort Myers, FL | 2.0 | 2.0 | 1582 | $4,000 | $2.53 | 24d | 1 | 1.14mi |
| 10535 Carolina Willow Dr Fort Myers, FL | 3.0 | 2.0 | 1290 | $2,300 | $1.78 | 22d | 1 | 1.15mi |
| 11801 Pine Timber Ln Fort Myers, FL | 3.0 | 2.5 | 2508 | $8,000 | $3.19 | 24d | 1 | 1.16mi |
| 10714 Cetrella Dr Fort Myers, FL | 2.0 | 2.0 | 1227 | $5,500 | $4.48 | 24d | 1 | 1.17mi |
| 12096 Ledgewood Cir Fort Myers, FL | 3.0 | 2.0 | 1798 | $2,850 | $1.59 | 24d | 1 | 1.18mi |
| 10900 Glenhurst St Fort Myers, FL | 2.0 | 2.0 | 1355 | $2,200 | $1.62 | 3d | 1 | 1.21mi |
| 11082 Lakeland Cir Fort Myers, FL | 3.0 | 2.0 | 1883 | $2,095 | $1.11 | 24d | 1 | 1.21mi |
| 10702 Cetrella Dr Fort Myers, FL | 2.0 | 2.0 | 1347 | $5,500 | $4.08 | 24d | 1 | 1.21mi |
| 11081 Lakeland Cir Fort Myers, FL | 4.0 | 2.0 | 2136 | $2,600 | $1.22 | 24d | 1 | 1.21mi |
| 10700 Cetrella Dr Fort Myers, FL | 2.0 | 2.0 | 1227 | $3,500 | $2.85 | 24d | 1 | 1.22mi |
| 11170 Lakeland Cir Fort Myers, FL | 3.0 | 2.0 | 1571 | $1,975 | $1.26 | 15d | 1 | 1.22mi |
| 11761 Pinewood Lakes Dr Fort Myers, FL | 4.0 | 3.0 | 2528 | $3,200 | $1.27 | 4d | 1 | 1.22mi |
| 10908 Clarendon St Fort Myers, FL | 3.0 | 2.0 | 1433 | $8,000 | $5.58 | 24d | 1 | 1.23mi |
| 10908 Clarendon St Fort Myers, FL | 3.0 | 2.0 | 1433 | $8,000 | $5.58 | 15d | 1 | 1.23mi |
| 12469 Pebble Stone Ct Fort Myers, FL | 4.0 | 3.0 | 2368 | $2,750 | $1.16 | 4d | 1 | 1.25mi |
HOA detail
- Monthly dues
- $460 · $5,520/yr
- Likely covers
- waterelectricpool
Listing history 8 events
-
2026-06-18days on market $490,000 Active 10 DOM
-
2026-06-17days on market $490,000 Active 9 DOM
-
2026-06-16days on market $490,000 Active 8 DOM
-
2026-06-15days on market $490,000 Active 7 DOM
-
2026-06-13days on market $490,000 Active 5 DOM
-
2026-06-10days on market $490,000 Active 2 DOM
-
2026-06-08remarks 699-char remark
-
2026-06-08$490,000 Active 1 DOM
ⓘ Source: listings_history table (triggers on properties + properties_extension) + one-shot
backfill from property_details.listing_events for pre-trigger history.
Tax reassessment forecast FL · Resets to sale price
- Current annual tax
- $7,300 · $608/mo
- Projected year-2 tax
- $7,300 · $608/mo
- Expected delta
- $0/yr ($0/mo · 0.0%)
ⓘ Screening estimate from a state-policy table — verify with the county assessor before closing.
Climate risk First Street
- Flood 1/10 Low FEMA zone X (unshaded) · 0% chance over 30 yrs
- Wildfire 3/10 Moderate
- Heat 9/10 Extreme 7 d/yr ≥107°F today · 26 d/yr by 30 yrs out
- Wind 10/10 Extreme 99% chance of damaging wind over 30 yrs
- Air quality 2/10 Low 1 unhealthy d/yr today · 1 by 30 yrs out
Nearby sold comps map
Loading sold comps map…
Walkable amenities ~0.75 mi
Loading nearby amenities…
Taxation est. · year 1
- Rental income
- $64,494
- − Mortgage interest
- −$27,448
- − Property taxes
- −$7,300
- − Insurance
- −$2,450
- − Repairs & maintenance
- −$5,160
- − Management
- −$5,160
- − HOA
- −$5,520
- − Depreciation
- −$14,255
- Taxable loss
- −$2,798
- Est. tax savings @ 24.0%
- +$671
- After-tax cash flow
- $5,516/yr
For passive investors: Depreciation is non-cash, so a rental often shows a tax loss while cash-flowing — sheltering income. Rental losses are passive: they offset passive income freely, and up to $25,000/yr can offset ordinary (W-2) income if you actively participate and your MAGI is under $100k (phasing out to $0 by $150k); unused losses carry forward. On sale, claimed depreciation is recaptured at up to 25%, and gains may owe capital-gains tax (a 1031 exchange can defer both). Figures are a year-1 estimate at your 24.0% rate — not tax advice; consult a CPA.
Schools (NCES district)
- District
- Lee
- NCES district ID
- 1201080
- Math proficiency
- 47% ▼ -11.00%
- Reading proficiency
- 50% ▼ -4.00%
- Median HH income
- $49,518
- Composite
- 41.49/100
- National rank
- #3458
- State rank
- #42 of 73 in FL
Livability — Gateway
- Score
- 69/100
- State rank
- #477
- US rank
- #8703
Category grades
Schools grade is shown separately in the Schools card above.
Census & demographics
- Census place
- Gateway, FL
- County
- Lee County · 788,662 people
- Metro
- Cape Coral-Fort Myers, FL
- Population (ZIP)
- 31,538
- Household income
- $110,373
- Rent vs Own
- Severe rent burden
- 276.0
Population outlook (Lee County) Hauer SSP2
- Today (2025)
- 871,946 people
- By 2030
- 955,468 · +9.6%
- By 2040
- 1,113,587 · +27.7%
- By 2050
- 1,256,891 · +44.1%
- By 2075
- 1,560,270 · +78.9%
- By 2100
- 1,726,848 · +98.0%
Race, ethnicity, and origin ACS 2023
- Neighborhood character
- Predominantly White (74%)
- Race & ethnicity
- White 74% Hispanic / Latino 13% Two or more races 11% Black 5% Asian 2%
- Hispanic origin (detail)
- Mexican 3% Puerto Rican 3% Cuban 2%
- Common ancestry
- Romanian 5% Lithuanian 3% Slovak 2%
- Foreign-born
- 14% · Canada, Vietnam, China
- Languages at home
- 84% English-only · Spanish 10% Other Indo-European 2% French/Haitian/Cajun 2%
Political lean MEDSL · Lee
- 2024 margin
- Strong R (+28.4) · D 35.5% · R 63.9%
- 2008→2024 swing
- -18.0pp toward R · 2008: -10.4pp · 2024: -28.4pp
- All cycles
- 2024: R+28.4 2020: R+19.2 2016: R+20.4 2012: R+16.6 2008: R+10.4
Not yet ingested
- Civics
- —
Market trends
- HPI YoY
- ▼ -25.45%
- Current HPI
- 221.7115
- Rent YoY
- ▲ 0.37%
- Metro
- Cape Coral-Fort Myers, FL
- State GDP YoY
- ▲ 3.28%
- F500 in state
- 36
Industry mix (Fortune 500 HQ in FL)
| Industry | F500 HQs | Revenue |
|---|---|---|
| Industrial Technology | 2 | $29B |
|
||
| Insurance | 2 | $17B |
|
||
| Retail | 1 | $60B |
|
||
| Technology Distribution | 1 | $58B |
|
||
| Homebuilding | 1 | $35B |
|
||
| Technology Manufacturing | 1 | $35B |
|
||
Price history
-94.6% since first listed5 events — show timeline
- 2026-06-08 Listed $490,000 FORTMLS
- 2015-03-02 Price Changed $279,000 FORTMLS
- 2004-05-17 Sold (Public Records) $282,000 Public Records
- 2004-04-30 Sold (MLS) $282,000 FORTMLS
- 1982-11-01 Sold (Public Records) $9,000,000 Public Records
Property tax history
+5.7%/yrLatest (2025): $7,300 · +2.8% YoY. Source: county tax records.
Cash-flow waterfall
monthlySold comps — $/sqft
last 12 mo · ≤1 miLoading sold comps…