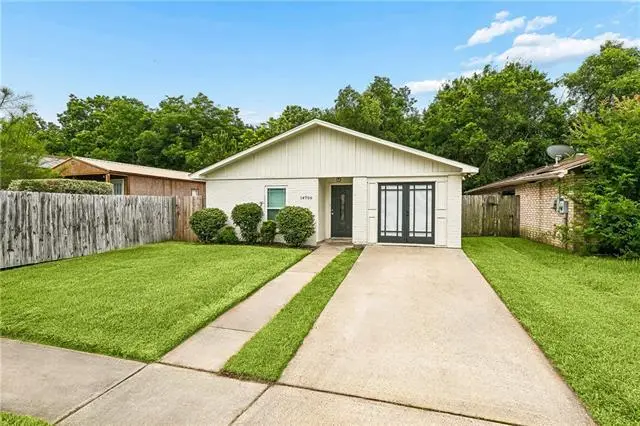
14706 Emory Rd · New Orleans, LA
Flood risk 8/10 · Major
- FEMA flood zone
- X (shaded)
- Chance of flooding over 30 yrs
- 0.6%
- Est. flood insurance / yr
- $507 – $1,088
Fire risk 3/10 · Minor
- Est. fire insurance / yr
- $1,269 – $2,357
Heat risk 10/10 · Severe
- Hot days now (above 107°F)
- 7 days/yr
- Hot days in 30 yrs
- 22 days/yr
Wind risk 10/10 · Severe
- Chance of severe wind over 30 yrs
- 99.0%
Air-quality risk 3/10 · Minor
- Unhealthy air days now
- 2 days/yr
- Unhealthy air days in 30 yrs
- 3 days/yr
Risk factors via First Street. Map © Google.
Why this score? — see what drove the D- grade
The composite is a weighted blend of 9 inputs, each scored 0–100. Each bar is that input's sub-score; the figure is the points it added to the 100-point composite (weight × sub-score).
- Cash flow +17.1/30.0
- DSCR +5.3/10.0
- 1% rule +4.5/10.0
- Livability +4.0/5.0
- Rent growth +2.5/5.0
- Condition / age +2.5/5.0
- ARV discount +2.0/15.0
- Schools +1.6/10.0
- Appreciation +0.0/10.0
$150,000
🖨 Deal sheet (PDF) 📄 Offer letter ✓ Due diligence
Listing remarks MLS
Welcome home to this charming and light-filled residence in New Orleans East! Step inside to a spacious family room featuring a vaulted ceiling, elegant chandelier, and decorative painted-brick fireplace that creates a warm focal point for the home. This versatile space could easily function as a dining area and flows seamlessly into the kitchen, where stainless steel appliances and an open layout make everyday living and entertaining easy. An additional living area offers endless possibilities as a sunroom, den, home office, or playroom, with large French doors that fill the space with natural light. A generously sized laundry room provides ample storage and added convenience. The primary suite serves as a comfortable retreat, complete with a cathedral ceiling and private ensuite bath. Two additional bedrooms and a full bathroom provide flexibility for family, guests, or work-from-home needs. Outside, the fenced backyard offers privacy and plenty of room to create your ideal outdoor oasis, whether you envision gardening, entertaining, or simply relaxing. Additional highlights include no carpet throughout the home, an X flood zone designation, and a new AC unit installed in August 2024 for added peace of mind. Conveniently located near Lake Pontchartrain, residents can enjoy the area's coastal atmosphere and easy access to outdoor recreation. Nearby parks, playgrounds, fishing ponds, fitness areas, picnic spaces, and other community amenities make it easy to embrace an active lifestyle while enjoying all that New Orleans East has to offer.
Key facts
- Large french doors
- Open layout
- Spacious family room
Tags
Property features AI
Exterior
- Parking: Driveway; Off-street parking; Two parking spaces
- Security: Smoke detectors
- Utilities: Public water; Public sewer
- Home design: Single-story; Brick construction; Shingle roof; Slab foundation; Property condition: Excellent
- Construction: Built with brick; Slab foundation; Shingle roof
- Exterior features: City lot; Rectangular lot; Lot dimensions: 40' x 91' x 41' x 91'
Interior
- Kitchen: Dishwasher; Microwave; Oven; Refrigerator
- Bathrooms: 2 full bathrooms
- Heating & cooling: Central heating; Central air conditioning; Water heater (energy efficient)
- Interior features: Attic; Ceiling fans; Carbon monoxide detector; Pull-down attic stairs; Stainless steel appliances
- Laundry & utility: Washer hookup; Dryer hookup
Neighborhood map
What this means for you Summary
Snapshot
- This is a 3-bed/2.0-bath single-family listed at $150k.
Deal economics
- At list price, monthly cash flow is $37 ($443/yr) — positive.
- The deal already cash-flows at list — no discount required.
- To meet the 1% rule (rent ≥ 1% of price), the offer needs to be $143k (4.8% below list).
- Recommended offer: $143k (4.8% below list) — sets the bar for 1% rule.
- Cap rate 7.1% vs local median 4.3% in New Orleans — top-decile yield for the area; either an underpriced asset or a hidden risk that comps aren't pricing in. Stress-test before assuming the spread holds.
Location & tenants
- Location reads 81/100 on livability (#3 in LA, #1,383 nationally) — a professional / high-income tenant draw. Strengths: amenities A+, commute A+, health & safety A+; Watch: crime C-, employment D.
- Orleans Parish (urban): math 11% / reading 27% proficiency, ranked #69 of 98 in LA (top 70%) — low school quality limits family demand, transient renter base, plan for 1-2y turnover; 68% free/reduced lunch — lower-income household profile, screen leases tightly.
- Zoned schools: Benjamin Franklin Elem. Math And Science (math 12% / reading 23%, grade F, #479 of 646 statewide, top 75%, 747 students, 98% FRL, charter) — zoned schools average 98% FRL vs 68% district-wide (30 pts higher); higher-poverty schools than district average — tighter screening recommended.
- Market conditions: 106 active listings in the ZIP; 14 comparable units currently listed for rent nearby; rentals at typical pace (median 26d on market — plan ~3-4 weeks tenant-placement turnaround); 710 units permitted in Orleans Parish in 2024 (244 in 5+ unit buildings).
Forward outlook
- Local home prices are declining (-3.0%/yr); year-one equity from $1k of loan paydown is wiped out by about $4k of value loss. Plan a longer hold.
- Orleans County population projected at +61% by 2050 — long-run rental-demand tailwind backs the buy-and-hold thesis.
Negotiation context
- It's been on market 17 days — a 2% lower offer ($148k) is reasonable based on typical stale-listing flexibility.
- 12 sale attempts since 33y ago with the ask held roughly flat each time — persistent listings suggest the price (not the market) is what's stuck; bring a comps-based counter.
Risks & watch-outs
- Watch-outs: flood insurance adds $66/mo.
- Climate carrying-cost: severe flood risk; severe wind risk, 99% chance of damaging wind over 30y; extreme-heat days projected 7→22/yr by 2055 (HVAC capex compounding) — expect insurance premiums to compound above CPI over the hold.
Questions for the listing agent
- What's the actual annual flood-insurance premium (NFIP or private), and is the property in a SFHA with mandatory coverage?
- Is there a deadline driving the sale (1031 exchange, divorce, estate, relocation)? That informs how much negotiation room exists.
- The area grade is low — what's the realistic commute time and amenity access for the typical tenant pool here? Any planned neighborhood developments (good or bad) we should know about?
- What's the average days-on-market for RENTAL listings here right now (not sales)? A rising rental-DOM trend means longer vacancies and softer asking-rent achievability than the comps imply.
- What's the recent tenant-quality profile in this submarket — average credit score on applications, eviction rate, late-payment / NSF rate, and stable-employment percentage? A property-management company in the area should have these aggregated.
- How much new for-sale + rental construction is in the pipeline within 1–3 miles? Heavy new supply typically softens prices + rents 12–24 months out; constrained supply supports both.
Investment metrics
- 1% rule
- 0.95% ✗
- Cap rate
- 7.12%
- Cash-on-cash
- 2.95%
- DSCR
- 1.13
- GRM
- 8.8
CMA / ARV
- ARV (on-the-fly)
- $133,763
- Comps found
- 12
Show comp detail 12 sales within ~0.75 mi
| Address | Dist | Beds/Ba | Sqft | Sold | Price | $/sf | Match |
|---|---|---|---|---|---|---|---|
| 7562 Forum Blvd | 0.12mi | 4/2.0 (+1) | 1,380 (+0%) | 1mo | $98,000 | $71 | 89 |
| 14737 Emory Rd | 0.05mi | 3/2.0 | 1,344 (-2%) | 10mo | $145,000 | $108 | 85 |
| 7663 Stonewood St | 0.26mi | 3/2.0 | 1,375 (-0%) | 7mo | $90,000 | $65 | 82 |
| 7633 Stonewood St | 0.26mi | 3/2.0 | 1,267 (-8%) | 2mo | $125,000 | $99 | 72 |
| 14754 Beekman. Rd | 0.20mi | 4/2.0 (+1) | 1,500 (+9%) | 1mo | $50,000 | $33 | 70 |
| 14812 Emory Rd | 0.09mi | 3/2.0 | 1,554 (+13%) | 10mo | $150,000 | $97 | 66 |
| 8014 Buffalo Rd | 0.28mi | 4/2.0 (+1) | 1,506 (+9%) | 7mo | $170,000 | $113 | 61 |
| 7500 Avon Park Blvd | 0.25mi | 3/2.0 | 1,238 (-10%) | 15mo | $80,000 | $65 | 58 |
| 8016 W Little Woods Dr | 0.26mi | 3/2.0 | 1,250 (-9%) | 20mo | $70,000 | $56 | 56 |
| 7540 Pineridge St | 0.41mi | 3/2.0 | 1,480 (+7%) | 18mo | $120,000 | $81 | 54 |
| 7009 Pinebrook Dr | 0.74mi | 3/2.0 | 1,400 (+2%) | 11mo | $169,900 | $121 | 53 |
| 7725 Tricia Ct | 0.67mi | 3/2.0 | 1,546 (+12%) | 5mo | $150,000 | $97 | 44 |
Match score weights: distance 35% · size 25% · config 20% · recency 20%. Top-matched comps best support the ARV.
Projected returns pro-forma
-3.0% appreciation · 3.0% rent growth · sell at horizon
- IRR
- -14.6%
- Equity multiple
- 0.48×
- Total profit
- $-21,899
- Equity at exit
- $22,365
- IRR
- -5.8%
- Equity multiple
- 0.62×
- Total profit
- $-15,817
- Equity at exit
- $12,969
Cash invested: $42,000 (down + closing). Projections, not guarantees.
Landlord ↔ Tenant lean methodology
- Overall (STATE)
- 90 Strongly Landlord-Friendly
- State Louisiana
- 90 Strongly Landlord-Friendly · R+12
- County
- — inherits STATE
- City
- — inherits STATE
ZIP-level market 70128
- Home prices YoY
- -5.9%
- Active inventory
- 106
- Price-to-rent
- 8.8×
Monthly cashflow live
- Estimated rent
- $1,427 high interval (Pro) →
- Mortgage (P&I)
- −$787
- Tax from tax record
- −$175 /mo · $2,102/yr
- Insurance
- −$62
- Flood insurance flood zone
- −$66 /mo · $798/yr
- HOA
- −$0
- Lot rent
- −$0
- Vacancy / Maint / Mgmt
- −$300
- Net cashflow
- $37
Break-even live
Sensitivity live
| Price | -10% $122 | -5% $79 | +0% $37 | +5% $-6 | +10% $-48 |
|---|---|---|---|---|---|
| Rent | -10% $-76 | -5% $-19 | +0% $37 | +5% $93 | +10% $150 |
| Rate | -1.0pp $112 | -0.5pp $75 | base $37 | +0.5pp $-2 | +1.0pp $-41 |
UW: 25.0% down · 7.5% · 30yr · 1.5% tax · 5.0% vac · 8.0% maint · 8.0% mgmt
Financing live
Cash to close
- Down payment
- $37,500
- Closing costs
- $4,500
- Reserves months
- —
- Total cash needed
- —
Loan-product check · same deal, 3 products live
Conventional
25% down · 7.5% · 30yr
- Down + closing
- —
- Monthly P&I
- —
- Monthly cashflow
- —
- DSCR
- —
- Eligible?
- —
Personal DTI + credit; lowest rate.
DSCR
20% down · 8.5% · 30yr
- Down + closing
- —
- Monthly P&I
- —
- Monthly cashflow
- —
- DSCR
- —
- Eligible?
- —
No personal income docs; deal must DSCR.
Hard money
10% down · 12.0% · 12mo
- Down + closing
- —
- Monthly P&I
- —
- Monthly cashflow
- —
- DSCR
- —
- Eligible?
- —
Short-term bridge; refi at stabilization.
Rent comps 14 comps
| Address | Beds | Baths | Sqft | Rent | $/sqft | DOM | Units | Dist |
|---|---|---|---|---|---|---|---|---|
| 14724 Emory Rd New Orleans, LA | 3.0 | 2.0 | 1400 | $1,500 | $1.07 | 26d | 1 | 0.03mi |
| 14509 Duane Rd New Orleans, LA | 2.0 | 1.0 | 1150 | $1,518 | $1.32 | 26d | 1 | 0.08mi |
| 14900 Curran Rd New Orleans, LA | 3.0 | 2.0 | 1221 | $1,250 | $1.02 | 26d | 1 | 0.10mi |
| 14530 Duane Rd New Orleans, LA | 3.0 | 1.0 | 1150 | $1,450 | $1.26 | 5d | 1 | 0.11mi |
| 14530 Duane Rd New Orleans, LA | 3.0 | 1.0 | 1150 | $1,450 | $1.26 | 5d | 1 | 0.11mi |
| 7843 Sail St New Orleans, LA | 3.0 | 1.5 | 1500 | $1,200 | $0.80 | 26d | 1 | 0.12mi |
| 7808 Sun St New Orleans, LA | 4.0 | 1.5 | 1500 | $1,950 | $1.30 | 26d | 1 | 0.12mi |
| 7849 Sail St New Orleans, LA | 3.0 | 2.0 | 1395 | $1,200 | $0.86 | 26d | 1 | 0.13mi |
| 7851 Sail St New Orleans, LA | 3.0 | 2.0 | 1395 | $1,200 | $0.86 | 26d | 1 | 0.13mi |
| 7825 Star St New Orleans, LA | 2.0 | 1.0 | 982 | $1,250 | $1.27 | 26d | 1 | 0.20mi |
| 7505 Shorewood Blvd New Orleans, LA | 4.0 | 2.0 | 1700 | $1,800 | $1.06 | 26d | 1 | 0.22mi |
| 14031 Linden St New Orleans, LA | 3.0 | 2.0 | 1200 | $1,400 | $1.17 | 26d | 1 | 0.40mi |
| 7501 Briarwood Dr New Orleans, LA | 3.0 | 2.0 | 1500 | $1,850 | $1.23 | 26d | 1 | 0.75mi |
| 12345 I 10 Service Rd New Orleans, LA | 1.0–2.0 | 1.0–2.0 | 746 | $1,125 | $1.51 | 4d | 200 | 1.47mi |
Listing history 12 events
-
2026-06-22days on market $150,000 Active 17 DOM
-
2026-06-21days on market $150,000 Active 16 DOM
-
2026-06-18days on market $150,000 Active 13 DOM
-
2026-06-17days on market $150,000 Active 12 DOM
-
2026-06-16days on market $150,000 Active 11 DOM
-
2026-06-15days on market $150,000 Active 10 DOM
-
2026-06-13days on market $150,000 Active 8 DOM
-
2026-06-10days on market $150,000 Active 5 DOM
-
2026-06-09days on market $150,000 Active 4 DOM
-
2026-06-08days on market $150,000 Active 3 DOM
-
2026-06-07remarks 699-char remark
-
2026-06-07$150,000 Active 2 DOM
ⓘ Source: listings_history table (triggers on properties + properties_extension) + one-shot
backfill from property_details.listing_events for pre-trigger history.
Tax reassessment forecast LA · Resets to sale price
- Current annual tax
- $2,102 · $175/mo
- Projected year-2 tax
- $2,102 · $175/mo
- Expected delta
- $0/yr ($0/mo · 0.0%)
ⓘ Screening estimate from a state-policy table — verify with the county assessor before closing.
Climate risk First Street
- Flood 8/10 Severe FEMA zone X (shaded) · 60% chance over 30 yrs
- Wildfire 3/10 Moderate
- Heat 10/10 Extreme 7 d/yr ≥107°F today · 22 d/yr by 30 yrs out
- Wind 10/10 Extreme 99% chance of damaging wind over 30 yrs
- Air quality 3/10 Moderate 2 unhealthy d/yr today · 3 by 30 yrs out
Nearby sold comps map
Loading sold comps map…
Walkable amenities ~0.75 mi
Loading nearby amenities…
Taxation est. · year 1
- Rental income
- $17,130
- − Mortgage interest
- −$8,402
- − Property taxes
- −$2,102
- − Insurance
- −$1,547
- − Repairs & maintenance
- −$1,370
- − Management
- −$1,370
- − Depreciation
- −$4,364
- Taxable loss
- −$2,027
- Est. tax savings @ 24.0%
- +$486
- After-tax cash flow
- $930/yr
For passive investors: Depreciation is non-cash, so a rental often shows a tax loss while cash-flowing — sheltering income. Rental losses are passive: they offset passive income freely, and up to $25,000/yr can offset ordinary (W-2) income if you actively participate and your MAGI is under $100k (phasing out to $0 by $150k); unused losses carry forward. On sale, claimed depreciation is recaptured at up to 25%, and gains may owe capital-gains tax (a 1031 exchange can defer both). Figures are a year-1 estimate at your 24.0% rate — not tax advice; consult a CPA.
Schools (NCES district)
- District
- Orleans Parish
- NCES district ID
- 2201170
- Math proficiency
- 11% ▼ -52.00%
- Reading proficiency
- 27% ▼ -46.00%
- Median HH income
- $37,011
- Composite
- 15.78/100
- National rank
- #9271
- State rank
- #69 of 98 in LA
Livability — New Orleans
- Score
- 81/100
- State rank
- #3
- US rank
- #1383
Category grades
Schools grade is shown separately in the Schools card above.
Census & demographics
- Census place
- New Orleans, LA
- City population
- 338,817
- Population (ZIP)
- 22,973
Population outlook (Orleans County) Hauer SSP2
- Today (2025)
- 513,025 people
- By 2030
- 575,781 · +12.2%
- By 2040
- 700,174 · +36.5%
- By 2050
- 826,541 · +61.1%
- By 2075
- 1,123,374 · +119.0%
- By 2100
- 1,355,609 · +164.2%
Race, ethnicity, and origin ACS 2023
- Neighborhood character
- Predominantly Black (86%)
- Race & ethnicity
- Black 86% Asian 5% White 4% Two or more races 3%
- Foreign-born
- 4% · Vietnam, Canada
- Languages at home
- 95% English-only · Vietnamese 4% Spanish 1%
Political lean MEDSL · Orleans
- 2024 margin
- Solid D (+67.0) · D 82.2% · R 15.2% · Other 2.7%
- 2008→2024 swing
- +6.7pp toward D · 2008: 60.3pp · 2024: 67.0pp
- All cycles
- 2024: D+67.0 2020: D+68.2 2016: D+66.2 2012: D+62.5 2008: D+60.3
Not yet ingested
- Civics
- —
Market trends
- HPI YoY
- ▼ -15.51%
- Current HPI
- 247.7131
- Rent YoY
- —
- Metro
- —
- State GDP YoY
- ▲ 3.29%
- F500 in state
- 10
Industry mix (Fortune 500 HQ in LA)
| Industry | F500 HQs | Revenue |
|---|---|---|
| Telecommunications | 2 | $23B |
|
||
| Utilities | 1 | $12B |
|
||
| Wholesale / Distribution | 1 | $5B |
|
||
| Advertising | 1 | $2B |
|
||
Price history
+422.6% since first listed24 events — show timeline
- 2026-06-05 Listed $150,000 GSREIN
- 2026-06-05 Listed $150,000 AcadianaMLS
- 2023-05-02 Price Changed $175,000 GSREIN
- 2023-04-14 Listed $175,000 AcadianaMLS
- 2020-09-02 Sold (Public Records) $150,000 Public Records
- 2020-08-31 Sold (MLS) $150,000 GSREIN
- 2020-07-29 Pending — GSREIN
- 2020-07-23 Listed $140,000 GSREIN
- 2020-07-23 Listed $140,000 AcadianaMLS
- 2020-01-15 Sold (MLS) $73,000 GSREIN
- 2019-12-05 Pending — GSREIN
- 2019-11-20 Relisted — GSREIN
- 2019-11-20 Price Changed $74,900 GSREIN
- 2019-11-20 Pending — GSREIN
- 2019-10-24 Listed $74,900 AcadianaMLS
- 2019-10-24 Listed $79,900 GSREIN
- 1994-09-20 Sold (Public Records) $38,000 Public Records
- 1994-09-20 Sold (MLS) $38,000 GSREIN
- 1993-11-08 Listed $38,500 GSREIN
- 1993-11-08 Listed $38,500 AcadianaMLS
- 1993-11-05 Sold (MLS) $17,500 GSREIN
- 1993-09-15 Listed $19,900 AcadianaMLS
- 1993-09-15 Listed $19,900 GSREIN
- 1993-07-29 Sold (Public Records) $28,700 Public Records
Property tax history
+30.5%/yrLatest (2026): $2,102 · +1.1% YoY. Source: county tax records.
Cash-flow waterfall
monthlySold comps — $/sqft
last 12 mo · ≤1 miLoading sold comps…