 🌊 Lakefront
459 Savoy Ct · Spring Hill, FL
Flood risk 1/10 · Minimal
- FEMA flood zone
- X (unshaded)
- Chance of flooding over 30 yrs
- 0.0%
- Est. flood insurance / yr
- $507 – $1,088
Fire risk 4/10 · Minor
- Est. fire insurance / yr
- $947 – $1,759
Heat risk 10/10 · Severe
- Hot days now (above 110°F)
- 7 days/yr
- Hot days in 30 yrs
- 25 days/yr
Wind risk 10/10 · Severe
- Chance of severe wind over 30 yrs
- 99.0%
Air-quality risk 2/10 · Minimal
- Unhealthy air days now
- 1 days/yr
- Unhealthy air days in 30 yrs
- 3 days/yr
Risk factors via First Street. Map © Google.
Why this score? — see what drove the D+ grade
The composite is a weighted blend of 9 inputs, each scored 0–100. Each bar is that input's sub-score; the figure is the points it added to the 100-point composite (weight × sub-score).
- Cash flow +15.3/30.0
- ARV discount +14.2/15.0
- DSCR +4.7/10.0
- Schools +4.2/10.0
- Livability +3.2/5.0
- 1% rule +2.9/10.0
- Condition / age +2.5/5.0
- Rent growth +2.3/5.0
- Appreciation +0.0/10.0
$325,000
🖨 Deal sheet (PDF) 📄 Offer letter ✓ Due diligence
Listing remarks MLS
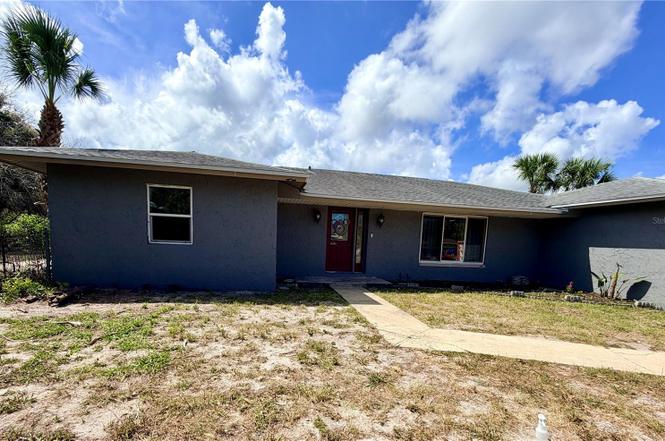
Great opportunity to own this four bedroom, two bathroom home on Hunter’s Lake. This home has a brand new kitchen including new wood cabinets, granite counter tops and stainless steel appliances. Fresh paint inside and out in addition to new carpets. The family room has a wall of sliding doors with direct view to the lake. The roof has been replaced and AC serviced. No homeowners association, no deed restrictions.
Key facts
- Open floor plan
- New flooring
- Double lot
Tags
Property features AI
Finance
- Other: Property type: Residential - Single Family Residence; Zoned RES; Universal property ID on file; Located at the end of a cul-de-sac (directions available)
- Financial info: No lease restrictions
- HOA & community: No HOA/association
Exterior
- Parking: Attached 2-car garage
- Utilities: Public water; Public sewer; Electricity connected
- Home design: Single family residence; One level; Faces northeast
- Construction: Block and stone construction; Shingle roof; Block and slab foundation; Building area approximately 2,785 square feet; Living area approximately 2,115 square feet; Built with total building area of about 258.73 square meters
- Exterior features: Lake view (Hunter's Lake); Lighting; Sidewalk; Asphalt road access; Lot about 0.67 acres (1/2 to less than 1 acre)
Interior
- Kitchen: No appliances included
- Bedrooms: 4 bedrooms
- Flooring: Carpet; Tile
- Bathrooms: 2 full bathrooms
- Heating & cooling: Central heating (electric); Central air conditioning
- Interior features: Ceiling fans
- Laundry & utility: Laundry located in the garage
Neighborhood map
What this means for you Summary
Snapshot
- This is a 4-bed/2.0-bath single-family listed at $325k.
Deal economics
- At list price, monthly cash flow is $121 ($1k/yr) — positive.
- The deal already cash-flows at list — no discount required.
- To meet the 1% rule (rent ≥ 1% of price), the offer needs to be $256k (21.4% below list).
- Recommended offer: $256k (21.4% below list) — sets the bar for 1% rule.
- Cap rate 6.7% vs local median 4.4% in Spring Hill — top-decile yield for the area; either an underpriced asset or a hidden risk that comps aren't pricing in. Stress-test before assuming the spread holds.
Location & tenants
- Location reads 63/100 on livability (#738 in FL) — a middle-class / working-renter tenant base. Strengths: cost of living A+, housing A+; Watch: health & safety C-, employment D+, amenities F.
- Hernando (suburban): math 50% / reading 50% proficiency, ranked #38 of 73 in FL (top 52%) — acceptable for families but not a draw, mixed tenant base, ~2y average lease.
- Zoned schools: Westside Elementary School (math 53% / reading 46%, grade D, #1,088 of 2,144 statewide, top 53%, 523 students, 76% FRL); Fox Chapel Middle School (math 39% / reading 44%, grade F, #348 of 571 statewide, top 62%, 862 students, 69% FRL); Weeki Wachee High School (math 41% / reading 42%, grade F, #284 of 667 statewide, top 43%, 1,435 students, 52% FRL).
- Market conditions: Rents soft (-0.9%/yr); 392 active listings in the ZIP; 5 comparable units currently listed for rent nearby; rentals leasing fast (median 6d on market — plan ~1-2 weeks tenant-placement turnaround); 2,505 units permitted in Hernando County in 2024 (318 in 5+ unit buildings).
- At $2,555/mo this rent would consume 53% of the median local household income ($57k/yr) (locally 733% of renters already pay >50% of income on rent) — very limited rent-growth headroom before tenants either downsize or default.
Forward outlook
- Local home prices are declining (-3.0%/yr); year-one equity from $2k of loan paydown is wiped out by about $10k of value loss. Plan a longer hold.
- Hernando County population projected at +11% by 2050 — modest demand growth; plan on rents tracking national, not racing it.
Negotiation context
- Only 6 days on market — expect competitive offers; lowballing is unlikely to land.
- 4 sale attempts since 25y ago with the ask held roughly flat each time — persistent listings suggest the price (not the market) is what's stuck; bring a comps-based counter.
- Current owner paid $120k; list at $325k implies a 171% gain — meaningful room to come down on a strong offer.
Risks & watch-outs
- Climate carrying-cost: severe wind risk, 99% chance of damaging wind over 30y; extreme-heat days projected 7→25/yr by 2055 (HVAC capex compounding) — expect insurance premiums to compound above CPI over the hold.
Questions for the listing agent
- Built in 1971 — when were the roof, HVAC, electrical panel, plumbing, and water heater last replaced?
- Is there a deadline driving the sale (1031 exchange, divorce, estate, relocation)? That informs how much negotiation room exists.
- The area grade is low — what's the realistic commute time and amenity access for the typical tenant pool here? Any planned neighborhood developments (good or bad) we should know about?
- This sits on a lake — are riparian / water-frontage rights deeded with the parcel? Any dock permits, shoreline easements, or HOA water-use restrictions?
- What's the documented flood / surge / shoreline-erosion history here (FEMA AND non-FEMA — e.g., storm surge, creek backup, septic-field saturation)?
- Any water-quality or seasonal algae-bloom issues that affect tenant satisfaction or short-term-rental demand?
- What's the average days-on-market for RENTAL listings here right now (not sales)? A rising rental-DOM trend means longer vacancies and softer asking-rent achievability than the comps imply.
- What's the recent tenant-quality profile in this submarket — average credit score on applications, eviction rate, late-payment / NSF rate, and stable-employment percentage? A property-management company in the area should have these aggregated.
- How much new for-sale + rental construction is in the pipeline within 1–3 miles? Heavy new supply typically softens prices + rents 12–24 months out; constrained supply supports both.
Investment metrics
- 1% rule
- 0.79% ✗
- Cap rate
- 6.74%
- Cash-on-cash
- 1.60%
- DSCR
- 1.07
- GRM
- 10.6
CMA / ARV
- ARV (on-the-fly)
- $381,463
- Comps found
- 12
Show comp detail 12 sales within ~0.75 mi
| Address | Dist | Beds/Ba | Sqft | Sold | Price | $/sf | Match |
|---|---|---|---|---|---|---|---|
| 6229 Dalton St | 0.22mi | 3/2.0 (-1) | 1,769 (-3%) | 3mo | $235,000 | $133 | 77 |
| 6913 Pinehurst Dr | 0.30mi | 3/2.0 (-1) | 1,906 (+5%) | 5mo | $235,000 | $123 | 69 |
| 471 Swallow Ln | 0.50mi | 4/2.0 | 1,811 (-1%) | 8mo | $310,000 | $171 | 69 |
| 6602 Treehaven Dr | 0.29mi | 3/2.0 (-1) | 1,656 (-9%) | 2mo | $239,500 | $145 | 65 |
| 6327 Skyline Ct | 0.42mi | 3/2.0 (-1) | 1,773 (-3%) | 7mo | $275,000 | $155 | 65 |
| 102 Paris Ave | 0.72mi | 4/2.0 | 1,828 (+0%) | 3mo | $353,570 | $193 | 63 |
| 6159 Wayside Ct | 0.44mi | 3/2.0 (-1) | 1,721 (-6%) | 9mo | $200,000 | $116 | 57 |
| 155 Ruskin Ave | 0.72mi | 4/2.0 | 1,964 (+8%) | 1mo | $340,000 | $173 | 53 |
| 6808 Treehaven Dr | 0.41mi | 3/2.0 (-1) | 1,571 (-14%) | 2mo | $240,000 | $153 | 51 |
| 177 Rusk Cir | 0.73mi | 3/2.5 (-1) | 1,767 (-3%) | 3mo | $262,000 | $148 | 51 |
| 6937 Treehaven Dr | 0.42mi | 3/2.0 (-1) | 1,626 (-11%) | 8mo | $300,000 | $185 | 51 |
| 5555 Baffin Cir | 0.72mi | 3/2.0 (-1) | 1,910 (+5%) | 6mo | $389,000 | $204 | 49 |
Match score weights: distance 35% · size 25% · config 20% · recency 20%. Top-matched comps best support the ARV.
Projected returns pro-forma
-3.0% appreciation · 0.0% rent growth · sell at horizon
- IRR
- -16.7%
- Equity multiple
- 0.42×
- Total profit
- $-52,598
- Equity at exit
- $48,459
- IRR
- -14.1%
- Equity multiple
- 0.28×
- Total profit
- $-65,502
- Equity at exit
- $28,100
Cash invested: $91,000 (down + closing). Projections, not guarantees.
Landlord ↔ Tenant lean methodology
- Overall (STATE)
- 87 Strongly Landlord-Friendly
- State Florida
- 87 Strongly Landlord-Friendly · R+3
- County
- — inherits STATE
- City
- — inherits STATE
ZIP-level market 34606
- Home prices YoY
- -24.7%
- Rents YoY
- -0.9%
- Active inventory
- 392
- Price-to-rent
- 10.6×
Monthly cashflow live
- Estimated rent
- $2,555 high interval (Pro) →
- Mortgage (P&I)
- −$1,704
- Tax from tax record
- −$58 /mo · $692/yr
- Insurance
- −$135
- HOA
- −$0
- Vacancy / Maint / Mgmt
- −$537
- Net cashflow
- $121
Break-even live
Sensitivity live
| Price | -10% $305 | -5% $213 | +0% $121 | +5% $29 | +10% $-452 |
|---|---|---|---|---|---|
| Rent | -10% $-80 | -5% $20 | +0% $121 | +5% $222 | +10% $323 |
| Rate | -1.0pp $285 | -0.5pp $204 | base $121 | +0.5pp $37 | +1.0pp $-49 |
UW: 25.0% down · 7.5% · 30yr · 1.5% tax · 5.0% vac · 8.0% maint · 8.0% mgmt
Financing live
Cash to close
- Down payment
- $81,250
- Closing costs
- $9,750
- Reserves months
- —
- Total cash needed
- —
Loan-product check · same deal, 3 products live
Conventional
25% down · 7.5% · 30yr
- Down + closing
- —
- Monthly P&I
- —
- Monthly cashflow
- —
- DSCR
- —
- Eligible?
- —
Personal DTI + credit; lowest rate.
DSCR
20% down · 8.5% · 30yr
- Down + closing
- —
- Monthly P&I
- —
- Monthly cashflow
- —
- DSCR
- —
- Eligible?
- —
No personal income docs; deal must DSCR.
Hard money
10% down · 12.0% · 12mo
- Down + closing
- —
- Monthly P&I
- —
- Monthly cashflow
- —
- DSCR
- —
- Eligible?
- —
Short-term bridge; refi at stabilization.
Rent comps 5 comps
| Address | Beds | Baths | Sqft | Rent | $/sqft | DOM | Units | Dist |
|---|---|---|---|---|---|---|---|---|
| 6510 Hillview Rd Spring Hill, FL | 4.0 | 2.5 | 2215 | $2,240 | $1.01 | 1d | 1 | 0.95mi |
| 7176 Lockwood St Spring Hill, FL | 3.0 | 2.0 | 1272 | $1,795 | $1.41 | 26d | 1 | 1.11mi |
| 18720 Oak Way Dr Hudson, FL | 3.0 | 2.0 | 1839 | $2,700 | $1.47 | 5d | 1 | 1.12mi |
| 6018 Newmark St Spring Hill, FL | 4.0 | 3.0 | 2252 | $3,500 | $1.55 | 19d | 1 | 1.18mi |
| 18725 Parade Rd Hudson, FL | 3.0 | 2.0 | 1420 | $1,760 | $1.24 | 0d | 1 | 1.50mi |
Listing history 5 events
-
2026-06-21days on market $325,000 Active 6 DOM
-
2026-06-18days on market $325,000 Active 3 DOM
-
2026-06-17days on market $325,000 Active 2 DOM
-
2026-06-15remarks 699-char remark
-
2026-06-15$325,000 Active 1 DOM
ⓘ Source: listings_history table (triggers on properties + properties_extension) + one-shot
backfill from property_details.listing_events for pre-trigger history.
Tax reassessment forecast FL · Resets to sale price
- Current annual tax
- $692 · $58/mo
- Projected year-2 tax
- $2,698 · $225/mo
- Expected delta
- +$2,006/yr (+$167/mo · 289.9%)
ⓘ Screening estimate from a state-policy table — verify with the county assessor before closing.
Climate risk First Street
- Flood 1/10 Low FEMA zone X (unshaded) · 0% chance over 30 yrs
- Wildfire 4/10 Moderate
- Heat 10/10 Extreme 7 d/yr ≥110°F today · 25 d/yr by 30 yrs out
- Wind 10/10 Extreme 99% chance of damaging wind over 30 yrs
- Air quality 2/10 Low 1 unhealthy d/yr today · 3 by 30 yrs out
Nearby sold comps map
Loading sold comps map…
Walkable amenities ~0.75 mi
Loading nearby amenities…
Taxation est. · year 1
- Rental income
- $30,665
- − Mortgage interest
- −$18,205
- − Property taxes
- −$692
- − Insurance
- −$1,625
- − Repairs & maintenance
- −$2,453
- − Management
- −$2,453
- − Depreciation
- −$9,455
- Taxable loss
- −$4,218
- Est. tax savings @ 24.0%
- +$1,012
- After-tax cash flow
- $2,469/yr
For passive investors: Depreciation is non-cash, so a rental often shows a tax loss while cash-flowing — sheltering income. Rental losses are passive: they offset passive income freely, and up to $25,000/yr can offset ordinary (W-2) income if you actively participate and your MAGI is under $100k (phasing out to $0 by $150k); unused losses carry forward. On sale, claimed depreciation is recaptured at up to 25%, and gains may owe capital-gains tax (a 1031 exchange can defer both). Figures are a year-1 estimate at your 24.0% rate — not tax advice; consult a CPA.
Schools (NCES district)
- District
- Hernando
- NCES district ID
- 1200810
- Math proficiency
- 50% ▼ -8.00%
- Reading proficiency
- 50% ▼ -4.00%
- Median HH income
- $41,985
- Composite
- 42.03/100
- National rank
- #3329
- State rank
- #38 of 73 in FL
Livability — Spring Hill
- Score
- 63/100
- State rank
- #738
- US rank
- #15937
Category grades
Schools grade is shown separately in the Schools card above.
Census & demographics
- Census place
- Spring Hill, FL
- County
- Hernando County · 169,677 people
- City population
- 83,915
- Metro
- Tampa-St. Petersburg-Clearwater, FL
- Population (ZIP)
- 28,668
- Household income
- $57,337
- Rent vs Own
- Severe rent burden
- 733.0
Population outlook (Hernando County) Hauer SSP2
- Today (2025)
- 189,218 people
- By 2030
- 194,367 · +2.7%
- By 2040
- 203,398 · +7.5%
- By 2050
- 209,589 · +10.8%
- By 2075
- 218,452 · +15.4%
- By 2100
- 205,923 · +8.8%
Race, ethnicity, and origin ACS 2023
- Neighborhood character
- Predominantly White (74%)
- Race & ethnicity
- White 74% Hispanic / Latino 16% Two or more races 13% Black 4%
- Hispanic origin (detail)
- Mexican 1% Puerto Rican 10% Cuban 2%
- Common ancestry
- Romanian 4% Lithuanian 3% Slovak 2%
- Foreign-born
- 8% · Canada, Jamaica
- Languages at home
- 87% English-only · Spanish 11% German/W. Germanic 1%
Political lean MEDSL · Hernando
- 2024 margin
- Solid R (+37.0) · D 31.1% · R 68.2%
- 2008→2024 swing
- -33.5pp toward R · 2008: -3.6pp · 2024: -37.0pp
- All cycles
- 2024: R+37.0 2020: R+30.2 2016: R+29.0 2012: R+8.5 2008: R+3.6
Not yet ingested
- Civics
- —
Market trends
- HPI YoY
- ▼ -98.11%
- Current HPI
- 298.5201
- Rent YoY
- ▼ -0.89%
- Metro
- Tampa-St. Petersburg-Clearwater, FL
- State GDP YoY
- ▲ 3.28%
- F500 in state
- 36
Industry mix (Fortune 500 HQ in FL)
| Industry | F500 HQs | Revenue |
|---|---|---|
| Industrial Technology | 2 | $29B |
|
||
| Insurance | 2 | $17B |
|
||
| Retail | 1 | $60B |
|
||
| Technology Distribution | 1 | $58B |
|
||
| Homebuilding | 1 | $35B |
|
||
| Technology Manufacturing | 1 | $35B |
|
||
Price history
+364.3% since first listed9 events — show timeline
- 2026-06-15 Listed $325,000 Stellar MLS as Distributed by MLS Grid
- 2016-06-10 Sold (MLS) $120,000 Stellar MLS as Distributed by MLS Grid
- 2016-03-22 Listed $114,900 Stellar MLS as Distributed by MLS Grid
- 2001-08-28 Sold (Public Records) $94,600 Public Records
- 2001-08-14 Sold (MLS) $88,000 HCAR
- 2001-08-14 Sold (MLS) $88,000 St. Augustine and St. Johns County Board of REALTORS®
- 2001-06-19 Listed $92,750 HCAR
- 2001-06-19 Listed $92,750 St. Augustine and St. Johns County Board of REALTORS®
- 1980-11-01 Sold (Public Records) $70,000 Public Records
Property tax history
-1.1%/yrLatest (2025): $692 · +1.7% YoY. Source: county tax records.
Cash-flow waterfall
monthlySold comps — $/sqft
last 12 mo · ≤1 miLoading sold comps…