 Duplex
5621 and 5623 Delia Ln SW · Bremerton, WA
Flood risk 1/10 · Minimal
- FEMA flood zone
- X (unshaded)
- Chance of flooding over 30 yrs
- 0.0%
- Est. flood insurance / yr
- $507 – $1,088
Fire risk 3/10 · Minor
- Est. fire insurance / yr
- $604 – $1,122
Heat risk 3/10 · Minor
- Hot days now (above 86°F)
- 7 days/yr
- Hot days in 30 yrs
- 15 days/yr
Wind risk 1/10 · Minimal
- Chance of severe wind over 30 yrs
- —
Air-quality risk 6/10 · Moderate
- Unhealthy air days now
- 8 days/yr
- Unhealthy air days in 30 yrs
- 8 days/yr
Risk factors via First Street. Map © Google.
Why this score? — see what drove the D grade
The composite is a weighted blend of 9 inputs, each scored 0–100. Each bar is that input's sub-score; the figure is the points it added to the 100-point composite (weight × sub-score).
- Cash flow +12.9/30.0
- ARV discount +7.5/15.0
- Schools +5.2/10.0
- Livability +4.3/5.0
- DSCR +3.9/10.0
- Rent growth +2.9/5.0
- 1% rule +2.8/10.0
- Condition / age +2.5/5.0
- Appreciation +0.0/10.0
$679,900
🖨 Deal sheet (PDF) 📄 Offer letter ✓ Due diligence
Multi-family units
County records classify this as Multi-Family (2-4 Unit). Listing-text estimate: 2 units. confirmed
Listing remarks
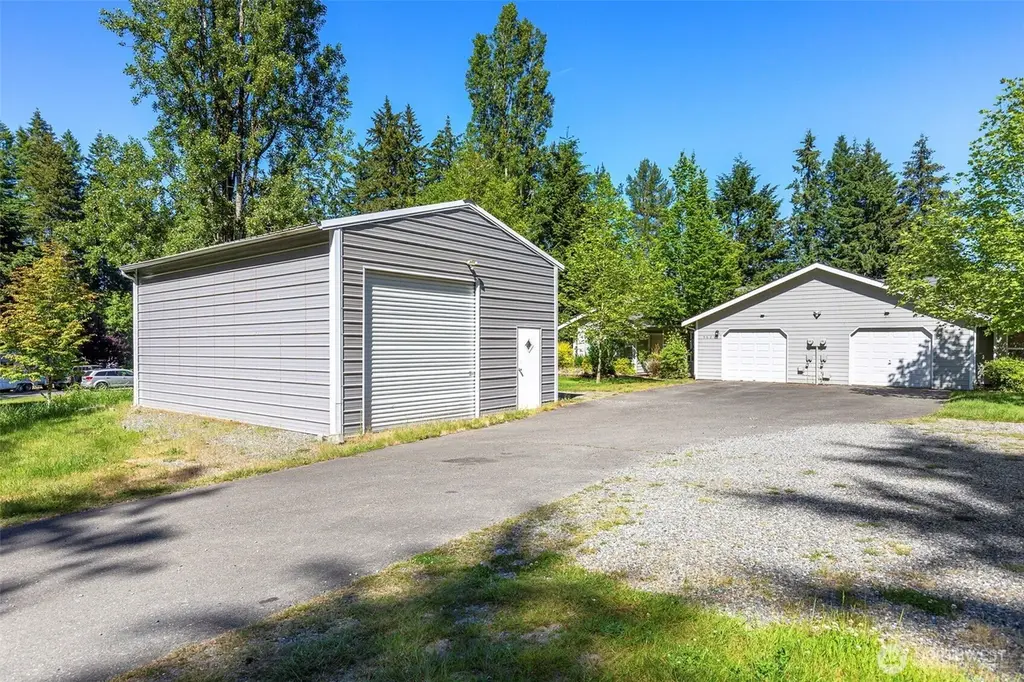
Investors' DREAM!: This wonderfully cared for 1-story duplex is tucked away on a quiet dead-end street and on a large 1-acre lot while still being in close proximity to all amenities and highway access. Each unit has 3 bedrooms, 2 bathrooms, a patio and a 321 Sq Ft garage. There is also a 720 Sq Ft detached shop/outbuilding with a 10' x 10' rollup door that is not currently rented. The gravel parking pad next to the paved driveway is great for overflow parking. The units have had thoughtful updates over the years and have always been very well maintained. A brand new roof will be installed for the Buyer, and the Buyer will receive a transferable roof warranty at closing. This duplex is alwa
Key facts
- Gravel parking pad
- Paved driveway
- Detached shop
Tags
Property features AI
Finance
- Other: Two units in building; No units below grade
- Financial info: Total monthly income reported: $4,390; Gross scheduled income: $52,680; Gross adjusted income: $46,018; Net operating income: $22,018; Total expenses: $6,661.78; Insurance expense: $2,000; Gross rent multiplier: 12.9; Acceptable listing terms: Cash, Conventional, FHA
Exterior
- Parking: 5-car garage (642 sq ft garage area); 5 covered spaces; 6 uncovered parking spaces; RV parking available
- Utilities: Electric service; Public water; Septic sewer; Puget Sound Energy power; Astound cable and internet
- Home design: Duplex (residential income, multi-family); Single-story; Has a view; Style coded as duplex
- Construction: Built (effective) in 1992; Standard frame construction; Cement and cement plank siding; Composition roof; Slab foundation; Property condition: Very good
- Exterior features: Cement/concrete and cement planked exterior; Patio; RV parking; Shop; Cable TV and high-speed internet available; Dead-end street; Paved access
Interior
- Kitchen: Each unit includes range/oven; Each unit includes refrigerator; Each unit includes dishwasher
- Bedrooms: Up to 6 possible bedrooms; Each unit: 3 bedrooms
- Flooring: Laminate; Vinyl; Carpet
- Bathrooms: Each unit: 2 bathrooms
- Heating & cooling: Wall furnace heating; No central air
- Interior features: Laminate, vinyl and carpet flooring; Wall furnace heating
- Laundry & utility: Each unit includes washer and dryer
Neighborhood map
What this means for you Summary
Snapshot
- This is a 2 × 3-bed/2.0-bath units multifamily listed at $680k.
Deal economics
- At list price, monthly cash flow is $-51 ($-612/yr) — negative. Per door: $-26/mo.
- To cash-flow at today's rent, offer at most $671k (1.3% below list).
- To meet the 1% rule (rent ≥ 1% of price), the offer needs to be $530k (22.1% below list).
- Recommended offer: $530k (22.1% below list) — sets the bar for 1% rule.
- Cap rate 6.2% vs local median 3.5% in Bremerton — top-decile yield for the area; either an underpriced asset or a hidden risk that comps aren't pricing in. Stress-test before assuming the spread holds.
Location & tenants
- Location reads 86/100 on livability (#22 in WA, #431 nationally) — a professional / high-income tenant draw. Strengths: amenities A+, commute A+, housing A+; Watch: crime F.
- South Kitsap School District (suburban): math 52% / reading 64% proficiency, ranked #71 of 291 in WA (top 24%) — acceptable for families but not a draw, mixed tenant base, ~2y average lease.
- Zoned schools: Sunnyslope Elementary School (437 students, 33% FRL); South Kitsap High School (2,389 students, 40% FRL).
- Market conditions: Rents rising (+1.6%/yr); 341 active listings in the ZIP; high-income renter base; 1,294 units permitted in Kitsap County in 2024 (302 in 5+ unit buildings).
- At $5,299/mo this rent would consume 55% of the median local household income ($115k/yr) (locally 595% of renters already pay >50% of income on rent) — very limited rent-growth headroom before tenants either downsize or default.
Forward outlook
- Local home prices are declining (-3.0%/yr); year-one equity from $5k of loan paydown is wiped out by about $20k of value loss. Plan a longer hold.
- Kitsap County population projected at +8% by 2050 — modest demand growth; plan on rents tracking national, not racing it.
Negotiation context
- Only 5 days on market — expect competitive offers; lowballing is unlikely to land.
- 3 sale attempts since 14y ago with the ask held roughly flat each time — persistent listings suggest the price (not the market) is what's stuck; bring a comps-based counter.
- Current owner paid $345k; list at $680k implies a 97% gain — meaningful room to come down on a strong offer.
Questions for the listing agent
- What do current leases actually rent for vs. the listed asking? Can we see a recent rent roll and the last 12 months of T-12 income?
- Can we see the unit-by-unit rent roll, current vacancy, and any below-market leases? What's the average tenancy length?
- What capital expenditures (roof, boiler, parking lot, exteriors) have been made in the last 5 years, and what's planned in the next 2?
- Is there a deadline driving the sale (1031 exchange, divorce, estate, relocation)? That informs how much negotiation room exists.
- Schools are B-rated — typically a magnet for longer-tenancy family renters. What's the average tenant stay here, and is there a school-zone premium baked into asking?
- Crime grade is F in this area — have there been break-ins, vandalism, or insurance claims at this property in the last 3 years? What carrier currently insures it and at what premium?
- The area grade is low — what's the realistic commute time and amenity access for the typical tenant pool here? Any planned neighborhood developments (good or bad) we should know about?
- What's the average days-on-market for RENTAL listings here right now (not sales)? A rising rental-DOM trend means longer vacancies and softer asking-rent achievability than the comps imply.
- What's the recent tenant-quality profile in this submarket — average credit score on applications, eviction rate, late-payment / NSF rate, and stable-employment percentage? A property-management company in the area should have these aggregated.
- How much new apartment / multifamily construction is in the pipeline within 1–3 miles? Heavy new supply (>2% of stock underway) typically softens rents 12–24 months out; light construction supports rent growth.
Investment metrics
- 1% rule
- 0.78% ✗
- Cap rate
- 6.20%
- Cash-on-cash
- -0.32%
- DSCR
- 0.99
- GRM
- 10.7
CMA / ARV
No comps found within radius.
Projected returns pro-forma
-3.0% appreciation · 1.6% rent growth · sell at horizon
- IRR
- -18.3%
- Equity multiple
- 0.36×
- Total profit
- $-120,989
- Equity at exit
- $101,375
- IRR
- -13.4%
- Equity multiple
- 0.27×
- Total profit
- $-139,738
- Equity at exit
- $58,785
Cash invested: $190,372 (down + closing). Projections, not guarantees.
Landlord ↔ Tenant lean methodology
- Overall (STATE)
- 28 Tenant-Leaning
- State Washington
- 28 Tenant-Leaning · D+8
- County
- — inherits STATE
- City
- — inherits STATE
ZIP-level market 98367
- Rents YoY
- 1.6%
- Active inventory
- 341
- Price-to-rent
- 21.4×
Monthly cashflow live
- Estimated rent
- $5,299 medium interval (Pro) →
- Mortgage (P&I)
- −$3,565
- Tax from tax record
- −$388 /mo · $4,662/yr
- Insurance
- −$283
- HOA
- −$0
- Vacancy / Maint / Mgmt
- −$1,113
- Net cashflow
- $-51
Break-even live
Sensitivity live
| Price | -10% $334 | -5% $141 | +0% $-51 | +5% $-243 | +10% $-436 |
|---|---|---|---|---|---|
| Rent | -10% $-470 | -5% $-260 | +0% $-51 | +5% $158 | +10% $368 |
| Rate | -1.0pp $291 | -0.5pp $122 | base $-51 | +0.5pp $-227 | +1.0pp $-406 |
2-unit breakdown (identical units grouped — click to expand)
| Units | Beds | Baths | Est. rent |
|---|---|---|---|
| 2× units | 3 | 2 | $5,300 |
| #1 | 3 | 2 | $2,650 |
| #2 | 3 | 2 | $2,650 |
| Total (2 units) | $5,299 | ||
UW: 25.0% down · 7.5% · 30yr · 1.5% tax · 5.0% vac · 8.0% maint · 8.0% mgmt
Financing live
Cash to close
- Down payment
- $169,975
- Closing costs
- $20,397
- Reserves months
- —
- Total cash needed
- —
Loan-product check · same deal, 3 products live
Conventional
25% down · 7.5% · 30yr
- Down + closing
- —
- Monthly P&I
- —
- Monthly cashflow
- —
- DSCR
- —
- Eligible?
- —
Personal DTI + credit; lowest rate.
DSCR
20% down · 8.5% · 30yr
- Down + closing
- —
- Monthly P&I
- —
- Monthly cashflow
- —
- DSCR
- —
- Eligible?
- —
No personal income docs; deal must DSCR.
Hard money
10% down · 12.0% · 12mo
- Down + closing
- —
- Monthly P&I
- —
- Monthly cashflow
- —
- DSCR
- —
- Eligible?
- —
Short-term bridge; refi at stabilization.
Listing history 5 events
-
2026-06-13statusdays on market $679,900 Pending 5 DOM
-
2026-06-10days on market $679,900 Active 3 DOM
-
2026-06-09days on market $679,900 Active 2 DOM
-
2026-06-07remarks 699-char remark
-
2026-06-07$679,900 Active 1 DOM
ⓘ Source: listings_history table (triggers on properties + properties_extension) + one-shot
backfill from property_details.listing_events for pre-trigger history.
Tax reassessment forecast WA · Resets to sale price
- Current annual tax
- $4,662 · $388/mo
- Projected year-2 tax
- $6,663 · $555/mo
- Expected delta
- +$2,001/yr (+$167/mo · 42.9%)
ⓘ Screening estimate from a state-policy table — verify with the county assessor before closing.
Climate risk First Street
- Flood 1/10 Low FEMA zone X (unshaded) · 0% chance over 30 yrs
- Wildfire 3/10 Moderate
- Heat 3/10 Moderate 7 d/yr ≥86°F today · 15 d/yr by 30 yrs out
- Wind 1/10 Low
- Air quality 6/10 Major 8 unhealthy d/yr today · 8 by 30 yrs out
Nearby sold comps map
Loading sold comps map…
Walkable amenities ~0.75 mi
Loading nearby amenities…
Taxation est. · year 1
- Rental income
- $63,588
- − Mortgage interest
- −$38,085
- − Property taxes
- −$4,662
- − Insurance
- −$3,400
- − Repairs & maintenance
- −$5,087
- − Management
- −$5,087
- − Depreciation
- −$19,779
- Taxable loss
- −$12,511
- Est. tax savings @ 24.0%
- +$3,003
- After-tax cash flow
- $2,390/yr
For passive investors: Depreciation is non-cash, so a rental often shows a tax loss while cash-flowing — sheltering income. Rental losses are passive: they offset passive income freely, and up to $25,000/yr can offset ordinary (W-2) income if you actively participate and your MAGI is under $100k (phasing out to $0 by $150k); unused losses carry forward. On sale, claimed depreciation is recaptured at up to 25%, and gains may owe capital-gains tax (a 1031 exchange can defer both). Figures are a year-1 estimate at your 24.0% rate — not tax advice; consult a CPA.
Schools (NCES district)
- District
- South Kitsap School District
- NCES district ID
- 5308160
- Math proficiency
- 52% ▲ 2.00%
- Reading proficiency
- 64% ▲ 3.00%
- Median HH income
- $62,824
- Composite
- 52.31/100
- National rank
- #3445
- State rank
- #71 of 291 in WA
Livability — Bremerton
- Score
- 86/100
- State rank
- #22
- US rank
- #431
Category grades
Schools grade is shown separately in the Schools card above.
Census & demographics
- County
- Kitsap County · 243,099 people
- City population
- 94,488
- Metro
- Bremerton-Silverdale-Port Orchard, WA
- Population (ZIP)
- 31,756
- Household income
- $115,482
- Rent vs Own
- Severe rent burden
- 595.0
Population outlook (Kitsap County) Hauer SSP2
- Today (2025)
- 277,525 people
- By 2030
- 285,040 · +2.7%
- By 2040
- 294,957 · +6.3%
- By 2050
- 300,622 · +8.3%
- By 2075
- 315,580 · +13.7%
- By 2100
- 304,340 · +9.7%
Race, ethnicity, and origin ACS 2023
- Neighborhood character
- Predominantly White (78%)
- Race & ethnicity
- White 78% Two or more races 11% Hispanic / Latino 7% Asian 4% Pacific Islander 1%
- Hispanic origin (detail)
- Mexican 5%
- Common ancestry
- Italian 7% Portuguese 6% Slovak 4%
- Foreign-born
- 6% · Canada, South Korea, Vietnam
- Languages at home
- 91% English-only · Spanish 3% Tagalog/Filipino 2% Other Asian/Pacific 2%
Political lean MEDSL · Kitsap
- 2024 margin
- Strong D (+20.9) · D 58.8% · R 37.9% · Other 3.3%
- 2008→2024 swing
- +8.6pp toward D · 2008: 12.3pp · 2024: 20.9pp
- All cycles
- 2024: D+20.9 2020: D+18.1 2016: D+11.6 2012: D+11.1 2008: D+12.3
Not yet ingested
- Civics
- —
Market trends
- HPI YoY
- ▼ -441.02%
- Current HPI
- 351.671
- Rent YoY
- ▲ 1.60%
- Metro
- Bremerton-Silverdale-Port Orchard, WA
- State GDP YoY
- ▲ 4.65%
- F500 in state
- 22
Industry mix (Fortune 500 HQ in WA)
| Industry | F500 HQs | Revenue |
|---|---|---|
| Retail | 2 | $269B |
|
||
| Technology / Retail | 1 | $638B |
|
||
| Technology | 1 | $245B |
|
||
| Telecommunications | 1 | $38B |
|
||
| Food / Beverage | 1 | $36B |
|
||
| Automotive / Trucks | 1 | $34B |
|
||
Price history
+2372.4% since first listed13 events — show timeline
- 2026-06-07 Listed $679,900 NWMLS as Distributed by MLS Grid
- 2017-01-20 Sold (MLS) $345,000 NWMLS as Distributed by MLS Grid
- 2017-01-06 Sold (Public Records) $347,500 Public Records
- 2016-12-16 Pending — NWMLS as Distributed by MLS Grid
- 2016-11-27 Pending — NWMLS as Distributed by MLS Grid
- 2016-07-28 Price Changed $349,977 NWMLS as Distributed by MLS Grid
- 2016-07-09 Listed $374,977 NWMLS as Distributed by MLS Grid
- 2012-07-26 Sold (MLS) $229,900 NWMLS as Distributed by MLS Grid
- 2012-06-19 Pending — NWMLS as Distributed by MLS Grid
- 2012-05-26 Listed $229,900 NWMLS as Distributed by MLS Grid
- 2002-03-13 Sold (Public Records) $165,000 Public Records
- 1994-06-09 Sold (Public Records) $157,175 Public Records
- 1991-10-08 Sold (Public Records) $27,500 Public Records
Property tax history
+4.6%/yrLatest (2026): $4,662 · +0.5% YoY. Source: county tax records.
Cash-flow waterfall
monthlySold comps — $/sqft
last 12 mo · ≤1 miLoading sold comps…