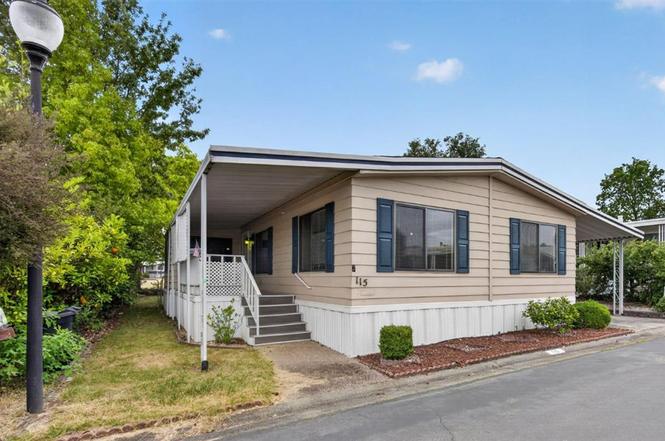
115 Tanya Way · Roseville, CA
Flood risk No data
- FEMA flood zone
- —
- Chance of flooding over 30 yrs
- —
- Est. flood insurance / yr
- —
Fire risk No data
- Est. fire insurance / yr
- —
Heat risk No data
- Hot days now (above threshold)
- —
- Hot days in 30 yrs
- —
Wind risk No data
- Chance of severe wind over 30 yrs
- —
Air-quality risk No data
- Unhealthy air days now
- —
- Unhealthy air days in 30 yrs
- —
Risk factors via First Street. Map © Google.
Why this score? — see what drove the B+ grade
The composite is a weighted blend of 9 inputs, each scored 0–100. Each bar is that input's sub-score; the figure is the points it added to the 100-point composite (weight × sub-score).
- Cash flow +30.0/30.0
- ARV discount +11.5/15.0
- 1% rule +10.0/10.0
- DSCR +10.0/10.0
- Schools +5.1/10.0
- Livability +3.9/5.0
- Condition / age +3.8/5.0
- Rent growth +3.4/5.0
- Appreciation +0.0/10.0
$115,000
🖨 Deal sheet 📄 Offer letter ✓ Due diligence
Listing remarks
Upon entering, you'll appreciate the generous living and dining areas, creating an open and inviting atmosphere. Laminate flooring extends throughout the high-traffic areas and into the primary bedroom. The updated kitchen features attractive finishes and overlooks both the carport and the expanded family room, providing a great space for gathering and entertaining. Two secondary bedrooms are located separately from the primary suite, including one with direct access to the bathroomideal for guests or multigenerational living. Privately situated at the rear of the home, the primary bedroom offers peaceful views of the adjacent open space and includes a large walk-in closet. Outside, you'll
Key facts
- 2 parking spots
- Built 1978
- Listed 7 days
Property features AI
Finance
- Financial info: Land lease: No; Listed land lease amount provided ($1,087) — see broker for details
- HOA & community: No homeowners association; Located in a senior community
Exterior
- Parking: Covered parking
- Utilities: 220 volts in kitchen; Public sewer; Private water
- Home design: Manufactured home in park; Double-wide; Built in 1978
- Construction: Aluminum skirting; Bendix manufactured home; Other roof type
- Exterior features: Internet service available
Interior
- Kitchen: Ice maker
- Bedrooms: Three bedrooms
- Bathrooms: Two full bathrooms; Shower stalls
- Heating & cooling: Central heating; Central cooling
- Interior features: Synthetic countertops; Living room with unspecified 'Other' feature; Dining and family room combined
- Laundry & utility: Laundry room inside
Neighborhood map
What this means for you Summary
Snapshot
- This is a 3-bed/2.0-bath manufactured listed at $115k. Condition is rated good.
Deal economics
- At list price, monthly cash flow is $2k ($21k/yr) — positive.
- The deal already cash-flows at list — no discount required.
- Meets the 1% rule at list price ($3k rent vs $115k).
- Cap rate 24.4% vs local median 2.8% in Roseville — top-decile yield for the area; either an underpriced asset or a hidden risk that comps aren't pricing in. Stress-test before assuming the spread holds.
Location & tenants
- Location reads 77/100 on livability (#90 in CA, #3,239 nationally) — a middle-class / working-renter tenant base. Strengths: commute A+, employment A+, housing A+; Watch: cost of living F.
- Roseville Joint Union High (urban): math 42% / reading 71% proficiency, ranked #86 of 517 in CA (top 17%) — acceptable for families but not a draw, mixed tenant base, ~2y average lease.
- Market conditions: Rents rising (+3.5%/yr); 118 active listings in the ZIP; 8 comparable units currently listed for rent nearby; rentals leasing fast (median 8d on market — plan ~1-2 weeks tenant-placement turnaround); solid renter incomes; 3,535 units permitted in Placer County in 2024 (689 in 5+ unit buildings).
- This rent runs 36% of the median local income ($106k/yr) — at the standard rent-burdened threshold; future hikes will face affordability resistance.
Forward outlook
- Local home prices are declining (-3.0%/yr); year-one equity from $795 of loan paydown is wiped out by about $3k of value loss. Plan a longer hold.
- Placer County population projected at +20% by 2050 — long-run rental-demand tailwind backs the buy-and-hold thesis.
- At projected returns (-3.0% appreciation + 3.5% rent growth), your $32k cash investment doubles in ~2 years — after that, you're playing with house money.
Negotiation context
- Only 7 days on market — expect competitive offers; lowballing is unlikely to land.
Questions for the listing agent
- Built in 1978 — when were the roof, HVAC, electrical panel, plumbing, and water heater last replaced?
- Is there a deadline driving the sale (1031 exchange, divorce, estate, relocation)? That informs how much negotiation room exists.
- Schools are B-rated — typically a magnet for longer-tenancy family renters. What's the average tenant stay here, and is there a school-zone premium baked into asking?
- What's the average days-on-market for RENTAL listings here right now (not sales)? A rising rental-DOM trend means longer vacancies and softer asking-rent achievability than the comps imply.
- What's the recent tenant-quality profile in this submarket — average credit score on applications, eviction rate, late-payment / NSF rate, and stable-employment percentage? A property-management company in the area should have these aggregated.
- How much new for-sale + rental construction is in the pipeline within 1–3 miles? Heavy new supply typically softens prices + rents 12–24 months out; constrained supply supports both.
Investment metrics
- 1% rule
- 2.79% ✓
- Cap rate
- 24.44%
- Cash-on-cash
- 64.80%
- DSCR
- 3.88
- GRM
- 3.0
CMA / ARV
- ARV (on-the-fly)
- $126,280
- Comps found
- 8
Show comp detail 8 sales within ~0.75 mi
| Address | Dist | Beds/Ba | Sqft | Sold | Price | $/sf | Match |
|---|---|---|---|---|---|---|---|
| 79 Olga Way | 0.06mi | 3/2.0 | 1,440 (-6%) | 1mo | $155,000 | $108 | 85 |
| 150 Rimma Way | 0.08mi | 3/2.0 | 1,527 (-1%) | 14mo | $130,000 | $85 | 84 |
| 156 Rimma Way | 0.08mi | 2/2.0 (-1) | 1,440 (-6%) | 3mo | $115,000 | $80 | 78 |
| 143 Olga Way | 0.14mi | 3/2.0 | 1,440 (-6%) | 7mo | $84,000 | $58 | 76 |
| 41 Yefim Way | 0.08mi | 2/2.0 (-1) | 1,560 (+1%) | 20mo | $175,000 | $112 | 72 |
| 14 Olga Way | 0.18mi | 2/2.0 (-1) | 1,440 (-6%) | 5mo | $110,000 | $76 | 72 |
| 72 Lora Way | 0.08mi | 2/2.0 (-1) | 1,440 (-6%) | 16mo | $79,950 | $56 | 67 |
| 103 Tanya Way | 0.05mi | 2/2.0 (-1) | 1,656 (+8%) | 23mo | $135,000 | $82 | 61 |
Match score weights: distance 35% · size 25% · config 20% · recency 20%. Top-matched comps best support the ARV.
Projected returns pro-forma
-3.0% appreciation · 3.54% rent growth · sell at horizon
- IRR
- 64.6%
- Equity multiple
- 3.92×
- Total profit
- $93,911
- Equity at exit
- $17,147
- IRR
- 69.1%
- Equity multiple
- 8.20×
- Total profit
- $231,843
- Equity at exit
- $9,943
Cash invested: $32,200 (down + closing). Projections, not guarantees.
Landlord ↔ Tenant lean methodology
- Overall (STATE)
- 18 Strongly Tenant-Friendly
- State California
- 18 Strongly Tenant-Friendly · D+13
- County
- — inherits STATE
- City
- — inherits STATE
ZIP-level market 95661
- Rents YoY
- 3.5%
- Active inventory
- 118
- Price-to-rent
- 3.0×
Monthly cashflow live
- Estimated rent
- $3,207 high interval (Pro) →
- Mortgage (P&I)
- −$603
- Tax est. 1.5%
- −$144 /mo · $1,725/yr
- Insurance
- −$48
- HOA
- −$0
- Vacancy / Maint / Mgmt
- −$673
- Net cashflow
- $1,739
Break-even live
UW: 25.0% down · 7.5% · 30yr · 1.5% tax · 5.0% vac · 8.0% maint · 8.0% mgmt
Financing live
Cash to close
- Down payment
- $28,750
- Closing costs
- $3,450
- Reserves months
- —
- Total cash needed
- —
Loan-product check · same deal, 3 products live
Conventional
25% down · 7.5% · 30yr
- Down + closing
- —
- Monthly P&I
- —
- Monthly cashflow
- —
- DSCR
- —
- Eligible?
- —
Personal DTI + credit; lowest rate.
DSCR
20% down · 8.5% · 30yr
- Down + closing
- —
- Monthly P&I
- —
- Monthly cashflow
- —
- DSCR
- —
- Eligible?
- —
No personal income docs; deal must DSCR.
Hard money
10% down · 12.0% · 12mo
- Down + closing
- —
- Monthly P&I
- —
- Monthly cashflow
- —
- DSCR
- —
- Eligible?
- —
Short-term bridge; refi at stabilization.
Rent comps 8 comps
| Address | Beds | Baths | Sqft | Rent | $/sqft | DOM | Units | Dist |
|---|---|---|---|---|---|---|---|---|
| 2307 N Cirby Way Roseville, CA | 4.0 | 2.0 | 1327 | $3,500 | $2.64 | 1d | 1 | 0.41mi |
| 8276 Longden Cir Citrus Heights, CA | 4.0 | 3.0 | 2100 | $3,500 | $1.67 | 3d | 1 | 0.46mi |
| 504 Bridle Ct Roseville, CA | 3.0 | 2.0 | 1980 | $5,450 | $2.75 | 3d | 1 | 0.92mi |
| 1519 Pine Valley Cir Roseville, CA | 3.0 | 2.0 | 1577 | $2,750 | $1.74 | 10d | 1 | 0.92mi |
| 7898 Claypool Way Citrus Heights, CA | 3.0 | 2.0 | 1317 | $2,500 | $1.90 | 17d | 1 | 1.12mi |
| 8208 Charlotte Ave Citrus Heights, CA | 3.0 | 2.0 | 1401 | $2,750 | $1.96 | 7d | 1 | 1.14mi |
| 8629 El Sobrante Way Orangevale, CA | 3.0 | 2.0 | 1117 | $2,500 | $2.24 | 43d | 1 | 1.39mi |
| 8800 Sierra College Blvd Roseville, CA | 1.0–3.0 | 1.0–2.0 | 1034 | $2,734 | $2.64 | 1d | 45 | 1.42mi |
Listing history 7 events
-
2026-06-18days on market $115,000 Active 7 DOM
-
2026-06-17days on market $115,000 Active 6 DOM
-
2026-06-16days on market $115,000 Active 5 DOM
-
2026-06-15days on market $115,000 Active 4 DOM
-
2026-06-13days on market $115,000 Active 2 DOM
-
2026-06-13remarks 699-char remark
-
2026-06-13$115,000 Active 1 DOM
ⓘ Source: listings_history table (triggers on properties + properties_extension) + one-shot
backfill from property_details.listing_events for pre-trigger history.
Nearby sold comps map
Loading sold comps map…
Walkable amenities ~0.75 mi
Loading nearby amenities…
Taxation est. · year 1
- Rental income
- $38,484
- − Mortgage interest
- −$6,442
- − Property taxes
- −$1,725
- − Insurance
- −$575
- − Repairs & maintenance
- −$3,079
- − Management
- −$3,079
- − Depreciation
- −$3,345
- Taxable income
- $20,240
- Est. tax owed @ 24.0%
- −$4,857
- After-tax cash flow
- $16,008/yr
For passive investors: Depreciation is non-cash, so a rental often shows a tax loss while cash-flowing — sheltering income. Rental losses are passive: they offset passive income freely, and up to $25,000/yr can offset ordinary (W-2) income if you actively participate and your MAGI is under $100k (phasing out to $0 by $150k); unused losses carry forward. On sale, claimed depreciation is recaptured at up to 25%, and gains may owe capital-gains tax (a 1031 exchange can defer both). Figures are a year-1 estimate at your 24.0% rate — not tax advice; consult a CPA.
Condition & rehab AI · 13 photos
This manufactured home is in good condition with updated interiors and a well-maintained exterior. Minor touch-ups and some maintenance could further enhance its value for resale or rental.
Value-add opportunities
- Resale Paint exterior siding — Fresh paint can enhance curb appeal and home value.
- Rental Replace or clean gutters — Clean gutters improve drainage and prevent water damage, which is important for rental properties.
Renovation cost estimate screening
Value-add ROI direction
- Resale Paint exterior siding — Fresh paint can enhance curb appeal and home value. ↑
- Rental Replace or clean gutters — Clean gutters improve drainage and prevent water damage, which is important for rental properties. ↑
ⓘ Cost ranges are severity-bucket heuristics (US national rule-of-thumb). Get contractor quotes + a written scope before underwriting a rehab budget.
Schools (NCES district)
- District
- Roseville Joint Union High
- NCES district ID
- 0633630
- Math proficiency
- 42% ▼ -6.00%
- Reading proficiency
- 71% ▼ -3.00%
- Median HH income
- $81,930
- Composite
- 51.11/100
- National rank
- #1763
- State rank
- #86 of 517 in CA
Livability — Roseville
- Score
- 77/100
- State rank
- #90
- US rank
- #3239
Category grades
Schools grade is shown separately in the Schools card above.
Census & demographics
- Census place
- Roseville, CA
- County
- Placer County · 390,510 people
- City population
- 161,837
- Metro
- Sacramento-Roseville-Folsom, CA
- Population (ZIP)
- 32,589
- Household income
- $105,925
- Rent vs Own
- Severe rent burden
- 1617.0
Population outlook (Placer County) Hauer SSP2
- Today (2025)
- 422,709 people
- By 2030
- 444,249 · +5.1%
- By 2040
- 480,192 · +13.6%
- By 2050
- 506,390 · +19.8%
- By 2075
- 550,219 · +30.2%
- By 2100
- 547,760 · +29.6%
Race, ethnicity, and origin ACS 2023
- Neighborhood character
- Predominantly White (68%)
- Race & ethnicity
- White 68% Hispanic / Latino 15% Two or more races 13% Asian 9% Black 2%
- Hispanic origin (detail)
- Mexican 11%
- Common ancestry
- Lithuanian 2% Portuguese 2% Italian 2%
- Foreign-born
- 13% · Canada, China, Vietnam
- Languages at home
- 83% English-only · Spanish 5% Other Indo-European 4% Russian/Polish/Slavic 3%
Political lean MEDSL · Placer
- 2024 margin
- Lean R (+8.5) · D 44.3% · R 52.8% · Other 2.9%
- 2008→2024 swing
- +2.8pp toward D · 2008: -11.3pp · 2024: -8.5pp
- All cycles
- 2024: R+8.5 2020: R+6.7 2016: R+11.3 2012: R+20.1 2008: R+11.3
Not yet ingested
- Civics
- —
Market trends
- HPI YoY
- ▼ -442.54%
- Current HPI
- 274.7033
- Rent YoY
- ▲ 3.54%
- Metro
- Sacramento-Roseville-Folsom, CA
- State GDP YoY
- ▲ 3.21%
- F500 in state
- 116
Industry mix (Fortune 500 HQ in CA)
| Industry | F500 HQs | Revenue |
|---|---|---|
| Technology | 27 | $1,492B |
|
||
| Financial Services | 3 | $174B |
|
||
| Retail | 3 | $44B |
|
||
| Insurance | 3 | $26B |
|
||
| Media / Entertainment | 2 | $115B |
|
||
| Pharmaceuticals / Biotech | 2 | $62B |
|
||
Cash-flow waterfall
monthlySold comps — $/sqft
last 12 mo · ≤1 miLoading sold comps…