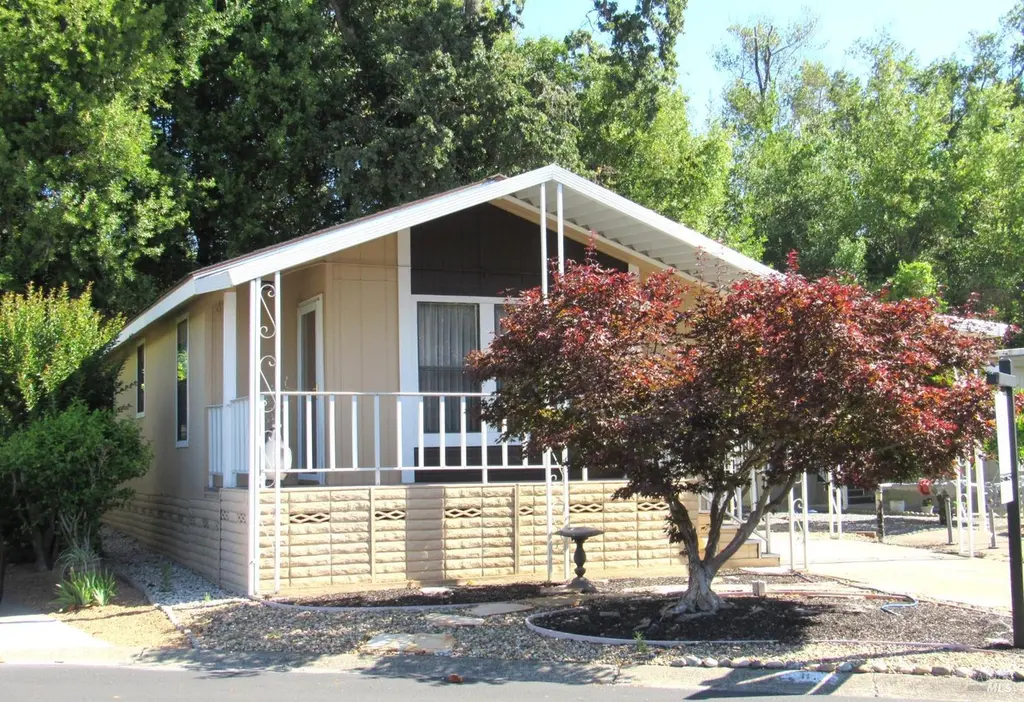
31 Ramon St · Sonoma, CA
Flood risk 5/10 · Moderate
- FEMA flood zone
- X (unshaded)
- Chance of flooding over 30 yrs
- 0.24%
- Est. flood insurance / yr
- $507 – $1,088
Fire risk 6/10 · Moderate
- Est. fire insurance / yr
- $659 – $1,223
Heat risk 4/10 · Minor
- Hot days now (above 96°F)
- 7 days/yr
- Hot days in 30 yrs
- 15 days/yr
Wind risk 1/10 · Minimal
- Chance of severe wind over 30 yrs
- —
Air-quality risk 9/10 · Severe
- Unhealthy air days now
- 19 days/yr
- Unhealthy air days in 30 yrs
- 19 days/yr
Risk factors via First Street. Map © Google.
Why this score? — see what drove the C+ grade
The composite is a weighted blend of 9 inputs, each scored 0–100. Each bar is that input's sub-score; the figure is the points it added to the 100-point composite (weight × sub-score).
- Cash flow +30.0/30.0
- DSCR +10.0/10.0
- 1% rule +9.5/10.0
- Livability +3.7/5.0
- Schools +3.4/10.0
- Rent growth +2.7/5.0
- Condition / age +2.5/5.0
- ARV discount +0.0/15.0
- Appreciation +0.0/10.0
$199,000
🖨 Deal sheet 📄 Offer letter ✓ Due diligence
Listing remarks
Welcome to Sonoma Oaks Adult 55+ Mobile Home Park, where peaceful Wine Country living meets comfort and convenience. Nestled in one of Sonoma's most desirable locations, this charming home offers the perfect blend of relaxation, community, and easy living. This 2-bedroom, 1-bath home features approximately 1,014 square feet of comfortable living space in a peaceful setting surrounded by greenery and the gentle sounds of nature. Residents of Sonoma Oaks enjoy wonderful community amenities including a sparkling swimming pool, clubhouse with library, game room, meeting room, and full kitchen. Conveniently located near Maxwell Park, Shopping Center, the Sonoma Plaza, restaurants, banks, medical
Key facts
- Community amenities
- Meeting room
- Game room
Tags
Property features AI
Finance
- Financial info: Land lease present (space rent and land lease amounts recorded)
- HOA & community: No homeowners association; Senior community; Land lease (space rent applies)
Exterior
- Parking: 2 parking spaces; Attached covered parking; No garage
- Security: Carbon monoxide detector; Smoke detector
- Utilities: Individual electric meter; Individual gas meter; Public sewer
- Home design: Manufactured home in park (double wide); Faces south; Original condition
- Construction: Composition roof; Harbor Springs (make) manufactured by Fleetwood; Skirt: other
- Exterior features: Covered deck; Carpeted patio/porch; Porch steps; Carport awning; Close to clubhouse
Interior
- Kitchen: Dishwasher; Disposal; Free standing gas range; Free standing refrigerator; Range hood; Breakfast area; Laminate counters
- Bedrooms: 2 bedrooms
- Flooring: Carpet; Laminate; Linoleum; Slate
- Bathrooms: 1 full bathroom with double sinks and tub/shower combo
- Heating & cooling: Central heating; Evaporative cooler
- Interior features: Dishwasher; Disposal; Free standing gas range; Free standing refrigerator; Range hood; Breakfast area; Laminate counters; Carbon monoxide detector; Smoke detector; Inside laundry area
- Laundry & utility: Laundry inside
Neighborhood map
What this means for you Summary
Snapshot
- This is a 2-bed/1.0-bath manufactured listed at $199k.
Deal economics
- At list price, monthly cash flow is $908 ($11k/yr) — positive.
- The deal already cash-flows at list — no discount required.
- Meets the 1% rule at list price ($3k rent vs $199k).
- Recommended offer: $196k (1.5% below list) — sets the bar for market timing.
- Cap rate 11.8% vs local median 1.4% in Sonoma — top-decile yield for the area; either an underpriced asset or a hidden risk that comps aren't pricing in. Stress-test before assuming the spread holds.
Location & tenants
- Location reads 74/100 on livability (#146 in CA, #4,943 nationally) — a middle-class / working-renter tenant base. Strengths: amenities A+, employment A+, health & safety A+; Watch: commute F, cost of living F.
- Sonoma Valley Unified (town): math 27% / reading 42% proficiency, ranked #849 of 1,400 in CA (top 61%) — families likely to look elsewhere, expect single-tenant / working-renter base with shorter leases.
- Market conditions: Rents flat; 263 active listings in the ZIP; 14 comparable units currently listed for rent nearby; rentals at typical pace (median 14d on market — plan ~3-4 weeks tenant-placement turnaround); solid renter incomes; 1,039 units permitted in Sonoma County in 2024 (185 in 5+ unit buildings).
- This rent runs 33% of the median local income ($105k/yr) — at the standard rent-burdened threshold; future hikes will face affordability resistance.
Forward outlook
- Local home prices are declining (-3.0%/yr); year-one equity from $1k of loan paydown is wiped out by about $6k of value loss. Plan a longer hold.
- Sonoma County population projected at +8% by 2050 — modest demand growth; plan on rents tracking national, not racing it.
- At projected returns (-3.0% appreciation + 0.8% rent growth), your $56k cash investment doubles in ~8 years — after that, you're playing with house money.
Negotiation context
- It's been on market 15 days — a 2% lower offer ($196k) is reasonable based on typical stale-listing flexibility.
Risks & watch-outs
- Climate carrying-cost: moderate flood risk; major wildfire risk — expect insurance premiums to compound above CPI over the hold.
Questions for the listing agent
- Is there a deadline driving the sale (1031 exchange, divorce, estate, relocation)? That informs how much negotiation room exists.
- What's the average days-on-market for RENTAL listings here right now (not sales)? A rising rental-DOM trend means longer vacancies and softer asking-rent achievability than the comps imply.
- What's the recent tenant-quality profile in this submarket — average credit score on applications, eviction rate, late-payment / NSF rate, and stable-employment percentage? A property-management company in the area should have these aggregated.
- How much new for-sale + rental construction is in the pipeline within 1–3 miles? Heavy new supply typically softens prices + rents 12–24 months out; constrained supply supports both.
Investment metrics
- 1% rule
- 1.45% ✓
- Cap rate
- 11.77%
- Cash-on-cash
- 19.56%
- DSCR
- 1.87
- GRM
- 5.7
CMA / ARV
- ARV (on-the-fly)
- $162,240
- Comps found
- 5
Show comp detail 5 sales within ~0.75 mi
| Address | Dist | Beds/Ba | Sqft | Sold | Price | $/sf | Match |
|---|---|---|---|---|---|---|---|
| 49 Ramon St | 0.12mi | 2/2.0 | 936 (-8%) | 1mo | $150,000 | $160 | 77 |
| 98 Caballeros St | 0.08mi | 2/2.0 | 940 (-7%) | 23mo | $136,000 | $145 | 61 |
| 95 Ramon St | 0.11mi | 3/2.0 (+1) | 1,056 (+4%) | 22mo | $245,000 | $232 | 60 |
| 18715 Sonoma Hwy #2 | 0.48mi | 2/2.0 | 960 (-5%) | 5mo | $70,000 | $73 | 60 |
| 866 Petaluma Ave | 0.60mi | 2/1.0 | 1,104 (+9%) | 22mo | $1,050,000 | $951 | 39 |
Match score weights: distance 35% · size 25% · config 20% · recency 20%. Top-matched comps best support the ARV.
Projected returns pro-forma
-3.0% appreciation · 0.79% rent growth · sell at horizon
- IRR
- 9.1%
- Equity multiple
- 1.35×
- Total profit
- $19,348
- Equity at exit
- $29,672
- IRR
- 16.3%
- Equity multiple
- 2.20×
- Total profit
- $66,816
- Equity at exit
- $17,206
Cash invested: $55,720 (down + closing). Projections, not guarantees.
Landlord ↔ Tenant lean methodology
- Overall (STATE)
- 18 Strongly Tenant-Friendly
- State California
- 18 Strongly Tenant-Friendly · D+13
- County
- — inherits STATE
- City
- — inherits STATE
ZIP-level market 95476
- Rents YoY
- 0.8%
- Active inventory
- 263
- Price-to-rent
- 5.7×
Monthly cashflow live
- Estimated rent
- $2,890 high interval (Pro) →
- Mortgage (P&I)
- −$1,044
- Tax est. 1.5%
- −$249 /mo · $2,985/yr
- Insurance
- −$83
- HOA
- −$0
- Vacancy / Maint / Mgmt
- −$607
- Net cashflow
- $908
Break-even live
UW: 25.0% down · 7.5% · 30yr · 1.5% tax · 5.0% vac · 8.0% maint · 8.0% mgmt
Financing live
Cash to close
- Down payment
- $49,750
- Closing costs
- $5,970
- Reserves months
- —
- Total cash needed
- —
Loan-product check · same deal, 3 products live
Conventional
25% down · 7.5% · 30yr
- Down + closing
- —
- Monthly P&I
- —
- Monthly cashflow
- —
- DSCR
- —
- Eligible?
- —
Personal DTI + credit; lowest rate.
DSCR
20% down · 8.5% · 30yr
- Down + closing
- —
- Monthly P&I
- —
- Monthly cashflow
- —
- DSCR
- —
- Eligible?
- —
No personal income docs; deal must DSCR.
Hard money
10% down · 12.0% · 12mo
- Down + closing
- —
- Monthly P&I
- —
- Monthly cashflow
- —
- DSCR
- —
- Eligible?
- —
Short-term bridge; refi at stabilization.
Rent comps 14 comps
| Address | Beds | Baths | Sqft | Rent | $/sqft | DOM | Units | Dist |
|---|---|---|---|---|---|---|---|---|
| 21 Ramon St Sonoma, CA | 2.0 | 2.0 | 1440 | $2,250 | $1.56 | 23d | 1 | 0.08mi |
| 210 Tuscany Pl Sonoma, CA | 1.0–2.0 | 1.0–2.0 | 1200 | $2,750 | $2.29 | 14d | 1 | 0.21mi |
| 434 Bernice Ln Unit 1546207P Sonoma, CA | 2.0 | 2.0 | 979 | $4,564 | $4.66 | 14d | 1 | 0.59mi |
| 655 W Spain St Sonoma, CA | 2.0 | 2.5 | 1349 | $3,525 | $2.61 | 14d | 1 | 0.64mi |
| 19019 5th St W Sonoma, CA | 3.0 | 2.0 | 1286 | $3,400 | $2.64 | 14d | 1 | 0.66mi |
| 18495 Riverside Dr Sonoma, CA | 2.0 | 1.0 | 860 | $2,800 | $3.26 | 14d | 1 | 0.72mi |
| 340 Church St Sonoma, CA | 3.0 | 2.5 | 1282 | $3,750 | $2.93 | 44d | 1 | 0.88mi |
| 342 Church St Sonoma, CA | 1.0 | 1.0 | 700 | $2,600 | $3.71 | 44d | 1 | 0.88mi |
| 18109 Barrett Ave Unit 2 Sonoma, CA | 2.0 | 1.0 | 760 | $2,295 | $3.02 | 14d | 1 | 0.99mi |
| 18260 Las Lomas Rd Sonoma, CA | 3.0 | 2.0 | 1350 | $3,750 | $2.78 | 23d | 1 | 1.05mi |
| 663 Spring Ln Sonoma, CA | 2.0 | 1.0 | 1050 | $3,200 | $3.05 | 44d | 1 | 1.21mi |
| 790 2nd St W Sonoma, CA | 1.0–2.0 | 1.0–1.5 | 975 | $2,660 | $2.73 | 14d | 3 | 1.27mi |
| 126 Blue Wing Dr Sonoma, CA | 2.0 | 2.0 | 1156 | $2,975 | $2.57 | 14d | 2 | 1.29mi |
| 126 Blue Wing Dr #11 Sonoma, CA | 2.0 | 2.0 | 1156 | $3,200 | $2.77 | 14d | 1 | 1.29mi |
Listing history 12 events
-
2026-06-18days on market $199,000 Active 15 DOM
-
2026-06-17days on market $199,000 Active 14 DOM
-
2026-06-16days on market $199,000 Active 13 DOM
-
2026-06-15days on market $199,000 Active 12 DOM
-
2026-06-14days on market $199,000 Active 10 DOM
-
2026-06-13days on market $199,000 Active 9 DOM
-
2026-06-10days on market $199,000 Active 7 DOM
-
2026-06-09days on market $199,000 Active 6 DOM
-
2026-06-08days on market $199,000 Active 5 DOM
-
2026-06-07days on market $199,000 Active 4 DOM
-
2026-06-05remarks 699-char remark
-
2026-06-05$199,000 Active 1 DOM
ⓘ Source: listings_history table (triggers on properties + properties_extension) + one-shot
backfill from property_details.listing_events for pre-trigger history.
Climate risk First Street
- Flood 5/10 Major FEMA zone X (unshaded) · 24% chance over 30 yrs
- Wildfire 6/10 Major
- Heat 4/10 Moderate 7 d/yr ≥96°F today · 15 d/yr by 30 yrs out
- Wind 1/10 Low
- Air quality 9/10 Extreme 19 unhealthy d/yr today · 19 by 30 yrs out
Nearby sold comps map
Loading sold comps map…
Walkable amenities ~0.75 mi
Loading nearby amenities…
Taxation est. · year 1
- Rental income
- $34,684
- − Mortgage interest
- −$11,147
- − Property taxes
- −$2,985
- − Insurance
- −$995
- − Repairs & maintenance
- −$2,775
- − Management
- −$2,775
- − Depreciation
- −$5,789
- Taxable income
- $8,219
- Est. tax owed @ 24.0%
- −$1,972
- After-tax cash flow
- $8,925/yr
For passive investors: Depreciation is non-cash, so a rental often shows a tax loss while cash-flowing — sheltering income. Rental losses are passive: they offset passive income freely, and up to $25,000/yr can offset ordinary (W-2) income if you actively participate and your MAGI is under $100k (phasing out to $0 by $150k); unused losses carry forward. On sale, claimed depreciation is recaptured at up to 25%, and gains may owe capital-gains tax (a 1031 exchange can defer both). Figures are a year-1 estimate at your 24.0% rate — not tax advice; consult a CPA.
Schools (NCES district)
- District
- Sonoma Valley Unified
- NCES district ID
- 0637200
- Math proficiency
- 27% ▼ -1.00%
- Reading proficiency
- 42% ▲ 1.00%
- Median HH income
- $63,880
- Composite
- 33.88/100
- National rank
- #10355
- State rank
- #849 of 1400 in CA
Livability — Sonoma
- Score
- 74/100
- State rank
- #146
- US rank
- #4943
Category grades
Schools grade is shown separately in the Schools card above.
Census & demographics
- Census place
- Sonoma, CA
- County
- Sonoma County · 449,805 people
- City population
- 35,196
- Metro
- Santa Rosa-Petaluma, CA
- Population (ZIP)
- 35,196
- Household income
- $105,374
- Rent vs Own
- Severe rent burden
- 1218.0
Population outlook (Sonoma County) Hauer SSP2
- Today (2025)
- 539,935 people
- By 2030
- 554,870 · +2.8%
- By 2040
- 573,262 · +6.2%
- By 2050
- 580,715 · +7.6%
- By 2075
- 579,229 · +7.3%
- By 2100
- 547,835 · +1.5%
Race, ethnicity, and origin ACS 2023
- Neighborhood character
- Predominantly White (66%)
- Race & ethnicity
- White 66% Hispanic / Latino 28% Two or more races 13% Asian 2% Black 1%
- Hispanic origin (detail)
- Mexican 23%
- Common ancestry
- Italian 5% Lithuanian 4% Portuguese 3%
- Foreign-born
- 16% · Canada, Dominican Republic
- Languages at home
- 75% English-only · Spanish 21% Other Indo-European 1% Other Asian/Pacific 0%
Political lean MEDSL · Sonoma
- 2024 margin
- Solid D (+46.2) · D 71.4% · R 25.2% · Other 3.3%
- 2008→2024 swing
- -3.4pp toward R · 2008: 49.6pp · 2024: 46.2pp
- All cycles
- 2024: D+46.2 2020: D+51.5 2016: D+47.9 2012: D+44.9 2008: D+49.6
Not yet ingested
- Civics
- —
Market trends
- HPI YoY
- ▼ -1116.03%
- Current HPI
- 236.6408
- Rent YoY
- ▲ 0.79%
- Metro
- Santa Rosa-Petaluma, CA
- State GDP YoY
- ▲ 3.21%
- F500 in state
- 116
Industry mix (Fortune 500 HQ in CA)
| Industry | F500 HQs | Revenue |
|---|---|---|
| Technology | 27 | $1,492B |
|
||
| Financial Services | 3 | $174B |
|
||
| Retail | 3 | $44B |
|
||
| Insurance | 3 | $26B |
|
||
| Media / Entertainment | 2 | $115B |
|
||
| Pharmaceuticals / Biotech | 2 | $62B |
|
||
Price history
1 event — show timeline
- 2026-06-03 Listed $199,000 BAREIS
Property tax history
-3.2%/yrLatest (2025): $167 · -0.2% YoY. Source: county tax records.
Cash-flow waterfall
monthlySold comps — $/sqft
last 12 mo · ≤1 miLoading sold comps…