361 Katie Ln · Chatsworth, GA
Flood risk 1/10 · Minimal
- FEMA flood zone
- X (unshaded)
- Chance of flooding over 30 yrs
- 0.0%
- Est. flood insurance / yr
- $507 – $1,088
Fire risk 5/10 · Moderate
- Est. fire insurance / yr
- $963 – $1,789
Heat risk 6/10 · Moderate
- Hot days now (above 106°F)
- 7 days/yr
- Hot days in 30 yrs
- 18 days/yr
Wind risk 3/10 · Minor
- Chance of severe wind over 30 yrs
- 4.0%
Air-quality risk 3/10 · Minor
- Unhealthy air days now
- 3 days/yr
- Unhealthy air days in 30 yrs
- 3 days/yr
Risk factors via First Street. Map © Google.
Why this score? — see what drove the C+ grade
The composite is a weighted blend of 9 inputs, each scored 0–100. Each bar is that input's sub-score; the figure is the points it added to the 100-point composite (weight × sub-score).
- Cash flow +21.7/30.0
- ARV discount +14.9/15.0
- DSCR +6.9/10.0
- 1% rule +5.7/10.0
- Livability +3.7/5.0
- Rent growth +2.5/5.0
- Condition / age +2.5/5.0
- Schools +2.3/10.0
- Appreciation +0.0/10.0
$135,000
🖨 Deal sheet (PDF) 📄 Offer letter ✓ Due diligence
Listing remarks
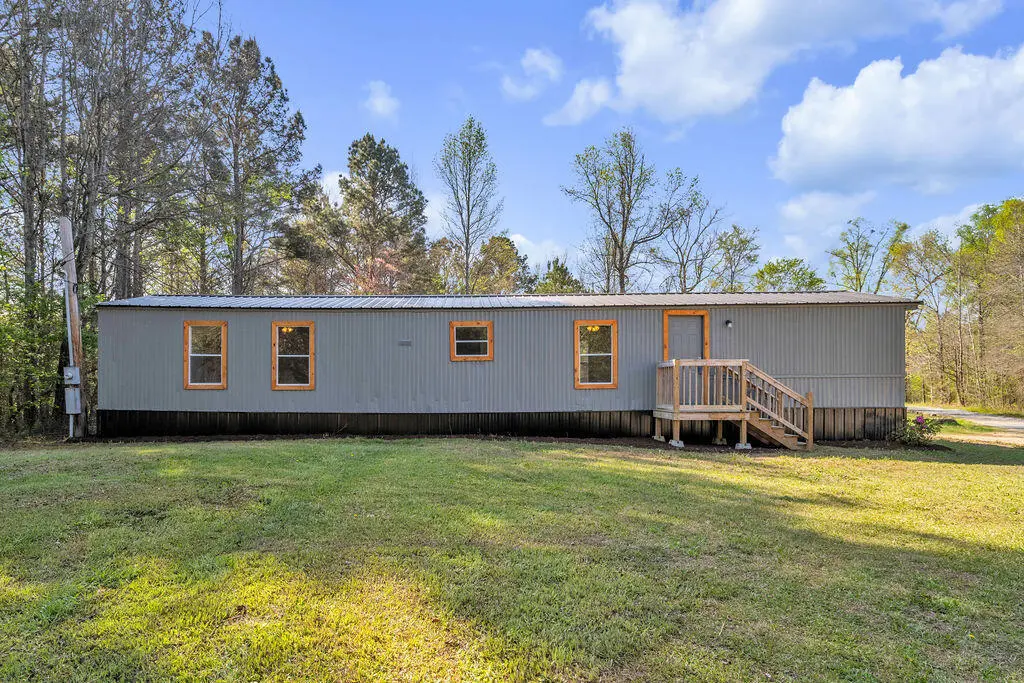
Welcome to modern country living! This stunning, fully renovated singlewide sits on a private 1-acre lot and has been transformed from top to bottom with high-end finishes. Enjoy total peace of mind with a brand-new HVAC system, new roof, and fresh underpinning. The interior features a seamless flow of new LVP flooring, a fresh neutral paint palette, and all-new cabinets throughout. The chef-inspired kitchen is a true standout, boasting gorgeous butcher block countertops and a full suite of new stainless steel appliances. Step outside onto the massive new deck, perfect for entertaining or enjoying the quiet landscape. This turnkey home offers the luxury of a new build with the space and fre
Key facts
- Private lot
- New cabinets
- New lvp flooring
Tags
Neighborhood map
What this means for you Summary
Snapshot
- This is a 3-bed/2.0-bath manufactured listed at $135k.
Deal economics
- At list price, monthly cash flow is $207 ($2k/yr) — positive.
- The deal already cash-flows at list — no discount required.
- Meets the 1% rule at list price ($1k rent vs $135k).
- Cap rate 8.1% vs local median 3.6% in Chatsworth — top-decile yield for the area; either an underpriced asset or a hidden risk that comps aren't pricing in. Stress-test before assuming the spread holds.
Location & tenants
- Location reads 74/100 on livability (#37 in GA, #4,588 nationally) — a middle-class / working-renter tenant base. Strengths: crime A+, cost of living A+, housing A+; Watch: employment C-, amenities F, commute F.
- Murray County (other): math 25% / reading 31% proficiency, ranked #107 of 174 in GA (top 62%) — low school quality limits family demand, transient renter base, plan for 1-2y turnover; 64% free/reduced lunch — lower-income household profile, screen leases tightly.
- Zoned schools: Coker Elementary School (math 25% / reading 28%, grade F, #718 of 1,228 statewide, top 59%, 641 students, 77% FRL); Gladden Middle School (math 26% / reading 30%, grade F, #265 of 470 statewide, top 57%, 548 students, 68% FRL); Murray County High School (math 10% / reading 32%, grade F, #225 of 424 statewide, top 54%, 1,102 students, 65% FRL).
- Market conditions: 281 active listings in the ZIP; 125 units permitted in Murray County in 2024 (5 in 5+ unit buildings).
Forward outlook
- Local home prices are declining (-3.0%/yr); year-one equity from $933 of loan paydown is wiped out by about $4k of value loss. Plan a longer hold.
- Murray County population projected to shrink 7% by 2050 — rents likely to lag national; underwrite the cash flow, not the appreciation.
Negotiation context
- Only 6 days on market — expect competitive offers; lowballing is unlikely to land.
- 2 sale attempts with the ask held roughly flat each time — persistent listings suggest the price (not the market) is what's stuck; bring a comps-based counter.
- Current owner paid $18k; list at $135k implies a 650% gain — meaningful room to come down on a strong offer.
Risks & watch-outs
- Climate carrying-cost: moderate wildfire risk; extreme-heat days projected 7→18/yr by 2055 (HVAC capex compounding) — expect insurance premiums to compound above CPI over the hold.
Questions for the listing agent
- Is there a deadline driving the sale (1031 exchange, divorce, estate, relocation)? That informs how much negotiation room exists.
- Schools are F-rated, which usually means shorter tenancies and higher turnover. Who's the typical renter profile here, and what's been the actual vacancy rate?
- What's the average days-on-market for RENTAL listings here right now (not sales)? A rising rental-DOM trend means longer vacancies and softer asking-rent achievability than the comps imply.
- What's the recent tenant-quality profile in this submarket — average credit score on applications, eviction rate, late-payment / NSF rate, and stable-employment percentage? A property-management company in the area should have these aggregated.
- How much new for-sale + rental construction is in the pipeline within 1–3 miles? Heavy new supply typically softens prices + rents 12–24 months out; constrained supply supports both.
Investment metrics
- 1% rule
- 1.07% ✓
- Cap rate
- 8.13%
- Cash-on-cash
- 6.57%
- DSCR
- 1.29
- GRM
- 7.8
CMA / ARV
- ARV (on-the-fly)
- $161,460
- Comps found
- 1
Show comp detail 1 sale within ~0.75 mi
| Address | Dist | Beds/Ba | Sqft | Sold | Price | $/sf | Match |
|---|---|---|---|---|---|---|---|
| 75 Willow Springs Rd | 0.44mi | 3/2.0 | 1,568 (+12%) | 11mo | $180,000 | $115 | 51 |
Match score weights: distance 35% · size 25% · config 20% · recency 20%. Top-matched comps best support the ARV.
Projected returns pro-forma
-3.0% appreciation · 3.0% rent growth · sell at horizon
- IRR
- -6.2%
- Equity multiple
- 0.77×
- Total profit
- $-8,672
- Equity at exit
- $20,129
- IRR
- 3.5%
- Equity multiple
- 1.25×
- Total profit
- $9,512
- Equity at exit
- $11,672
Cash invested: $37,800 (down + closing). Projections, not guarantees.
Landlord ↔ Tenant lean methodology
- Overall (STATE)
- 90 Strongly Landlord-Friendly
- State Georgia
- 90 Strongly Landlord-Friendly · R+3
- County
- — inherits STATE
- City
- — inherits STATE
ZIP-level market 30705
- Home prices YoY
- -11.2%
- Active inventory
- 281
- Price-to-rent
- 7.8×
Monthly cashflow live
- Estimated rent
- $1,443 medium interval (Pro) →
- Mortgage (P&I)
- −$708
- Tax est. 1.5%
- −$169 /mo · $2,025/yr
- Insurance
- −$56
- HOA
- −$0
- Vacancy / Maint / Mgmt
- −$303
- Net cashflow
- $207
Break-even live
Sensitivity live
| Price | -10% $300 | -5% $254 | +0% $207 | +5% $160 | +10% $114 |
|---|---|---|---|---|---|
| Rent | -10% $93 | -5% $150 | +0% $207 | +5% $264 | +10% $321 |
| Rate | -1.0pp $275 | -0.5pp $241 | base $207 | +0.5pp $172 | +1.0pp $136 |
UW: 25.0% down · 7.5% · 30yr · 1.5% tax · 5.0% vac · 8.0% maint · 8.0% mgmt
Financing live
Cash to close
- Down payment
- $33,750
- Closing costs
- $4,050
- Reserves months
- —
- Total cash needed
- —
Loan-product check · same deal, 3 products live
Conventional
25% down · 7.5% · 30yr
- Down + closing
- —
- Monthly P&I
- —
- Monthly cashflow
- —
- DSCR
- —
- Eligible?
- —
Personal DTI + credit; lowest rate.
DSCR
20% down · 8.5% · 30yr
- Down + closing
- —
- Monthly P&I
- —
- Monthly cashflow
- —
- DSCR
- —
- Eligible?
- —
No personal income docs; deal must DSCR.
Hard money
10% down · 12.0% · 12mo
- Down + closing
- —
- Monthly P&I
- —
- Monthly cashflow
- —
- DSCR
- —
- Eligible?
- —
Short-term bridge; refi at stabilization.
Listing history 5 events
-
2026-04-09status Pending
-
2026-04-07status Active
-
2026-04-06status Pending
-
2026-04-02$135,000 Active
-
1992-01-25soldstatus $18,000
ⓘ Source: listings_history table (triggers on properties + properties_extension) + one-shot
backfill from property_details.listing_events for pre-trigger history.
Climate risk First Street
- Flood 1/10 Low FEMA zone X (unshaded) · 0% chance over 30 yrs
- Wildfire 5/10 Major
- Heat 6/10 Major 7 d/yr ≥106°F today · 18 d/yr by 30 yrs out
- Wind 3/10 Moderate 4% chance of damaging wind over 30 yrs
- Air quality 3/10 Moderate 3 unhealthy d/yr today · 3 by 30 yrs out
Nearby sold comps map
Loading sold comps map…
Walkable amenities ~0.75 mi
Loading nearby amenities…
Taxation est. · year 1
- Rental income
- $17,315
- − Mortgage interest
- −$7,562
- − Property taxes
- −$2,025
- − Insurance
- −$675
- − Repairs & maintenance
- −$1,385
- − Management
- −$1,385
- − Depreciation
- −$3,927
- Taxable income
- $356
- Est. tax owed @ 24.0%
- −$85
- After-tax cash flow
- $2,398/yr
For passive investors: Depreciation is non-cash, so a rental often shows a tax loss while cash-flowing — sheltering income. Rental losses are passive: they offset passive income freely, and up to $25,000/yr can offset ordinary (W-2) income if you actively participate and your MAGI is under $100k (phasing out to $0 by $150k); unused losses carry forward. On sale, claimed depreciation is recaptured at up to 25%, and gains may owe capital-gains tax (a 1031 exchange can defer both). Figures are a year-1 estimate at your 24.0% rate — not tax advice; consult a CPA.
Schools (NCES district)
- District
- Murray County
- NCES district ID
- 1303840
- Math proficiency
- 25% ▼ -13.00%
- Reading proficiency
- 31% ▼ -6.00%
- Median HH income
- $38,127
- Composite
- 23.39/100
- National rank
- #7901
- State rank
- #107 of 174 in GA
Livability — Chatsworth
- Score
- 74/100
- State rank
- #37
- US rank
- #4588
Category grades
Schools grade is shown separately in the Schools card above.
Census & demographics
- Population (ZIP)
- 33,078
Population outlook (Murray County) Hauer SSP2
- Today (2025)
- 39,666 people
- By 2030
- 39,301 · -0.9%
- By 2040
- 38,248 · -3.6%
- By 2050
- 37,015 · -6.7%
- By 2075
- 35,253 · -11.1%
- By 2100
- 34,727 · -12.5%
Race, ethnicity, and origin ACS 2023
- Neighborhood character
- Predominantly White (78%)
- Race & ethnicity
- White 78% Hispanic / Latino 18% Two or more races 8% Native American 1%
- Hispanic origin (detail)
- Mexican 13%
- Common ancestry
- Slovak 2% Romanian 1% Iranian 1%
- Foreign-born
- 7% · Canada
- Languages at home
- 85% English-only · Spanish 14%
Political lean MEDSL · Murray
- 2024 margin
- Solid R (+71.6) · D 14.1% · R 85.7%
- 2008→2024 swing
- -26.3pp toward R · 2008: -45.3pp · 2024: -71.6pp
- All cycles
- 2024: R+71.6 2020: R+69.2 2016: R+68.8 2012: R+52.6 2008: R+45.3
Not yet ingested
- Civics
- —
Market trends
- HPI YoY
- ▼ -34.36%
- Current HPI
- 271.673
- Rent YoY
- —
- Metro
- —
- State GDP YoY
- ▲ 2.66%
- F500 in state
- 28
Industry mix (Fortune 500 HQ in GA)
| Industry | F500 HQs | Revenue |
|---|---|---|
| Paper / Packaging | 2 | $29B |
|
||
| Retail | 1 | $160B |
|
||
| Transportation / Logistics | 1 | $91B |
|
||
| Airlines | 1 | $62B |
|
||
| Consumer Goods | 1 | $47B |
|
||
| Utilities | 1 | $25B |
|
||
Price history
+650.0% since first listed5 events — show timeline
- 2026-04-09 Pending — GCAR
- 2026-04-07 Relisted — GCAR
- 2026-04-06 Pending — GCAR
- 2026-04-02 Listed $135,000 GCAR
- 1992-01-25 Sold (Public Records) $18,000 Public Records
Property tax history
-4.9%/yrLatest (2025): $75 · -0.3% YoY. Source: county tax records.
Cash-flow waterfall
monthlySold comps — $/sqft
last 12 mo · ≤1 miLoading sold comps…