 Duplex
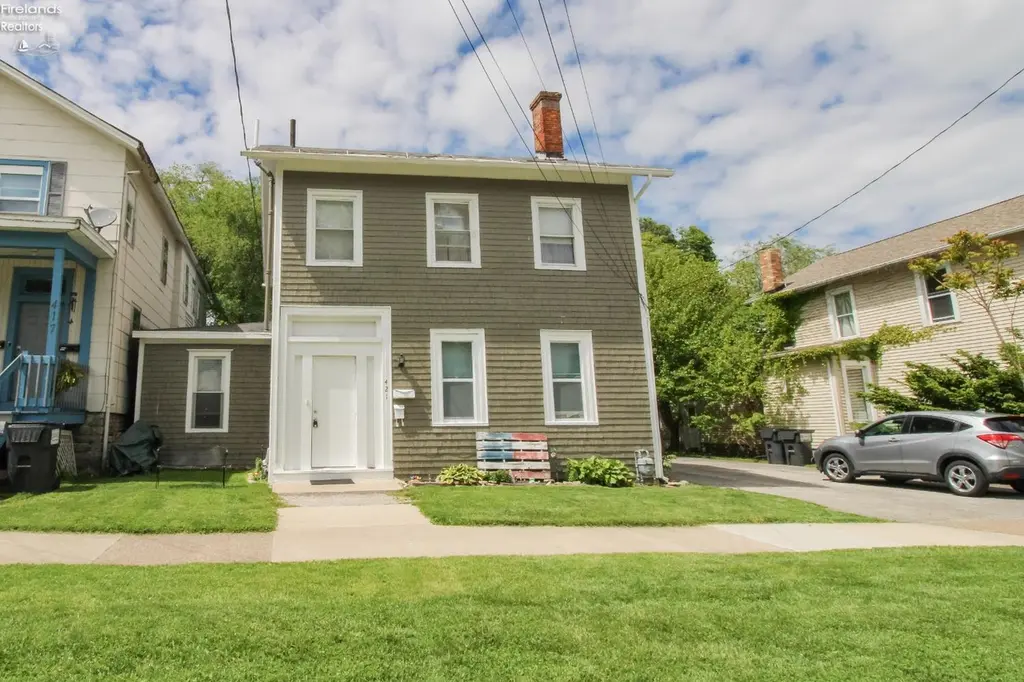
421 E Adams St · Sandusky, OH
Flood risk 1/10 · Minimal
- FEMA flood zone
- X (unshaded)
- Chance of flooding over 30 yrs
- 0.0%
- Est. flood insurance / yr
- $507 – $1,088
Fire risk 1/10 · Minimal
- Est. fire insurance / yr
- $713 – $1,323
Heat risk 3/10 · Minor
- Hot days now (above 94°F)
- 7 days/yr
- Hot days in 30 yrs
- 16 days/yr
Wind risk 2/10 · Minimal
- Chance of severe wind over 30 yrs
- —
Air-quality risk 3/10 · Minor
- Unhealthy air days now
- 2 days/yr
- Unhealthy air days in 30 yrs
- 3 days/yr
Risk factors via First Street. Map © Google.
Why this score? — see what drove the B- grade
The composite is a weighted blend of 9 inputs, each scored 0–100. Each bar is that input's sub-score; the figure is the points it added to the 100-point composite (weight × sub-score).
- Cash flow +30.0/30.0
- 1% rule +10.0/10.0
- DSCR +10.0/10.0
- ARV discount +7.5/15.0
- Livability +4.2/5.0
- Rent growth +2.5/5.0
- Schools +2.5/10.0
- Condition / age +2.5/5.0
- Appreciation +0.0/10.0
$179,900
🖨 Deal sheet (PDF) 📄 Offer letter ✓ Due diligence
Multi-family units
County records classify this as Multi-Family (2-4 Unit). Listing-text estimate: 2 units. confirmed
Listing remarks MLS
Excellent investment property! Turn key duplex located close to downtown Sandusky with both 2-bedroom units currently rented. New boiler in 2016, updated kitchens and painted in 2016. 2 car garage with off street parking. Owner pays water, sewer, gas and trash. Being sold as a package only with 230 Lawrence mls # 20221254 and 1233 W. Monroe St. mls # 20221259
Key facts
- Duplex
- Updated lower unit
- Waterfront
Tags
Property features AI
Exterior
- Parking: Detached garage with 2 spaces; Off-street paved parking
- Utilities: Public water; Public sewer
- Home design: Duplex (residential income property)
- Construction: Wood siding
- Exterior features: Asphalt roof
Interior
- Kitchen: Range; Refrigerator
- Heating & cooling: Natural gas heating; Hot water heating
- Interior features: Range; Refrigerator; Full basement
Neighborhood map
What this means for you Summary
Snapshot
- This is a 1×3bd/1ba + 1×2bd/1ba units multifamily listed at $180k.
Deal economics
- At list price, monthly cash flow is $2k ($19k/yr) — positive. Per door: $790/mo.
- The deal already cash-flows at list — no discount required.
- Meets the 1% rule at list price ($3k rent vs $180k).
- Recommended offer: $175k (3.0% below list) — sets the bar for market timing.
- Cap rate 16.8% vs local median 5.4% in Sandusky — top-decile yield for the area; either an underpriced asset or a hidden risk that comps aren't pricing in. Stress-test before assuming the spread holds.
Location & tenants
- Location reads 83/100 on livability (#63 in OH, #929 nationally) — a professional / high-income tenant draw. Strengths: commute A+, cost of living A+, housing A+; Watch: crime D-, employment F.
- Sandusky City (town): math 24% / reading 37% proficiency, ranked #583 of 656 in OH (top 89%) — families likely to look elsewhere, expect single-tenant / working-renter base with shorter leases; 71% free/reduced lunch — lower-income household profile, screen leases tightly.
- Market conditions: 209 active listings in the ZIP; 1 comparable units currently listed for rent nearby; 128 units permitted in Erie County in 2024 (5 in 5+ unit buildings).
- At $3,447/mo this rent would consume 67% of the median local household income ($62k/yr) (locally 1602% of renters already pay >50% of income on rent) — very limited rent-growth headroom before tenants either downsize or default.
Forward outlook
- Local home prices are declining (-3.0%/yr); year-one equity from $1k of loan paydown is wiped out by about $5k of value loss. Plan a longer hold.
- Erie County population projected at -15% by 2050 — secular population decline; favor cash flow + early exit over multi-decade hold.
- At projected returns (-3.0% appreciation + 3.0% rent growth), your $50k cash investment doubles in ~4 years — after that, you're playing with house money.
Negotiation context
- It's been on market 31 days — a 3% lower offer ($175k) is reasonable based on typical stale-listing flexibility.
- 3 sale attempts since 7y ago with the ask held roughly flat each time — persistent listings suggest the price (not the market) is what's stuck; bring a comps-based counter.
- Current owner paid $75k; list at $180k implies a 140% gain — meaningful room to come down on a strong offer.
Risks & watch-outs
- Watch-outs: built in 1916 — expect roof / HVAC / electrical / plumbing capex.
Questions for the listing agent
- It's been on market 31 days. Have you received any prior offers? Is the seller open to a 3% concession, seller financing, or rate buy-down credit?
- Can we see the unit-by-unit rent roll, current vacancy, and any below-market leases? What's the average tenancy length?
- What capital expenditures (roof, boiler, parking lot, exteriors) have been made in the last 5 years, and what's planned in the next 2?
- Built in 1916 — when were the roof, HVAC, electrical panel, plumbing, and water heater last replaced?
- Is there a deadline driving the sale (1031 exchange, divorce, estate, relocation)? That informs how much negotiation room exists.
- Crime grade is D in this area — have there been break-ins, vandalism, or insurance claims at this property in the last 3 years? What carrier currently insures it and at what premium?
- What's the average days-on-market for RENTAL listings here right now (not sales)? A rising rental-DOM trend means longer vacancies and softer asking-rent achievability than the comps imply.
- What's the recent tenant-quality profile in this submarket — average credit score on applications, eviction rate, late-payment / NSF rate, and stable-employment percentage? A property-management company in the area should have these aggregated.
- How much new apartment / multifamily construction is in the pipeline within 1–3 miles? Heavy new supply (>2% of stock underway) typically softens rents 12–24 months out; light construction supports rent growth.
Investment metrics
- 1% rule
- 1.92% ✓
- Cap rate
- 16.83%
- Cash-on-cash
- 37.63%
- DSCR
- 2.67
- GRM
- 4.3
CMA / ARV
No comps found within radius.
Projected returns pro-forma
-3.0% appreciation · 3.0% rent growth · sell at horizon
- IRR
- 33.6%
- Equity multiple
- 2.42×
- Total profit
- $71,441
- Equity at exit
- $26,824
- IRR
- 40.5%
- Equity multiple
- 4.81×
- Total profit
- $191,714
- Equity at exit
- $15,554
Cash invested: $50,372 (down + closing). Projections, not guarantees.
Landlord ↔ Tenant lean methodology
- Overall (STATE)
- 73 Landlord-Friendly
- State Ohio
- 73 Landlord-Friendly · R+6
- County
- — inherits STATE
- City
- — inherits STATE
ZIP-level market 44870
- Active inventory
- 209
- Price-to-rent
- 8.5×
Monthly cashflow live
- Estimated rent
- $3,447 medium interval (Pro) →
- Mortgage (P&I)
- −$943
- Tax from tax record
- −$125 /mo · $1,502/yr
- Insurance
- −$75
- HOA
- −$0
- Vacancy / Maint / Mgmt
- −$724
- Net cashflow
- $1,580
Break-even live
Sensitivity live
| Price | -10% $1,681 | -5% $1,630 | +0% $1,580 | +5% $1,529 | +10% $1,478 |
|---|---|---|---|---|---|
| Rent | -10% $1,307 | -5% $1,443 | +0% $1,580 | +5% $1,716 | +10% $1,852 |
| Rate | -1.0pp $1,670 | -0.5pp $1,625 | base $1,580 | +0.5pp $1,533 | +1.0pp $1,486 |
2-unit breakdown (identical units grouped — click to expand)
| Units | Beds | Baths | Est. rent |
|---|---|---|---|
| 1× unit | 3 | 1 | $1,769 |
| 1× unit | 2 | 1 | $1,678 |
| Total (2 units) | $3,447 | ||
UW: 25.0% down · 7.5% · 30yr · 1.5% tax · 5.0% vac · 8.0% maint · 8.0% mgmt
Financing live
Cash to close
- Down payment
- $44,975
- Closing costs
- $5,397
- Reserves months
- —
- Total cash needed
- —
Loan-product check · same deal, 3 products live
Conventional
25% down · 7.5% · 30yr
- Down + closing
- —
- Monthly P&I
- —
- Monthly cashflow
- —
- DSCR
- —
- Eligible?
- —
Personal DTI + credit; lowest rate.
DSCR
20% down · 8.5% · 30yr
- Down + closing
- —
- Monthly P&I
- —
- Monthly cashflow
- —
- DSCR
- —
- Eligible?
- —
No personal income docs; deal must DSCR.
Hard money
10% down · 12.0% · 12mo
- Down + closing
- —
- Monthly P&I
- —
- Monthly cashflow
- —
- DSCR
- —
- Eligible?
- —
Short-term bridge; refi at stabilization.
Rent comps 1 comps
| Address | Beds | Baths | Sqft | Rent | $/sqft | DOM | Units | Dist |
|---|---|---|---|---|---|---|---|---|
| 1032 Perry St Sandusky, OH | 4.0 | 2.5 | 1845 | $850 | $0.46 | 44d | 1 | 0.57mi |
Listing history 19 events
-
2026-06-18days on market $179,900 Active 31 DOM
-
2026-06-17days on market $179,900 Active 30 DOM
-
2026-06-16days on market $179,900 Active 29 DOM
-
2026-06-15days on market $179,900 Active 28 DOM
-
2026-06-14days on market $179,900 Active 26 DOM
-
2026-06-12days on market $179,900 Active 25 DOM
-
2026-06-09days on market $179,900 Active 22 DOM
-
2026-06-08days on market $179,900 Active 21 DOM
-
2026-06-07days on market $179,900 Active 20 DOM
-
2026-06-03days on market $179,900 Active 16 DOM
-
2026-06-02days on market $179,900 Active 15 DOM
-
2026-06-01days on market $179,900 Active 14 DOM
-
2026-05-31days on market $179,900 Active 13 DOM
-
2026-05-30days on market $179,900 Active 12 DOM
-
2026-05-18$179,900 Active
-
2022-06-23soldstatus $75,000 361-char remark
Show marketing remark (361 chars)
Excellent investment property! Turn key duplex located close to downtown Sandusky with both 2-bedroom units currently rented. New boiler in 2016, updated kitchens and painted in 2016. 2 car garage with off street parking. Owner pays water, sewer, gas and trash. Being sold as a package only with 230 Lawrence mls # 20221254 and 1233 W. Monroe St. mls # 20221259
-
2022-04-18$82,500 361-char remark
Show marketing remark (361 chars)
Excellent investment property! Turn key duplex located close to downtown Sandusky with both 2-bedroom units currently rented. New boiler in 2016, updated kitchens and painted in 2016. 2 car garage with off street parking. Owner pays water, sewer, gas and trash. Being sold as a package only with 230 Lawrence mls # 20221254 and 1233 W. Monroe St. mls # 20221259
-
2019-08-02soldstatus $63,000 344-char remark
Show marketing remark (344 chars)
Check out this excellent investment property! Very close to downtown Sandusky. This is a turn key duplex with both units currently rented. The home has has been very well maintained and features a large floored attic, new boiler in 2016. New kitchens in 2016, fresh paint in 2016. 2 car garage and lots of off street parking. Owner pays gas.
-
2019-06-18$69,900 344-char remark
Show marketing remark (344 chars)
Check out this excellent investment property! Very close to downtown Sandusky. This is a turn key duplex with both units currently rented. The home has has been very well maintained and features a large floored attic, new boiler in 2016. New kitchens in 2016, fresh paint in 2016. 2 car garage and lots of off street parking. Owner pays gas.
ⓘ Source: listings_history table (triggers on properties + properties_extension) + one-shot
backfill from property_details.listing_events for pre-trigger history.
Tax reassessment forecast OH · Partial reset (capped growth)
- Current annual tax
- $1,502 · $125/mo
- Projected year-2 tax
- $2,154 · $180/mo
- Expected delta
- +$652/yr (+$54/mo · 43.4%)
ⓘ Screening estimate from a state-policy table — verify with the county assessor before closing.
Climate risk First Street
- Flood 1/10 Low FEMA zone X (unshaded) · 0% chance over 30 yrs
- Wildfire 1/10 Low
- Heat 3/10 Moderate 7 d/yr ≥94°F today · 16 d/yr by 30 yrs out
- Wind 2/10 Low
- Air quality 3/10 Moderate 2 unhealthy d/yr today · 3 by 30 yrs out
Nearby sold comps map
Loading sold comps map…
Walkable amenities ~0.75 mi
Loading nearby amenities…
Taxation est. · year 1
- Rental income
- $41,364
- − Mortgage interest
- −$10,077
- − Property taxes
- −$1,502
- − Insurance
- −$900
- − Repairs & maintenance
- −$3,309
- − Management
- −$3,309
- − Depreciation
- −$5,233
- Taxable income
- $17,033
- Est. tax owed @ 24.0%
- −$4,088
- After-tax cash flow
- $14,867/yr
For passive investors: Depreciation is non-cash, so a rental often shows a tax loss while cash-flowing — sheltering income. Rental losses are passive: they offset passive income freely, and up to $25,000/yr can offset ordinary (W-2) income if you actively participate and your MAGI is under $100k (phasing out to $0 by $150k); unused losses carry forward. On sale, claimed depreciation is recaptured at up to 25%, and gains may owe capital-gains tax (a 1031 exchange can defer both). Figures are a year-1 estimate at your 24.0% rate — not tax advice; consult a CPA.
Schools (NCES district)
- District
- Sandusky City
- NCES district ID
- 3904474
- Math proficiency
- 24% ▼ -17.00%
- Reading proficiency
- 37% ▼ -9.00%
- Median HH income
- $34,583
- Composite
- 25.1/100
- National rank
- #7532
- State rank
- #583 of 656 in OH
Livability — Sandusky
- Score
- 83/100
- State rank
- #63
- US rank
- #929
Category grades
Schools grade is shown separately in the Schools card above.
Census & demographics
- Census place
- Sandusky, OH
- County
- Erie County · 39,883 people
- City population
- 39,883
- Metro
- Sandusky, OH
- Population (ZIP)
- 39,883
- Household income
- $62,082
- Rent vs Own
- Severe rent burden
- 1602.0
Population outlook (Erie County) Hauer SSP2
- Today (2025)
- 73,204 people
- By 2030
- 71,341 · -2.5%
- By 2040
- 66,771 · -8.8%
- By 2050
- 62,512 · -14.6%
- By 2075
- 56,154 · -23.3%
- By 2100
- 49,045 · -33.0%
Race, ethnicity, and origin ACS 2023
- Neighborhood character
- Predominantly White (72%)
- Race & ethnicity
- White 72% Black 15% Two or more races 8% Hispanic / Latino 5%
- Common ancestry
- Romanian 3% Slovak 2% Subsaharan African 1%
- Foreign-born
- 1% · Canada
- Languages at home
- 96% English-only · Spanish 2%
Political lean MEDSL · Erie
- 2024 margin
- R (+14.1) · D 42.5% · R 56.6%
- 2008→2024 swing
- -28.0pp toward R · 2008: 13.9pp · 2024: -14.1pp
- All cycles
- 2024: R+14.1 2020: R+11.6 2016: R+9.8 2012: D+11.3 2008: D+13.9
Not yet ingested
- Civics
- —
Market trends
- HPI YoY
- ▼ -151.99%
- Current HPI
- 209.6383
- Rent YoY
- —
- Metro
- Sandusky, OH
- State GDP YoY
- ▲ 1.98%
- F500 in state
- 48
Industry mix (Fortune 500 HQ in OH)
| Industry | F500 HQs | Revenue |
|---|---|---|
| Insurance | 3 | $145B |
|
||
| Industrial Machinery | 3 | $49B |
|
||
| Financial Services | 3 | $24B |
|
||
| Consumer Goods | 2 | $93B |
|
||
| Aerospace / Defense | 2 | $47B |
|
||
| Utilities | 2 | $33B |
|
||
Price history
+157.4% since first listed5 events — show timeline
- 2026-05-18 Listed $179,900 FAOR
- 2022-06-23 Sold (MLS) $75,000 FAOR
- 2022-04-18 Listed $82,500 FAOR
- 2019-08-02 Sold (MLS) $63,000 FAOR
- 2019-06-18 Listed $69,900 FAOR
Property tax history
+4.8%/yrLatest (2025): $1,502 · -1.0% YoY. Source: county tax records.
Cash-flow waterfall
monthlySold comps — $/sqft
last 12 mo · ≤1 miLoading sold comps…