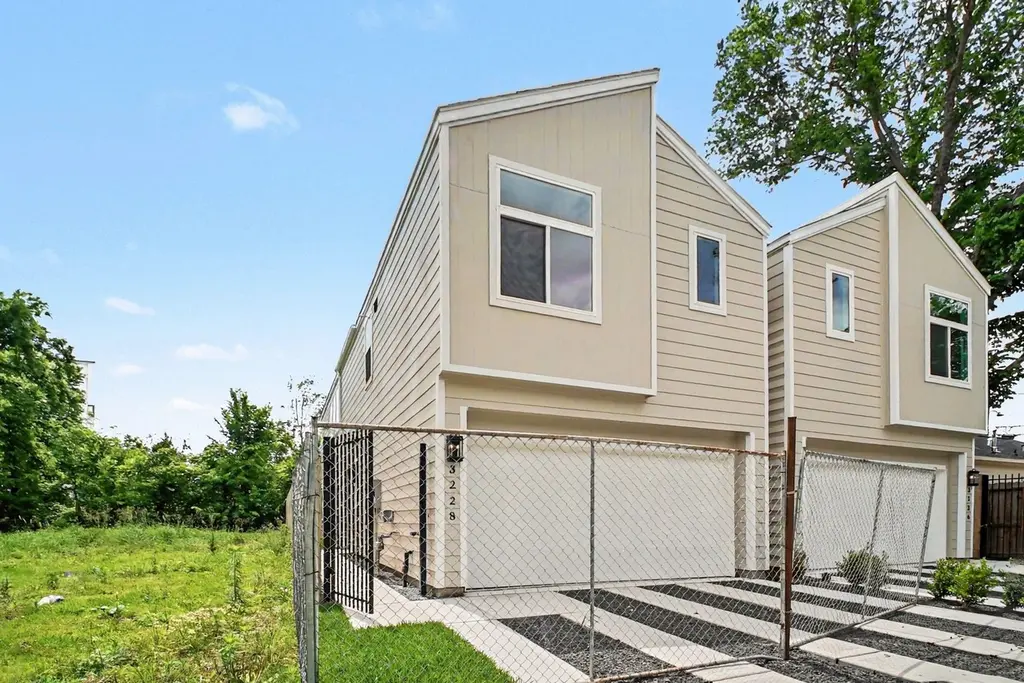
3228 Drew St · Houston, TX
Flood risk No data
- FEMA flood zone
- —
- Chance of flooding over 30 yrs
- —
- Est. flood insurance / yr
- —
Fire risk No data
- Est. fire insurance / yr
- —
Heat risk No data
- Hot days now (above threshold)
- —
- Hot days in 30 yrs
- —
Wind risk No data
- Chance of severe wind over 30 yrs
- —
Air-quality risk No data
- Unhealthy air days now
- —
- Unhealthy air days in 30 yrs
- —
Risk factors via First Street. Map © Google.
Why this score? — see what drove the C+ grade
The composite is a weighted blend of 9 inputs, each scored 0–100. Each bar is that input's sub-score; the figure is the points it added to the 100-point composite (weight × sub-score).
- Cash flow +22.0/30.0
- ARV discount +15.0/15.0
- DSCR +7.0/10.0
- 1% rule +5.0/10.0
- Livability +3.7/5.0
- Schools +2.7/10.0
- Condition / age +2.5/5.0
- Rent growth +2.4/5.0
- Appreciation +0.0/10.0
$299,900
🖨 Deal sheet (PDF) 📄 Offer letter ✓ Due diligence
Listing remarks MLS
Experience modern city living in this newly built 3-bedroom, 3.5-bath home in the rapidly developing Historic Third Ward. Featuring a highly desirable first-floor living area, this superior layout stands out. Enjoy high-standard finishes and the convenience of no shared bathrooms. Unbeatably located just minutes from Downtown, EaDo, and the University of Houston. Schedule your tour today!
Key facts
- Historic third ward
- No shared bathrooms
- 2,596 sq ft lot
Tags
Neighborhood map
What this means for you Summary
Snapshot
- This is a 3-bed/3.5-bath land listed at $300k.
Deal economics
- At list price, monthly cash flow is $476 ($6k/yr) — positive.
- The deal already cash-flows at list — no discount required.
- To meet the 1% rule (rent ≥ 1% of price), the offer needs to be $299k (0.3% below list).
- Recommended offer: $282k (6.0% below list) — sets the bar for market timing.
- Cap rate 8.2% vs local median 3.2% in Houston — top-decile yield for the area; either an underpriced asset or a hidden risk that comps aren't pricing in. Stress-test before assuming the spread holds.
Location & tenants
- Location reads 74/100 on livability (#184 in TX, #4,771 nationally) — a middle-class / working-renter tenant base. Strengths: amenities A+, cost of living A+, housing A+; Watch: crime F.
- Houston ISD (urban): math 27% / reading 35% proficiency, ranked #593 of 826 in TX (top 72%) — families likely to look elsewhere, expect single-tenant / working-renter base with shorter leases; 71% free/reduced lunch — lower-income household profile, screen leases tightly.
- Zoned schools: Blackshear El (math 27% / reading 32%, grade F, #2,525 of 4,322 statewide, top 62%, 308 students, 99% FRL); Cullen Middle (math 6% / reading 14%, grade F, #1,641 of 1,662 statewide, top 99%, 324 students, 100% FRL); Yates H S (math 12% / reading 23%, grade F, #1,451 of 1,632 statewide, top 89%, 851 students, 96% FRL) — zoned schools average 98% FRL vs 71% district-wide (27 pts higher); higher-poverty schools than district average — tighter screening recommended.
- Zoned-school proficiency averages 19% at this address vs 31% district-wide (-12 pts) — the specific schools serving this property underperform the Houston ISD average; the district grade overstates school quality for this exact location.
- Market conditions: Rents soft (-0.3%/yr); 585 active listings in the ZIP; 39 comparable units currently listed for rent nearby; rentals at typical pace (median 26d on market — plan ~3-4 weeks tenant-placement turnaround); 41% of comp listings sitting > 30 days — soft ceiling on asking rent; 29,883 units permitted in Harris County in 2024 (8,621 in 5+ unit buildings).
- At $2,989/mo this rent would consume 50% of the median local household income ($71k/yr) (locally 3072% of renters already pay >50% of income on rent) — very limited rent-growth headroom before tenants either downsize or default.
Forward outlook
- Local home prices are declining (-3.0%/yr); year-one equity from $2k of loan paydown is wiped out by about $9k of value loss. Plan a longer hold.
- Harris County population projected at +47% by 2050 — long-run rental-demand tailwind backs the buy-and-hold thesis.
Negotiation context
- It's been on market 68 days — a 6% lower offer ($282k) is reasonable based on typical stale-listing flexibility.
Questions for the listing agent
- It's been on market 68 days. Have you received any prior offers? Is the seller open to a 6% concession, seller financing, or rate buy-down credit?
- Why hasn't it sold? Are there any deal-killer items the seller is aware of (foundation, flood, title, zoning, code violations)?
- Is there a deadline driving the sale (1031 exchange, divorce, estate, relocation)? That informs how much negotiation room exists.
- Schools are D-rated, which usually means shorter tenancies and higher turnover. Who's the typical renter profile here, and what's been the actual vacancy rate?
- Crime grade is F in this area — have there been break-ins, vandalism, or insurance claims at this property in the last 3 years? What carrier currently insures it and at what premium?
- What's the average days-on-market for RENTAL listings here right now (not sales)? A rising rental-DOM trend means longer vacancies and softer asking-rent achievability than the comps imply.
- What's the recent tenant-quality profile in this submarket — average credit score on applications, eviction rate, late-payment / NSF rate, and stable-employment percentage? A property-management company in the area should have these aggregated.
- How much new for-sale + rental construction is in the pipeline within 1–3 miles? Heavy new supply typically softens prices + rents 12–24 months out; constrained supply supports both.
Investment metrics
- 1% rule
- 1.00% ✗
- Cap rate
- 8.20%
- Cash-on-cash
- 6.80%
- DSCR
- 1.30
- GRM
- 8.4
CMA / ARV
- ARV (median comp)
- $387,837
- List price
- $299,900
- Delta
- -22.67%
- Verdict
- UNDERPRICED
- Comps
- 20 within 1.0 mi
Projected returns pro-forma
-3.0% appreciation · 0.0% rent growth · sell at horizon
- IRR
- -9.1%
- Equity multiple
- 0.68×
- Total profit
- $-27,139
- Equity at exit
- $44,716
- IRR
- -3.9%
- Equity multiple
- 0.78×
- Total profit
- $-18,767
- Equity at exit
- $25,930
Cash invested: $83,972 (down + closing). Projections, not guarantees.
Landlord ↔ Tenant lean methodology
- Overall (STATE)
- 87 Strongly Landlord-Friendly
- State Texas
- 87 Strongly Landlord-Friendly · R+5
- County
- — inherits STATE
- City
- — inherits STATE
ZIP-level market 77004
- Rents YoY
- -0.3%
- Active inventory
- 585
- Price-to-rent
- 8.4×
Monthly cashflow live
- Estimated rent
- $2,989 high interval (Pro) →
- Mortgage (P&I)
- −$1,573
- Tax from tax record
- −$188 /mo · $2,256/yr
- Insurance
- −$125
- HOA
- −$0
- Vacancy / Maint / Mgmt
- −$628
- Net cashflow
- $476
Break-even live
Sensitivity live
| Price | -10% $645 | -5% $560 | +0% $476 | +5% $391 | +10% $306 |
|---|---|---|---|---|---|
| Rent | -10% $239 | -5% $357 | +0% $476 | +5% $594 | +10% $712 |
| Rate | -1.0pp $627 | -0.5pp $552 | base $476 | +0.5pp $398 | +1.0pp $319 |
UW: 25.0% down · 7.5% · 30yr · 1.5% tax · 5.0% vac · 8.0% maint · 8.0% mgmt
Financing live
Cash to close
- Down payment
- $74,975
- Closing costs
- $8,997
- Reserves months
- —
- Total cash needed
- —
Loan-product check · same deal, 3 products live
Conventional
25% down · 7.5% · 30yr
- Down + closing
- —
- Monthly P&I
- —
- Monthly cashflow
- —
- DSCR
- —
- Eligible?
- —
Personal DTI + credit; lowest rate.
DSCR
20% down · 8.5% · 30yr
- Down + closing
- —
- Monthly P&I
- —
- Monthly cashflow
- —
- DSCR
- —
- Eligible?
- —
No personal income docs; deal must DSCR.
Hard money
10% down · 12.0% · 12mo
- Down + closing
- —
- Monthly P&I
- —
- Monthly cashflow
- —
- DSCR
- —
- Eligible?
- —
Short-term bridge; refi at stabilization.
Rent comps 39 comps
| Address | Beds | Baths | Sqft | Rent | $/sqft | DOM | Units | Dist |
|---|---|---|---|---|---|---|---|---|
| 3335 Tuam St Houston, TX | 2.0 | 1.0 | 2300 | $995 | $0.43 | 45d | 1 | 0.11mi |
| 3518 Dennis St Unit 1387517P Houston, TX | 4.0 | 4.0 | 2271 | $5,657 | $2.49 | 0d | 1 | 0.36mi |
| 3034 Gray St Houston, TX | 3.0 | 3.0 | 2081 | $3,000 | $1.44 | 45d | 1 | 0.40mi |
| 3517 McIlhenny St Houston, TX | 3.0 | 3.5 | 2000 | $3,200 | $1.60 | 5d | 1 | 0.42mi |
| 3229 Holman St Houston, TX | 4.0 | 4.0 | 1632 | $1,200 | $0.74 | 45d | 1 | 0.44mi |
| 3719 Elgin St Houston, TX | 1.0–5.0 | 1.0–5.0 | 1241 | $1,374 | $1.11 | 26d | 14 | 0.51mi |
| 3507 Canfield St Houston, TX | 3.0 | 2.5 | 2200 | $2,350 | $1.07 | 26d | 1 | 0.54mi |
| 3131 Leeland St Houston, TX | 3.0 | 3.5 | 1966 | $2,850 | $1.45 | 26d | 1 | 0.67mi |
| 3015 Isabella St Houston, TX | 3.0 | 1.0 | 1452 | $1,399 | $0.96 | 1d | 1 | 0.72mi |
| 2105 McGowen St Unit 1244936P Houston, TX | 3.0 | 3.5 | 2497 | $4,371 | $1.75 | 0d | 1 | 0.75mi |
| 2109 McGowen St Unit 1244934P Houston, TX | 3.0 | 3.5 | 2497 | $4,245 | $1.70 | 0d | 1 | 0.76mi |
| 2107 McGowen St Unit 1244935P Houston, TX | 3.0 | 3.5 | 2497 | $4,711 | $1.89 | 4d | 1 | 0.76mi |
| 2103 McGowen St Unit 1244937P Houston, TX | 3.0 | 3.5 | 2292 | $4,732 | $2.06 | 0d | 1 | 0.76mi |
| 2519 Saint Emanuel St Unit 1241246P Houston, TX | 3.0 | 3.0 | 2389 | $2,621 | $1.10 | 0d | 1 | 0.77mi |
| 2521 Saint Emanuel St Unit 1047945P Houston, TX | 3.0 | 3.0 | 2292 | $2,727 | $1.19 | 0d | 1 | 0.77mi |
| 2326 St Emanuel St Houston, TX | 3.0 | 3.5 | 2642 | $2,601 | $0.98 | 9d | 1 | 0.81mi |
| 3213 Saint Emanuel St Houston, TX | 4.0 | 3.5 | 2100 | $3,300 | $1.57 | 18d | 1 | 0.84mi |
| 3405 St Emanuel St Houston, TX | 4.0 | 5.0 | 2388 | $2,900 | $1.21 | 45d | 1 | 0.88mi |
| 2209 Alabama St Unit B Houston, TX | 3.0 | 2.5 | 2074 | $2,350 | $1.13 | 45d | 1 | 0.91mi |
| 4306 Ennis St Houston, TX | 3.0 | 3.0 | 1989 | $2,500 | $1.26 | 45d | 1 | 0.92mi |
| 3226 McKinney St Houston, TX | 3.0 | 3.0 | 2274 | $2,500 | $1.10 | 45d | 1 | 0.96mi |
| 2401 Eagle St Houston, TX | 4.0 | 4.0 | 1700 | $2,800 | $1.65 | 45d | 1 | 1.00mi |
| 2216 Chenevert St Houston, TX | 1.0–2.0 | 1.5–2.5 | 1380 | $2,800 | $2.03 | 26d | 3 | 1.01mi |
| 2357 Jackson St Houston, TX | 3.0 | 2.5 | 1908 | $2,500 | $1.31 | 23d | 1 | 1.03mi |
| 2311 Eagle St Houston, TX | 3.0 | 4.0 | 1783 | $2,500 | $1.40 | 45d | 1 | 1.03mi |
| 4001 Dallas St Unit 1029264P Houston, TX | 3.0 | 3.0 | 2174 | $5,220 | $2.40 | 0d | 1 | 1.05mi |
| 2809 Crawford St Houston, TX | 2.0 | 2.0 | 1928 | $2,600 | $1.35 | 45d | 1 | 1.09mi |
| 3535 Wentworth St Houston, TX | 4.0 | 3.0 | 2600 | $2,650 | $1.02 | 23d | 1 | 1.11mi |
| 2816 Rusk St Houston, TX | 3.0 | 3.5 | 2107 | $2,800 | $1.33 | 45d | 1 | 1.14mi |
| 2703 Blodgett St Unit 1047952P Houston, TX | 1.0–5.0 | 1.5–5.5 | 2497 | $12,804 | $5.13 | 0d | 2 | 1.14mi |
| 1915 Cleburne St Houston, TX | 2.0 | 1.0 | 2766 | $1,800 | $0.65 | 45d | 1 | 1.16mi |
| 2416 La Branch St Houston, TX | 3.0 | 4.0 | 2540 | $2,900 | $1.14 | 45d | 1 | 1.18mi |
| 2504 Rusk St Unit 1563174P Houston, TX | 2.0 | 2.0 | 1819 | $4,036 | $2.22 | 4d | 1 | 1.21mi |
| 2721 Austin St Houston, TX | 3.0 | 4.0 | 2607 | $3,000 | $1.15 | 26d | 1 | 1.21mi |
| 1310 Anita St Houston, TX | 2.0 | 2.0 | 1760 | $2,695 | $1.53 | 45d | 1 | 1.28mi |
| 2403 Arbor St Houston, TX | 3.0 | 2.5 | 2344 | $2,800 | $1.19 | 45d | 1 | 1.32mi |
| 1515 Austin St Houston, TX | 1.0–2.0 | 1.0–2.5 | 1120 | $3,679 | $3.28 | 0d | 16 | 1.36mi |
| 2856 Fannin St Houston, TX | 2.0 | 2.0 | 1490 | $3,400 | $2.28 | 45d | 1 | 1.43mi |
| 2850 Fannin St Houston, TX | 1.0–2.0 | 1.0–2.0 | 1138 | $3,350 | $2.94 | 1d | 23 | 1.46mi |
Listing history 14 events
-
2026-06-21days on market $299,900 Active 68 DOM
-
2026-06-18days on market $299,900 Active 65 DOM
-
2026-06-17days on market $299,900 Active 64 DOM
-
2026-06-16days on market $299,900 Active 63 DOM
-
2026-06-15days on market $299,900 Active 62 DOM
-
2026-06-13days on market $299,900 Active 60 DOM
-
2026-06-10days on market $299,900 Active 56 DOM
-
2026-06-08days on market $299,900 Active 55 DOM
-
2026-06-07days on market $299,900 Active 54 DOM
-
2026-06-04days on market $299,900 Active 51 DOM
-
2026-06-01days on market $299,900 Active 48 DOM
-
2026-05-31days on market $299,900 Active 47 DOM
-
2026-05-07price $299,900 391-char remark
Show marketing remark (391 chars)
Experience modern city living in this newly built 3-bedroom, 3.5-bath home in the rapidly developing Historic Third Ward. Featuring a highly desirable first-floor living area, this superior layout stands out. Enjoy high-standard finishes and the convenience of no shared bathrooms. Unbeatably located just minutes from Downtown, EaDo, and the University of Houston. Schedule your tour today!
-
2026-04-14$334,900 Active 391-char remark
Show marketing remark (391 chars)
Experience modern city living in this newly built 3-bedroom, 3.5-bath home in the rapidly developing Historic Third Ward. Featuring a highly desirable first-floor living area, this superior layout stands out. Enjoy high-standard finishes and the convenience of no shared bathrooms. Unbeatably located just minutes from Downtown, EaDo, and the University of Houston. Schedule your tour today!
ⓘ Source: listings_history table (triggers on properties + properties_extension) + one-shot
backfill from property_details.listing_events for pre-trigger history.
Tax reassessment forecast TX · Resets to sale price
- Current annual tax
- $2,256 · $188/mo
- Projected year-2 tax
- $5,488 · $457/mo
- Expected delta
- +$3,232/yr (+$269/mo · 143.3%)
ⓘ Screening estimate from a state-policy table — verify with the county assessor before closing.
Nearby sold comps map
Loading sold comps map…
Walkable amenities ~0.75 mi
Loading nearby amenities…
Taxation est. · year 1
- Rental income
- $35,866
- − Mortgage interest
- −$16,799
- − Property taxes
- −$2,256
- − Insurance
- −$1,500
- − Repairs & maintenance
- −$2,869
- − Management
- −$2,869
- − Depreciation
- −$8,724
- Taxable income
- $849
- Est. tax owed @ 24.0%
- −$204
- After-tax cash flow
- $5,503/yr
For passive investors: Depreciation is non-cash, so a rental often shows a tax loss while cash-flowing — sheltering income. Rental losses are passive: they offset passive income freely, and up to $25,000/yr can offset ordinary (W-2) income if you actively participate and your MAGI is under $100k (phasing out to $0 by $150k); unused losses carry forward. On sale, claimed depreciation is recaptured at up to 25%, and gains may owe capital-gains tax (a 1031 exchange can defer both). Figures are a year-1 estimate at your 24.0% rate — not tax advice; consult a CPA.
Schools (NCES district)
- District
- Houston ISD
- NCES district ID
- 4823640
- Math proficiency
- 27% ▼ -18.00%
- Reading proficiency
- 35% ▼ -6.00%
- Median HH income
- $46,054
- Composite
- 26.63/100
- National rank
- #7173
- State rank
- #593 of 826 in TX
Livability — Houston
- Score
- 74/100
- State rank
- #184
- US rank
- #4771
Category grades
Schools grade is shown separately in the Schools card above.
Census & demographics
- Census place
- Houston, TX
- County
- Harris County · 4,702,590 people
- City population
- 3,226,434
- Metro
- Houston-The Woodlands-Sugar Land, TX
- Population (ZIP)
- 35,997
- Household income
- $71,199
- Rent vs Own
- Severe rent burden
- 3072.0
Population outlook (Harris County) Hauer SSP2
- Today (2025)
- 5,571,493 people
- By 2030
- 6,089,821 · +9.3%
- By 2040
- 7,142,806 · +28.2%
- By 2050
- 8,185,864 · +46.9%
- By 2075
- 10,574,329 · +89.8%
- By 2100
- 12,109,958 · +117.4%
Race, ethnicity, and origin ACS 2023
- Neighborhood character
- Diverse neighborhood (Simpson 0.68)
- Race & ethnicity
- Black 48% White 27% Hispanic / Latino 13% Two or more races 11% Asian 8%
- Hispanic origin (detail)
- Mexican 9%
- Common ancestry
- Lithuanian 1% Romanian 1% Italian 1%
- Foreign-born
- 14% · Canada, China, South Korea
- Languages at home
- 82% English-only · Spanish 10% Chinese 2% Other Indo-European 2%
Political lean MEDSL · Harris
- 2024 margin
- Lean D (+5.5) · D 52.0% · R 46.4% · Other 1.6%
- 2008→2024 swing
- +3.9pp toward D · 2008: 1.6pp · 2024: 5.5pp
- All cycles
- 2024: D+5.5 2020: D+13.3 2016: D+12.4 2012: D+0.1 2008: D+1.6
Not yet ingested
- Civics
- —
Market trends
- HPI YoY
- ▼ -139.34%
- Current HPI
- 199.6066
- Rent YoY
- ▼ -0.32%
- Metro
- Houston-The Woodlands-Sugar Land, TX
- State GDP YoY
- ▲ 3.95%
- F500 in state
- 110
Industry mix (Fortune 500 HQ in TX)
| Industry | F500 HQs | Revenue |
|---|---|---|
| Energy | 16 | $1,198B |
|
||
| Technology | 5 | $198B |
|
||
| Engineering / Construction | 4 | $72B |
|
||
| Energy Services | 3 | $60B |
|
||
| Utilities | 3 | $41B |
|
||
| Healthcare | 2 | $330B |
|
||
Price history
-10.5% since first listed2 events — show timeline
- 2026-05-07 Price Changed $299,900 HARMLS
- 2026-04-14 Listed $334,900 HARMLS
Cash-flow waterfall
monthlySold comps — $/sqft
last 12 mo · ≤1 miLoading sold comps…