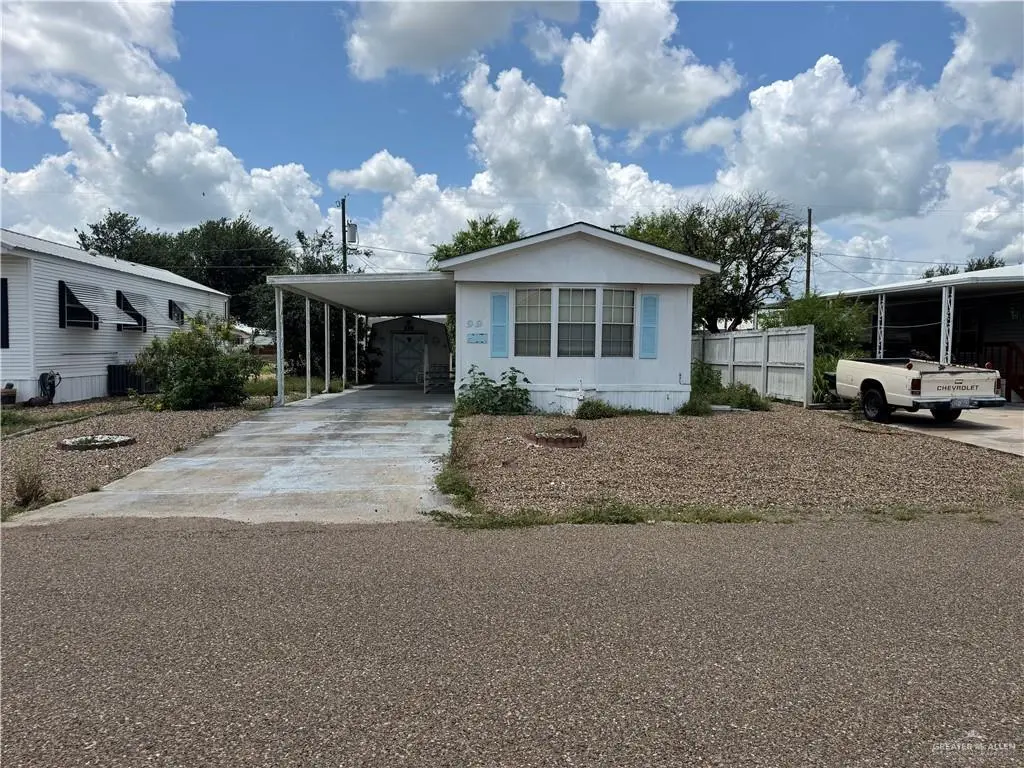
99 Lampshire Ave · Palmview, TX
Flood risk 1/10 · Minimal
- FEMA flood zone
- X
- Chance of flooding over 30 yrs
- 0.0%
- Est. flood insurance / yr
- $507 – $1,088
Fire risk 8/10 · Major
- Est. fire insurance / yr
- $1,222 – $2,270
Heat risk 9/10 · Severe
- Hot days now (above 112°F)
- 7 days/yr
- Hot days in 30 yrs
- 21 days/yr
Wind risk 8/10 · Major
- Chance of severe wind over 30 yrs
- 93.0%
Air-quality risk 1/10 · Minimal
- Unhealthy air days now
- 0 days/yr
- Unhealthy air days in 30 yrs
- 0 days/yr
Risk factors via First Street. Map © Google.
Why this score? — see what drove the B grade
The composite is a weighted blend of 9 inputs, each scored 0–100. Each bar is that input's sub-score; the figure is the points it added to the 100-point composite (weight × sub-score).
- Cash flow +30.0/30.0
- ARV discount +15.0/15.0
- 1% rule +10.0/10.0
- DSCR +10.0/10.0
- Livability +2.9/5.0
- Rent growth +2.7/5.0
- Condition / age +2.5/5.0
- Schools +1.9/10.0
- Appreciation +0.0/10.0
$45,000
🖨 Deal sheet (PDF) 📄 Offer letter ✓ Due diligence
Listing remarks
Located in the Peaceful Lamplight Mobile Home Community, a 55+ community, this fully furnished 2-bedroom, 2-bathroom home offers an affordable opportunity for year-round living, a winter retreat, or a low-maintenance lifestyle in the Rio Grande Valley. Enjoy peaceful community living with a spacious layout featuring carpet and tile flooring throughout, water and electricity connected, and all appliances included. Additional features include covered parking, an on-site storage unit, and an outdoor space perfect for relaxing and enjoying South Texas mornings and evenings. The property does need some TLC and updating, providing an excellent opportunity to add your personal touch while maintain
Key facts
- Move-in ready
- Covered parking
- On-site storage unit
Tags
Property features AI
Finance
- Financial info: Escrow $450
- HOA & community: Association: Lamplight Mobile Home; Association fee $325 annually; POA mandatory with $125 transfer fee; Community pool; Senior community
Exterior
- Parking: Covered parking (1 space); Carport (1 space); No garage
- Utilities: Public water; City sewer and MUD; Cable available
- Home design: Own lot; Mobile home lot (Lamplight Mobile Home Lot 99 Blk 2)
- Construction: HardiPlank-type exterior; Crawl space foundation with pillar/post/pier
- Exterior features: Composition shingle roof; Paved road access; Storage structure on site
Interior
- Kitchen: Smooth electric cooktop; Single oven; Refrigerator
- Bedrooms: Master bedroom with walk-in closet(s)
- Flooring: Carpet; Laminate; Vinyl
- Bathrooms: 2 full bathrooms
- Heating & cooling: Central heating (electric); Central air conditioning (electric)
- Interior features: Laminate countertops; Ceiling fans; Split bedroom layout; Walk-in closet(s); Mini blinds
- Laundry & utility: Laundry area with washer/dryer connection; Electric water heater
Neighborhood map
What this means for you Summary
Snapshot
- This is a 3-bed/2.0-bath manufactured listed at $45k.
Deal economics
- At list price, monthly cash flow is $969 ($12k/yr) — positive.
- The deal already cash-flows at list — no discount required.
- Meets the 1% rule at list price ($2k rent vs $45k).
- Cap rate 32.1% vs local median 4.2% in Palmview — top-decile yield for the area; either an underpriced asset or a hidden risk that comps aren't pricing in. Stress-test before assuming the spread holds.
Location & tenants
- Location reads 57/100 on livability (#1,267 in TX) — a working-class tenant base; expect higher turnover. Strengths: cost of living A+, housing A; Watch: crime D, amenities F, commute F.
- La Joya ISD (suburban): math 18% / reading 29% proficiency, ranked #759 of 826 in TX (top 92%) — low school quality limits family demand, transient renter base, plan for 1-2y turnover.
- Zoned schools: Leo J Leo El (math 27% / reading 32%, grade F, #2,525 of 4,322 statewide, top 62%, 372 students, 92% FRL); Cesar Chavez Middle (math 25% / reading 35%, grade F, #1,056 of 1,662 statewide, top 65%, 666 students, 90% FRL); La Joya H S (math 16% / reading 32%, grade F, #1,333 of 1,632 statewide, top 82%, 2,775 students, 92% FRL) — zoned schools average 91% FRL vs 54% district-wide (38 pts higher); higher-poverty schools than district average — tighter screening recommended.
- Market conditions: Rents flat; 852 active listings in the ZIP; 3 comparable units currently listed for rent nearby; rentals lingering (median 45d on market — plan ~5-8 weeks vacancy on turnover, expect pricing pressure); 67% of comp listings sitting > 30 days — soft ceiling on asking rent; 7,378 units permitted in Hidalgo County in 2024 (641 in 5+ unit buildings).
- This rent runs 38% of the median local income ($54k/yr) — at the standard rent-burdened threshold; future hikes will face affordability resistance.
Forward outlook
- Local home prices are declining (-3.0%/yr); year-one equity from $311 of loan paydown is wiped out by about $1k of value loss. Plan a longer hold.
- Hidalgo County population projected at +28% by 2050 — long-run rental-demand tailwind backs the buy-and-hold thesis.
- At projected returns (-3.0% appreciation + 0.9% rent growth), your $13k cash investment doubles in ~2 years — after that, you're playing with house money.
Negotiation context
- Only 14 days on market — expect competitive offers; lowballing is unlikely to land.
Risks & watch-outs
- Watch-outs: property tax is 3.2% of price.
- Climate carrying-cost: severe wind risk, 93% chance of damaging wind over 30y; severe wildfire risk; extreme-heat days projected 7→21/yr by 2055 (HVAC capex compounding) — expect insurance premiums to compound above CPI over the hold.
Questions for the listing agent
- Property tax is high relative to price — has the assessment been appealed recently, and will the sale trigger a re-assessment?
- What does the HOA fee cover, when was the last increase, and are there any pending special assessments or reserve-fund shortfalls?
- Is there a deadline driving the sale (1031 exchange, divorce, estate, relocation)? That informs how much negotiation room exists.
- Schools are F-rated, which usually means shorter tenancies and higher turnover. Who's the typical renter profile here, and what's been the actual vacancy rate?
- Crime grade is D in this area — have there been break-ins, vandalism, or insurance claims at this property in the last 3 years? What carrier currently insures it and at what premium?
- What's the average days-on-market for RENTAL listings here right now (not sales)? A rising rental-DOM trend means longer vacancies and softer asking-rent achievability than the comps imply.
- What's the recent tenant-quality profile in this submarket — average credit score on applications, eviction rate, late-payment / NSF rate, and stable-employment percentage? A property-management company in the area should have these aggregated.
- How much new for-sale + rental construction is in the pipeline within 1–3 miles? Heavy new supply typically softens prices + rents 12–24 months out; constrained supply supports both.
Investment metrics
- 1% rule
- 3.86% ✓
- Cap rate
- 32.13%
- Cash-on-cash
- 92.27%
- DSCR
- 5.11
- GRM
- 2.2
CMA / ARV
- ARV (on-the-fly)
- $55,968
- Comps found
- 1
Show comp detail 1 sale within ~0.75 mi
| Address | Dist | Beds/Ba | Sqft | Sold | Price | $/sf | Match |
|---|---|---|---|---|---|---|---|
| 103 Lampshire Ln | 0.03mi | 2/2.0 (-1) | 938 (-11%) | 2mo | $49,900 | $53 | 73 |
Match score weights: distance 35% · size 25% · config 20% · recency 20%. Top-matched comps best support the ARV.
Projected returns pro-forma
-3.0% appreciation · 0.93% rent growth · sell at horizon
- IRR
- 90.6%
- Equity multiple
- 5.04×
- Total profit
- $50,955
- Equity at exit
- $6,710
- IRR
- 93.0%
- Equity multiple
- 9.75×
- Total profit
- $110,222
- Equity at exit
- $3,891
Cash invested: $12,600 (down + closing). Projections, not guarantees.
Landlord ↔ Tenant lean methodology
- Overall (STATE)
- 87 Strongly Landlord-Friendly
- State Texas
- 87 Strongly Landlord-Friendly · R+5
- County
- — inherits STATE
- City
- — inherits STATE
ZIP-level market 78572
- Home prices YoY
- -22.9%
- Rents YoY
- 0.9%
- Active inventory
- 852
- Price-to-rent
- 2.2×
Monthly cashflow live
- Estimated rent
- $1,735 medium interval (Pro) →
- Mortgage (P&I)
- −$236
- Tax from tax record
- −$120 /mo · $1,441/yr
- Insurance
- −$19
- HOA
- −$27
- Vacancy / Maint / Mgmt
- −$364
- Net cashflow
- $969
Break-even live
Sensitivity live
| Price | -10% $994 | -5% $982 | +0% $969 | +5% $956 | +10% $943 |
|---|---|---|---|---|---|
| Rent | -10% $832 | -5% $900 | +0% $969 | +5% $1,037 | +10% $1,106 |
| Rate | -1.0pp $991 | -0.5pp $980 | base $969 | +0.5pp $957 | +1.0pp $945 |
UW: 25.0% down · 7.5% · 30yr · 1.5% tax · 5.0% vac · 8.0% maint · 8.0% mgmt
Financing live
Cash to close
- Down payment
- $11,250
- Closing costs
- $1,350
- Reserves months
- —
- Total cash needed
- —
Loan-product check · same deal, 3 products live
Conventional
25% down · 7.5% · 30yr
- Down + closing
- —
- Monthly P&I
- —
- Monthly cashflow
- —
- DSCR
- —
- Eligible?
- —
Personal DTI + credit; lowest rate.
DSCR
20% down · 8.5% · 30yr
- Down + closing
- —
- Monthly P&I
- —
- Monthly cashflow
- —
- DSCR
- —
- Eligible?
- —
No personal income docs; deal must DSCR.
Hard money
10% down · 12.0% · 12mo
- Down + closing
- —
- Monthly P&I
- —
- Monthly cashflow
- —
- DSCR
- —
- Eligible?
- —
Short-term bridge; refi at stabilization.
Rent comps 3 comps
| Address | Beds | Baths | Sqft | Rent | $/sqft | DOM | Units | Dist |
|---|---|---|---|---|---|---|---|---|
| 1905 Tierra Linda Cir W Mission, TX | 3.0 | 2.0 | 1344 | $2,000 | $1.49 | 15d | 1 | 1.30mi |
| 304 S Tecate Dr Mission, TX | 3.0 | 2.0 | 1378 | $1,700 | $1.23 | 44d | 1 | 1.41mi |
| 2306 Ocaso Rd Mission, TX | 4.0 | 2.0 | 1128 | $1,600 | $1.42 | 44d | 1 | 1.48mi |
HOA detail
- Monthly dues
- $27 · $324/yr
- Likely covers
- waterelectric
Listing history 12 events
-
2026-06-18days on market $45,000 Active 14 DOM
-
2026-06-17days on market $45,000 Active 13 DOM
-
2026-06-16days on market $45,000 Active 12 DOM
-
2026-06-15days on market $45,000 Active 11 DOM
-
2026-06-14days on market $45,000 Active 9 DOM
-
2026-06-13days on market $45,000 Active 8 DOM
-
2026-06-10days on market $45,000 Active 6 DOM
-
2026-06-09days on market $45,000 Active 5 DOM
-
2026-06-08days on market $45,000 Active 4 DOM
-
2026-06-07days on market $45,000 Active 3 DOM
-
2026-06-05remarks 699-char remark
-
2026-06-05$45,000 Active 1 DOM
ⓘ Source: listings_history table (triggers on properties + properties_extension) + one-shot
backfill from property_details.listing_events for pre-trigger history.
Tax reassessment forecast TX · Resets to sale price
- Current annual tax
- $1,441 · $120/mo
- Projected year-2 tax
- $1,441 · $120/mo
- Expected delta
- $0/yr ($0/mo · 0.0%)
ⓘ Screening estimate from a state-policy table — verify with the county assessor before closing.
Climate risk First Street
- Flood 1/10 Low FEMA zone X · 0% chance over 30 yrs
- Wildfire 8/10 Severe
- Heat 9/10 Extreme 7 d/yr ≥112°F today · 21 d/yr by 30 yrs out
- Wind 8/10 Severe 93% chance of damaging wind over 30 yrs
- Air quality 1/10 Low 0 unhealthy d/yr today · 0 by 30 yrs out
Nearby sold comps map
Loading sold comps map…
Walkable amenities ~0.75 mi
Loading nearby amenities…
Taxation est. · year 1
- Rental income
- $20,820
- − Mortgage interest
- −$2,521
- − Property taxes
- −$1,441
- − Insurance
- −$225
- − Repairs & maintenance
- −$1,666
- − Management
- −$1,666
- − HOA
- −$324
- − Depreciation
- −$1,309
- Taxable income
- $11,669
- Est. tax owed @ 24.0%
- −$2,801
- After-tax cash flow
- $8,825/yr
For passive investors: Depreciation is non-cash, so a rental often shows a tax loss while cash-flowing — sheltering income. Rental losses are passive: they offset passive income freely, and up to $25,000/yr can offset ordinary (W-2) income if you actively participate and your MAGI is under $100k (phasing out to $0 by $150k); unused losses carry forward. On sale, claimed depreciation is recaptured at up to 25%, and gains may owe capital-gains tax (a 1031 exchange can defer both). Figures are a year-1 estimate at your 24.0% rate — not tax advice; consult a CPA.
Schools (NCES district)
- District
- La Joya ISD
- NCES district ID
- 4826130
- Math proficiency
- 18% ▼ -35.00%
- Reading proficiency
- 29% ▼ -10.00%
- Median HH income
- $27,845
- Composite
- 18.65/100
- National rank
- #8891
- State rank
- #759 of 826 in TX
Livability — Palmview
- Score
- 57/100
- State rank
- #1267
- US rank
- #22043
Category grades
Schools grade is shown separately in the Schools card above.
Census & demographics
- Census place
- Palmview, TX
- County
- Hidalgo County · 623,128 people
- Metro
- McAllen-Edinburg-Mission, TX
- Population (ZIP)
- 78,024
- Household income
- $54,298
- Rent vs Own
- Severe rent burden
- 1714.0
Population outlook (Hidalgo County) Hauer SSP2
- Today (2025)
- 955,232 people
- By 2030
- 1,009,774 · +5.7%
- By 2040
- 1,120,332 · +17.3%
- By 2050
- 1,225,036 · +28.2%
- By 2075
- 1,439,189 · +50.7%
- By 2100
- 1,533,429 · +60.5%
Race, ethnicity, and origin ACS 2023
- Neighborhood character
- Predominantly Hispanic (85%)
- Race & ethnicity
- Hispanic / Latino 85% Two or more races 47% White 12% Asian 2%
- Hispanic origin (detail)
- Mexican 80%
- Common ancestry
- Slovak 1% Portuguese 0%
- Foreign-born
- 28% · Canada, South Korea
- Languages at home
- 22% English-only · Spanish 76%
Political lean MEDSL · Hidalgo
- 2024 margin
- Toss-up / Even · D 48.1% · R 51.0%
- 2008→2024 swing
- -41.6pp toward R · 2008: 38.7pp · 2024: -2.9pp
- All cycles
- 2024: R+2.9 2020: D+17.1 2016: D+40.5 2012: D+41.8 2008: D+38.7
Not yet ingested
- Civics
- —
Market trends
- HPI YoY
- ▼ -62.35%
- Current HPI
- 209.3573
- Rent YoY
- ▲ 0.93%
- Metro
- McAllen-Edinburg-Mission, TX
- State GDP YoY
- ▲ 3.95%
- F500 in state
- 110
Industry mix (Fortune 500 HQ in TX)
| Industry | F500 HQs | Revenue |
|---|---|---|
| Energy | 16 | $1,198B |
|
||
| Technology | 5 | $198B |
|
||
| Engineering / Construction | 4 | $72B |
|
||
| Energy Services | 3 | $60B |
|
||
| Utilities | 3 | $41B |
|
||
| Healthcare | 2 | $330B |
|
||
Price history
1 event — show timeline
- 2026-06-04 Listed $45,000 MCALLENMLS
Property tax history
+8.1%/yrLatest (2025): $1,441 · +18.4% YoY. Source: county tax records.
Cash-flow waterfall
monthlySold comps — $/sqft
last 12 mo · ≤1 miLoading sold comps…