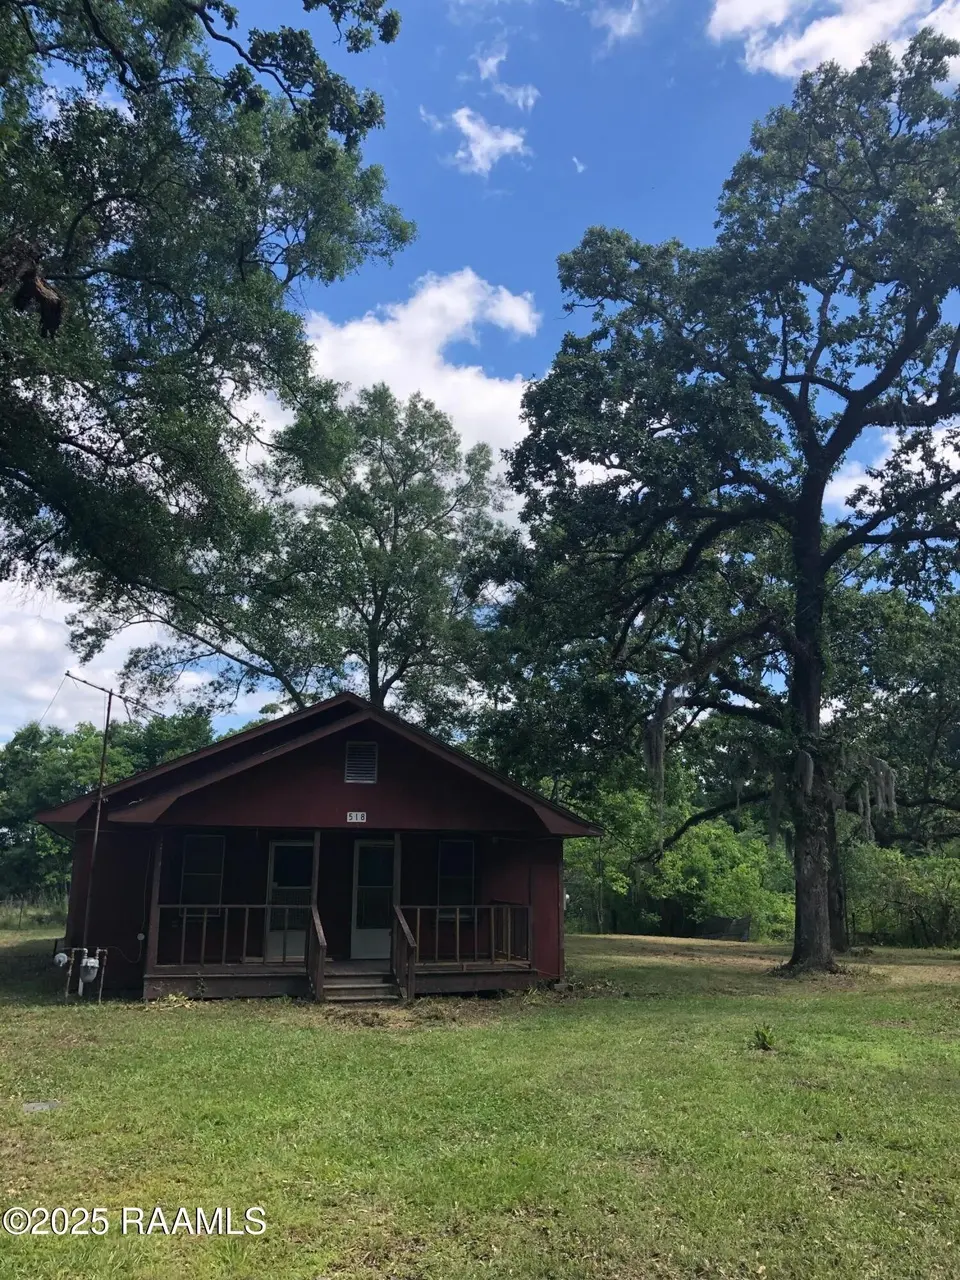
518 Buller Rd · Ville Platte, LA
Flood risk 1/10 · Minimal
- FEMA flood zone
- X (unshaded)
- Chance of flooding over 30 yrs
- 0.0%
- Est. flood insurance / yr
- $507 – $1,088
Fire risk 3/10 · Minor
- Est. fire insurance / yr
- $1,269 – $2,357
Heat risk 8/10 · Major
- Hot days now (above 111°F)
- 7 days/yr
- Hot days in 30 yrs
- 19 days/yr
Wind risk 9/10 · Severe
- Chance of severe wind over 30 yrs
- 99.0%
Air-quality risk 1/10 · Minimal
- Unhealthy air days now
- 0 days/yr
- Unhealthy air days in 30 yrs
- 0 days/yr
Risk factors via First Street. Map © Google.
Why this score? — see what drove the B- grade
The composite is a weighted blend of 9 inputs, each scored 0–100. Each bar is that input's sub-score; the figure is the points it added to the 100-point composite (weight × sub-score).
- Cash flow +30.0/30.0
- 1% rule +10.0/10.0
- DSCR +10.0/10.0
- ARV discount +7.5/15.0
- Livability +2.9/5.0
- Rent growth +2.5/5.0
- Condition / age +2.5/5.0
- Schools +2.4/10.0
- Appreciation +0.0/10.0
$43,430
🖨 Deal sheet (PDF) 📄 Offer letter ✓ Due diligence
Listing remarks MLS
This property is brimming with potential and offers a great opportunity for someone to create their dream home. While the home is in need of some TLC, its classic character and quiet location make it a fantastic project for those with vision. Whether envisioning a complete renovation or a creative rebuild, the canvas is yours to work with.
Key facts
- 1.69 acre lot
- Parking
- Listed 241 days
Neighborhood map
What this means for you Summary
Snapshot
- This is a 3-bed/1.0-bath single-family listed at $43k.
Deal economics
- At list price, monthly cash flow is $626 ($8k/yr) — positive.
- The deal already cash-flows at list — no discount required.
- Meets the 1% rule at list price ($1k rent vs $43k).
- Recommended offer: $38k (12.0% below list) — sets the bar for market timing.
- Cap rate 23.6% vs local median 8.0% in Ville Platte — top-decile yield for the area; either an underpriced asset or a hidden risk that comps aren't pricing in. Stress-test before assuming the spread holds.
Location & tenants
- Location reads 58/100 on livability (#287 in LA) — a working-class tenant base; expect higher turnover. Strengths: cost of living A+, health & safety A+; Watch: housing D+, crime F, amenities F.
- Evangeline Parish (rural): math 23% / reading 36% proficiency, ranked #48 of 98 in LA (top 49%) — low school quality limits family demand, transient renter base, plan for 1-2y turnover; 66% free/reduced lunch — lower-income household profile, screen leases tightly.
- Zoned schools: James Stephens Montessori School (math 32% / reading 42%, grade F, #251 of 646 statewide, top 41%, 442 students, 70% FRL) — zoned schools at 70% FRL track the district average.
- Market conditions: 75 active listings in the ZIP; 28 units permitted in Evangeline Parish in 2024 (0 in 5+ unit buildings).
Forward outlook
- Local home prices are declining (-3.0%/yr); year-one equity from $300 of loan paydown is wiped out by about $1k of value loss. Plan a longer hold.
- Evangeline County population projected at -12% by 2050 — secular population decline; favor cash flow + early exit over multi-decade hold.
- At projected returns (-3.0% appreciation + 3.0% rent growth), your $12k cash investment doubles in ~2 years — after that, you're playing with house money.
Negotiation context
- It's been on market 242 days — a 12% lower offer ($38k) is reasonable based on typical stale-listing flexibility.
- 2 sale attempts with the ask held roughly flat each time — persistent listings suggest the price (not the market) is what's stuck; bring a comps-based counter.
- Current owner paid $30k; 45% above their basis — modest negotiation headroom, anchor on the comps not their cost.
Risks & watch-outs
- Climate carrying-cost: severe wind risk, 99% chance of damaging wind over 30y; extreme-heat days projected 7→19/yr by 2055 (HVAC capex compounding) — expect insurance premiums to compound above CPI over the hold.
Questions for the listing agent
- It's been on market 242 days. Have you received any prior offers? Is the seller open to a 12% concession, seller financing, or rate buy-down credit?
- Why hasn't it sold? Are there any deal-killer items the seller is aware of (foundation, flood, title, zoning, code violations)?
- Is there a deadline driving the sale (1031 exchange, divorce, estate, relocation)? That informs how much negotiation room exists.
- Crime grade is F in this area — have there been break-ins, vandalism, or insurance claims at this property in the last 3 years? What carrier currently insures it and at what premium?
- What's the average days-on-market for RENTAL listings here right now (not sales)? A rising rental-DOM trend means longer vacancies and softer asking-rent achievability than the comps imply.
- What's the recent tenant-quality profile in this submarket — average credit score on applications, eviction rate, late-payment / NSF rate, and stable-employment percentage? A property-management company in the area should have these aggregated.
- How much new for-sale + rental construction is in the pipeline within 1–3 miles? Heavy new supply typically softens prices + rents 12–24 months out; constrained supply supports both.
Investment metrics
- 1% rule
- 2.62% ✓
- Cap rate
- 23.59%
- Cash-on-cash
- 61.77%
- DSCR
- 3.75
- GRM
- 3.2
CMA / ARV
- ARV (median comp)
- $317,998
- List price
- $43,430
- Delta
- -86.34%
- Verdict
- UNDERPRICED
- Comps
- 3 within 1.0 mi
Projected returns pro-forma
-3.0% appreciation · 3.0% rent growth · sell at horizon
- IRR
- 60.7%
- Equity multiple
- 3.70×
- Total profit
- $32,830
- Equity at exit
- $6,476
- IRR
- 65.3%
- Equity multiple
- 7.57×
- Total profit
- $79,925
- Equity at exit
- $3,755
Cash invested: $12,160 (down + closing). Projections, not guarantees.
Landlord ↔ Tenant lean methodology
- Overall (STATE)
- 90 Strongly Landlord-Friendly
- State Louisiana
- 90 Strongly Landlord-Friendly · R+12
- County
- — inherits STATE
- City
- — inherits STATE
ZIP-level market 70586
- Home prices YoY
- -34.2%
- Active inventory
- 75
- Price-to-rent
- 3.2×
Monthly cashflow live
- Estimated rent
- $1,138 medium interval (Pro) →
- Mortgage (P&I)
- −$228
- Tax from tax record
- −$27 /mo · $322/yr
- Insurance
- −$18
- HOA
- −$0
- Vacancy / Maint / Mgmt
- −$239
- Net cashflow
- $626
Break-even live
Sensitivity live
| Price | -10% $651 | -5% $638 | +0% $626 | +5% $614 | +10% $601 |
|---|---|---|---|---|---|
| Rent | -10% $536 | -5% $581 | +0% $626 | +5% $671 | +10% $716 |
| Rate | -1.0pp $648 | -0.5pp $637 | base $626 | +0.5pp $615 | +1.0pp $603 |
UW: 25.0% down · 7.5% · 30yr · 1.5% tax · 5.0% vac · 8.0% maint · 8.0% mgmt
Financing live
Cash to close
- Down payment
- $10,858
- Closing costs
- $1,303
- Reserves months
- —
- Total cash needed
- —
Loan-product check · same deal, 3 products live
Conventional
25% down · 7.5% · 30yr
- Down + closing
- —
- Monthly P&I
- —
- Monthly cashflow
- —
- DSCR
- —
- Eligible?
- —
Personal DTI + credit; lowest rate.
DSCR
20% down · 8.5% · 30yr
- Down + closing
- —
- Monthly P&I
- —
- Monthly cashflow
- —
- DSCR
- —
- Eligible?
- —
No personal income docs; deal must DSCR.
Hard money
10% down · 12.0% · 12mo
- Down + closing
- —
- Monthly P&I
- —
- Monthly cashflow
- —
- DSCR
- —
- Eligible?
- —
Short-term bridge; refi at stabilization.
Listing history 21 events
-
2026-06-22days on market $43,430 Active 242 DOM
-
2026-06-21days on market $43,430 Active 241 DOM
-
2026-06-21days on market $43,430 Active 240 DOM
-
2026-06-18days on market $43,430 Active 238 DOM
-
2026-06-17days on market $43,430 Active 237 DOM
-
2026-06-16days on market $43,430 Active 236 DOM
-
2026-06-15days on market $43,430 Active 235 DOM
-
2026-06-13days on market $43,430 Active 233 DOM
-
2026-06-12days on market $43,430 Active 232 DOM
-
2026-06-09days on market $43,430 Active 229 DOM
-
2026-06-08days on market $43,430 Active 228 DOM
-
2026-06-07days on market $43,430 Active 227 DOM
-
2026-06-07days on market $43,430 Active 226 DOM
-
2026-06-04days on market $43,430 Active 223 DOM
-
2026-06-02days on market $43,430 Active 222 DOM
-
2026-06-01days on market $43,430 Active 221 DOM
-
2026-05-31days on market $43,430 Active 220 DOM
-
2026-05-31days on market $43,430 Active 219 DOM
-
2025-10-23$43,430 Active 341-char remark
Show marketing remark (341 chars)
This property is brimming with potential and offers a great opportunity for someone to create their dream home. While the home is in need of some TLC, its classic character and quiet location make it a fantastic project for those with vision. Whether envisioning a complete renovation or a creative rebuild, the canvas is yours to work with.
-
2025-02-03$43,430 Active
-
2018-12-10soldstatus $30,000
ⓘ Source: listings_history table (triggers on properties + properties_extension) + one-shot
backfill from property_details.listing_events for pre-trigger history.
Tax reassessment forecast LA · Resets to sale price
- Current annual tax
- $322 · $27/mo
- Projected year-2 tax
- $322 · $27/mo
- Expected delta
- $0/yr ($0/mo · 0.0%)
ⓘ Screening estimate from a state-policy table — verify with the county assessor before closing.
Climate risk First Street
- Flood 1/10 Low FEMA zone X (unshaded) · 0% chance over 30 yrs
- Wildfire 3/10 Moderate
- Heat 8/10 Severe 7 d/yr ≥111°F today · 19 d/yr by 30 yrs out
- Wind 9/10 Extreme 99% chance of damaging wind over 30 yrs
- Air quality 1/10 Low 0 unhealthy d/yr today · 0 by 30 yrs out
Nearby sold comps map
Loading sold comps map…
Walkable amenities ~0.75 mi
Loading nearby amenities…
Taxation est. · year 1
- Rental income
- $13,651
- − Mortgage interest
- −$2,433
- − Property taxes
- −$322
- − Insurance
- −$217
- − Repairs & maintenance
- −$1,092
- − Management
- −$1,092
- − Depreciation
- −$1,263
- Taxable income
- $7,231
- Est. tax owed @ 24.0%
- −$1,735
- After-tax cash flow
- $5,776/yr
For passive investors: Depreciation is non-cash, so a rental often shows a tax loss while cash-flowing — sheltering income. Rental losses are passive: they offset passive income freely, and up to $25,000/yr can offset ordinary (W-2) income if you actively participate and your MAGI is under $100k (phasing out to $0 by $150k); unused losses carry forward. On sale, claimed depreciation is recaptured at up to 25%, and gains may owe capital-gains tax (a 1031 exchange can defer both). Figures are a year-1 estimate at your 24.0% rate — not tax advice; consult a CPA.
Schools (NCES district)
- District
- Evangeline Parish
- NCES district ID
- 2200630
- Math proficiency
- 23% ▼ -46.00%
- Reading proficiency
- 36% ▼ -37.00%
- Median HH income
- $31,769
- Composite
- 24.0/100
- National rank
- #7774
- State rank
- #48 of 98 in LA
Livability — Ville Platte
- Score
- 58/100
- State rank
- #287
- US rank
- #20634
Category grades
Schools grade is shown separately in the Schools card above.
Census & demographics
- Population (ZIP)
- 18,939
Population outlook (Evangeline County) Hauer SSP2
- Today (2025)
- 33,019 people
- By 2030
- 32,359 · -2.0%
- By 2040
- 30,860 · -6.5%
- By 2050
- 29,125 · -11.8%
- By 2075
- 24,605 · -25.5%
- By 2100
- 18,499 · -44.0%
Race, ethnicity, and origin ACS 2023
- Neighborhood character
- Majority White (61%)
- Race & ethnicity
- White 61% Black 32% Two or more races 5% Hispanic / Latino 4%
- Common ancestry
- Lithuanian 12% Slovak 1%
- Foreign-born
- 1% · Canada
- Languages at home
- 86% English-only · French/Haitian/Cajun 13% Spanish 1%
Political lean MEDSL · Evangeline
- 2024 margin
- Solid R (+49.1) · D 24.9% · R 74.0% · Other 1.2%
- 2008→2024 swing
- -24.4pp toward R · 2008: -24.7pp · 2024: -49.1pp
- All cycles
- 2024: R+49.1 2020: R+44.7 2016: R+41.3 2012: R+30.7 2008: R+24.7
Not yet ingested
- Civics
- —
Market trends
- HPI YoY
- ▼ -58.91%
- Current HPI
- 113.4032
- Rent YoY
- —
- Metro
- —
- State GDP YoY
- ▲ 3.29%
- F500 in state
- 10
Industry mix (Fortune 500 HQ in LA)
| Industry | F500 HQs | Revenue |
|---|---|---|
| Telecommunications | 2 | $23B |
|
||
| Utilities | 1 | $12B |
|
||
| Wholesale / Distribution | 1 | $5B |
|
||
| Advertising | 1 | $2B |
|
||
Price history
+44.8% since first listed3 events — show timeline
- 2025-10-23 Listed $43,430 AcadianaMLS
- 2025-02-03 Listed $43,430 AcadianaMLS
- 2018-12-10 Sold (Public Records) $30,000 Public Records
Property tax history
-0.5%/yrLatest (2025): $322 · +0.2% YoY. Source: county tax records.
Cash-flow waterfall
monthlySold comps — $/sqft
last 12 mo · ≤1 miLoading sold comps…