32-34 N Poplar St · Mount Carmel, PA
Flood risk 6/10 · Moderate
- FEMA flood zone
- X (unshaded)
- Chance of flooding over 30 yrs
- 0.69%
- Est. flood insurance / yr
- $473 – $860
Fire risk 3/10 · Minor
- Est. fire insurance / yr
- $511 – $949
Heat risk 4/10 · Minor
- Hot days now (above 93°F)
- 8 days/yr
- Hot days in 30 yrs
- 17 days/yr
Wind risk 3/10 · Minor
- Chance of severe wind over 30 yrs
- 5.0%
Air-quality risk 2/10 · Minimal
- Unhealthy air days now
- 1 days/yr
- Unhealthy air days in 30 yrs
- 2 days/yr
Risk factors via First Street. Map © Google.
Why this score? — see what drove the D grade
The composite is a weighted blend of 9 inputs, each scored 0–100. Each bar is that input's sub-score; the figure is the points it added to the 100-point composite (weight × sub-score).
- Cash flow +9.4/30.0
- Appreciation +8.2/10.0
- ARV discount +7.5/15.0
- Livability +3.6/5.0
- 1% rule +2.8/10.0
- DSCR +2.6/10.0
- Rent growth +2.5/5.0
- Condition / age +2.5/5.0
- Schools +2.3/10.0
$185,000
🖨 Deal sheet 📄 Offer letter ✓ Due diligence
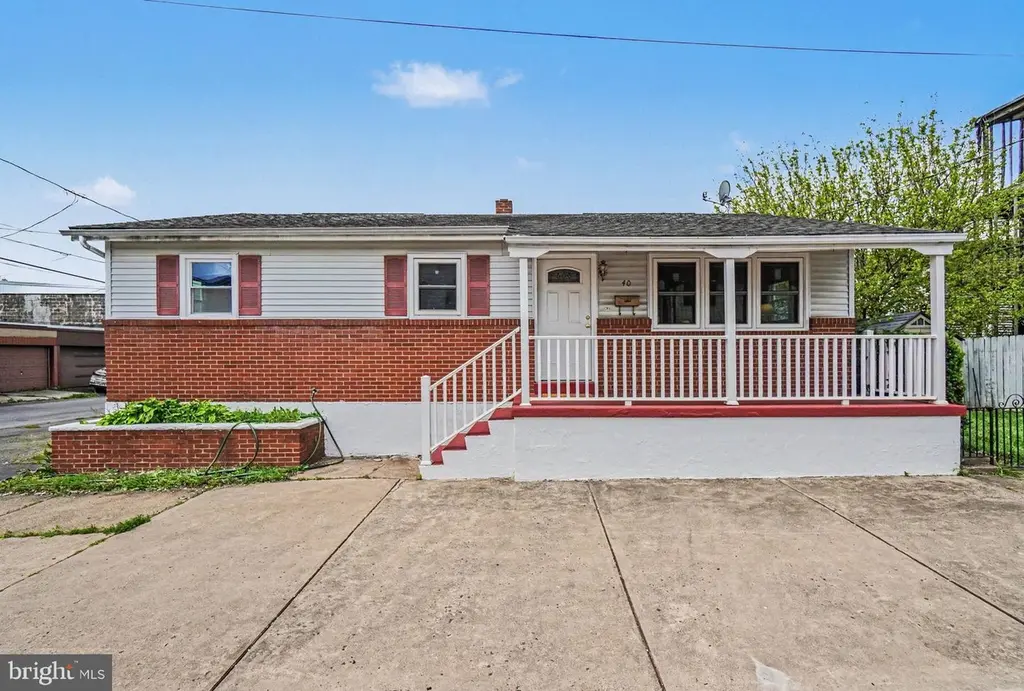
Listing remarks
Move right into this charming 3 bedroom ranch home offering convenient one-floor living, central air, and off-street parking! This well-kept home features a comfortable layout with bright living spaces and bedrooms all on the main level. The full basement adds great potential and includes a half bath plus a bar area, making it the perfect space to finish into a family room, game room, entertaining area, home gym, or hobby space. Whether you are a first-time buyer, downsizing, or looking for an easy-to-maintain home, this move-in ready rancher is full of opportunity. Schedule your showing today!
Key facts
- One-floor living
- Full basement
- Bar area
Tags
Property features AI
Exterior
- Parking: Driveway with 2 spaces; Total of 2 garage/parking spaces
- Utilities: Public water; Public sewer; Electric service
- Home design: Detached property; Estimated year built (effective remodel in 2003)
- Construction: Brick and vinyl siding exterior; Shingle roof; Block foundation
- Exterior features: Lot approximately 81 x 36; Not in a federal flood zone; Shed on property
Interior
- Bedrooms: Three bedrooms on the main level
- Flooring: Carpet
- Bathrooms: One full bathroom (main level)
- Heating & cooling: Forced air heating (electric); Central air conditioning; Ceiling fan(s); Electric hot water
- Interior features: Carpet flooring; Full, partially finished basement
- Laundry & utility: Laundry located in the basement
Neighborhood map
What this means for you Summary
Snapshot
- This is a 3-bed/1.0-bath single-family listed at $185k.
Deal economics
- At list price, monthly cash flow is $-133 ($-2k/yr) — negative.
- To cash-flow at today's rent, offer at most $166k (10.4% below list).
- To meet the 1% rule (rent ≥ 1% of price), the offer needs to be $145k (21.6% below list).
- Recommended offer: $145k (21.6% below list) — sets the bar for 1% rule.
- Cap rate 5.4% vs local median 12.2% in Mount Carmel — below-typical yield; the buyer is paying a premium for something (appreciation thesis, condition, location) that the cap rate doesn't capture.
Location & tenants
- Location reads 72/100 on livability (#641 in PA) — a middle-class / working-renter tenant base. Strengths: cost of living A+, health & safety A+, crime B+; Watch: schools D+, commute F, employment F.
- Mount Carmel Area SD (town): math 20% / reading 37% proficiency, ranked #455 of 539 in PA (top 84%) — low school quality limits family demand, transient renter base, plan for 1-2y turnover.
- Market conditions: 54 active listings in the ZIP; 1 comparable units currently listed for rent nearby; 81 units permitted in Northumberland County in 2024 (0 in 5+ unit buildings).
Forward outlook
- In year one you build about $13k of equity ($1k loan paydown + $12k appreciation (6.3% local appreciation)).
- Northumberland County population projected at -11% by 2050 — secular population decline; favor cash flow + early exit over multi-decade hold.
- By year 3, paydown + projected appreciation supports a ~$32k cash-out refi (75% LTV) — recoverable capital for the next deal without selling this one.
Negotiation context
- It's been on market 16 days — a 2% lower offer ($182k) is reasonable based on typical stale-listing flexibility.
Risks & watch-outs
- Climate carrying-cost: major flood risk — expect insurance premiums to compound above CPI over the hold.
Questions for the listing agent
- What do current leases actually rent for vs. the listed asking? Can we see a recent rent roll and the last 12 months of T-12 income?
- Built in 1974 — when were the roof, HVAC, electrical panel, plumbing, and water heater last replaced?
- Is there a deadline driving the sale (1031 exchange, divorce, estate, relocation)? That informs how much negotiation room exists.
- Schools are D-rated, which usually means shorter tenancies and higher turnover. Who's the typical renter profile here, and what's been the actual vacancy rate?
- The area grade is low — what's the realistic commute time and amenity access for the typical tenant pool here? Any planned neighborhood developments (good or bad) we should know about?
- What's the average days-on-market for RENTAL listings here right now (not sales)? A rising rental-DOM trend means longer vacancies and softer asking-rent achievability than the comps imply.
- What's the recent tenant-quality profile in this submarket — average credit score on applications, eviction rate, late-payment / NSF rate, and stable-employment percentage? A property-management company in the area should have these aggregated.
- How much new for-sale + rental construction is in the pipeline within 1–3 miles? Heavy new supply typically softens prices + rents 12–24 months out; constrained supply supports both.
Investment metrics
- 1% rule
- 0.78% ✗
- Cap rate
- 5.43%
- Cash-on-cash
- -3.08%
- DSCR
- 0.86
- GRM
- 10.6
CMA / ARV
- ARV (on-the-fly)
- $69,632
- Comps found
- 12
Show comp detail 12 sales within ~0.75 mi
| Address | Dist | Beds/Ba | Sqft | Sold | Price | $/sf | Match |
|---|---|---|---|---|---|---|---|
| 217 W 2nd St | 0.07mi | 3/1.5 | 1,064 (+4%) | 6mo | $45,000 | $42 | 83 |
| 200 W 4th St | 0.15mi | 3/1.0 | 960 (-6%) | 5mo | $43,000 | $45 | 78 |
| 309 W 2nd St W | 0.04mi | 3/1.0 | 976 (-5%) | 17mo | $89,900 | $92 | 76 |
| 414 W 4th St | 0.16mi | 3/1.0 | 900 (-12%) | 7mo | $65,000 | $72 | 66 |
| 530 W 3rd St | 0.19mi | 2/1.0 (-1) | 1,105 (+8%) | 9mo | $65,000 | $59 | 65 |
| 113 N Hickory St | 0.33mi | 2/1.5 (-1) | 1,100 (+7%) | 2mo | $65,000 | $59 | 64 |
| 401 E 7th St | 0.65mi | 3/1.0 | 1,015 (-1%) | 6mo | $165,000 | $163 | 63 |
| 210 W Saylor St | 0.52mi | 3/1.0 | 952 (-7%) | 10mo | $50,000 | $53 | 56 |
| 14 N Maple St | 0.15mi | 3/1.0 | 1,176 (+15%) | 16mo | $45,000 | $38 | 55 |
| 319 W Butternut St | 0.15mi | 2/2.0 (-1) | 894 (-13%) | 10mo | $60,600 | $68 | 55 |
| 129 Saylor St W | 0.49mi | 2/1.0 (-1) | 882 (-14%) | 3mo | $65,000 | $74 | 47 |
| 140 S Spruce St | 0.71mi | 3/1.0 | 1,100 (+7%) | 10mo | $80,000 | $73 | 47 |
Match score weights: distance 35% · size 25% · config 20% · recency 20%. Top-matched comps best support the ARV.
Projected returns pro-forma
6.31% appreciation · 3.0% rent growth · sell at horizon
- IRR
- 13.6%
- Equity multiple
- 1.93×
- Total profit
- $48,409
- Equity at exit
- $119,962
- IRR
- 14.0%
- Equity multiple
- 3.86×
- Total profit
- $148,218
- Equity at exit
- $220,780
Cash invested: $51,800 (down + closing). Projections, not guarantees.
Landlord ↔ Tenant lean methodology
- Overall (STATE)
- 62 Landlord-Friendly
- State Pennsylvania
- 62 Landlord-Friendly · EVEN
- County
- — inherits STATE
- City
- — inherits STATE
ZIP-level market 17851
- Home prices YoY
- 5.2%
- Active inventory
- 54
- Price-to-rent
- 10.6×
Monthly cashflow live
- Estimated rent
- $1,450 medium interval (Pro) →
- Mortgage (P&I)
- −$970
- Tax est. 1.5%
- −$231 /mo · $2,775/yr
- Insurance
- −$77
- HOA
- −$0
- Vacancy / Maint / Mgmt
- −$304
- Net cashflow
- $-133
Break-even live
UW: 25.0% down · 7.5% · 30yr · 1.5% tax · 5.0% vac · 8.0% maint · 8.0% mgmt
Financing live
Cash to close
- Down payment
- $46,250
- Closing costs
- $5,550
- Reserves months
- —
- Total cash needed
- —
Loan-product check · same deal, 3 products live
Conventional
25% down · 7.5% · 30yr
- Down + closing
- —
- Monthly P&I
- —
- Monthly cashflow
- —
- DSCR
- —
- Eligible?
- —
Personal DTI + credit; lowest rate.
DSCR
20% down · 8.5% · 30yr
- Down + closing
- —
- Monthly P&I
- —
- Monthly cashflow
- —
- DSCR
- —
- Eligible?
- —
No personal income docs; deal must DSCR.
Hard money
10% down · 12.0% · 12mo
- Down + closing
- —
- Monthly P&I
- —
- Monthly cashflow
- —
- DSCR
- —
- Eligible?
- —
Short-term bridge; refi at stabilization.
Rent comps 1 comps
| Address | Beds | Baths | Sqft | Rent | $/sqft | DOM | Units | Dist |
|---|---|---|---|---|---|---|---|---|
| 414 W 4th St Mount Carmel, PA | 3.0 | 1.5 | 900 | $1,450 | $1.61 | 43d | 1 | 0.17mi |
Listing history 12 events
-
2026-06-18days on market $185,000 Active 16 DOM
-
2026-06-17days on market $185,000 Active 15 DOM
-
2026-06-16days on market $185,000 Active 14 DOM
-
2026-06-15days on market $185,000 Active 13 DOM
-
2026-06-13days on market $185,000 Active 11 DOM
-
2026-06-12days on market $185,000 Active 10 DOM
-
2026-06-09days on market $185,000 Active 7 DOM
-
2026-06-08days on market $185,000 Active 6 DOM
-
2026-06-08days on market $185,000 Active 5 DOM
-
2026-06-07days on market $185,000 Active 4 DOM
-
2026-06-03remarks 601-char remark
-
2026-06-03$185,000 Active 1 DOM
ⓘ Source: listings_history table (triggers on properties + properties_extension) + one-shot
backfill from property_details.listing_events for pre-trigger history.
Climate risk First Street
- Flood 6/10 Major FEMA zone X (unshaded) · 69% chance over 30 yrs
- Wildfire 3/10 Moderate
- Heat 4/10 Moderate 8 d/yr ≥93°F today · 17 d/yr by 30 yrs out
- Wind 3/10 Moderate 5% chance of damaging wind over 30 yrs
- Air quality 2/10 Low 1 unhealthy d/yr today · 2 by 30 yrs out
Nearby sold comps map
Loading sold comps map…
Walkable amenities ~0.75 mi
Loading nearby amenities…
Taxation est. · year 1
- Rental income
- $17,400
- − Mortgage interest
- −$10,363
- − Property taxes
- −$2,775
- − Insurance
- −$925
- − Repairs & maintenance
- −$1,392
- − Management
- −$1,392
- − Depreciation
- −$5,382
- Taxable loss
- −$4,829
- Est. tax savings @ 24.0%
- +$1,159
- After-tax cash flow
- $-437/yr
For passive investors: Depreciation is non-cash, so a rental often shows a tax loss while cash-flowing — sheltering income. Rental losses are passive: they offset passive income freely, and up to $25,000/yr can offset ordinary (W-2) income if you actively participate and your MAGI is under $100k (phasing out to $0 by $150k); unused losses carry forward. On sale, claimed depreciation is recaptured at up to 25%, and gains may owe capital-gains tax (a 1031 exchange can defer both). Figures are a year-1 estimate at your 24.0% rate — not tax advice; consult a CPA.
Schools (NCES district)
- District
- Mount Carmel Area SD
- NCES district ID
- 4215990
- Math proficiency
- 20% ▼ -18.00%
- Reading proficiency
- 37% ▼ -15.00%
- Median HH income
- $35,195
- Composite
- 23.48/100
- National rank
- #7876
- State rank
- #455 of 539 in PA
Livability — Mount Carmel
- Score
- 72/100
- State rank
- #641
- US rank
- #6230
Category grades
Schools grade is shown separately in the Schools card above.
Census & demographics
- Census place
- Mount Carmel, PA
- Population (ZIP)
- 7,174
Population outlook (Northumberland County) Hauer SSP2
- Today (2025)
- 90,896 people
- By 2030
- 89,084 · -2.0%
- By 2040
- 84,822 · -6.7%
- By 2050
- 80,521 · -11.4%
- By 2075
- 72,152 · -20.6%
- By 2100
- 62,257 · -31.5%
Race, ethnicity, and origin ACS 2023
- Neighborhood character
- Predominantly White (92%)
- Race & ethnicity
- White 92% Two or more races 5% Hispanic / Latino 4% Black 1%
- Common ancestry
- Romanian 21% Subsaharan African 3% Iranian 2%
- Foreign-born
- 2% · Canada
- Languages at home
- 96% English-only · Spanish 3% Russian/Polish/Slavic 1%
Political lean MEDSL · Northumberland
- 2024 margin
- Solid R (+39.9) · D 29.6% · R 69.5%
- 2008→2024 swing
- -26.1pp toward R · 2008: -13.8pp · 2024: -39.9pp
- All cycles
- 2024: R+39.9 2020: R+38.5 2016: R+43.6 2012: R+19.4 2008: R+13.8
Not yet ingested
- Civics
- —
Market trends
- HPI YoY
- ▲ 6.31%
- Current HPI
- 127.4102
- Rent YoY
- —
- Metro
- —
- State GDP YoY
- ▲ 1.68%
- F500 in state
- 34
Industry mix (Fortune 500 HQ in PA)
| Industry | F500 HQs | Revenue |
|---|---|---|
| Healthcare | 2 | $309B |
|
||
| Insurance | 2 | $27B |
|
||
| Telecommunications / Media | 1 | $124B |
|
||
| Industrial Distribution | 1 | $22B |
|
||
| Financial Services | 1 | $20B |
|
||
| Chemicals / Materials | 1 | $18B |
|
||
Price history
1 event — show timeline
- 2026-06-02 Listed $185,000 BRIGHT MLS
Cash-flow waterfall
monthlySold comps — $/sqft
last 12 mo · ≤1 miLoading sold comps…