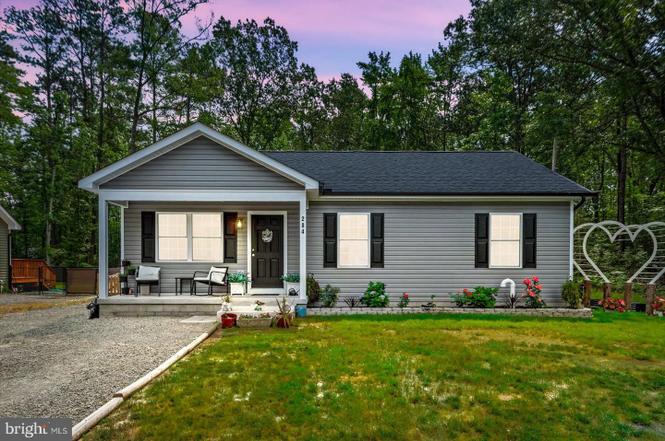
284 Shorewood Dr · Colonial Beach, VA
Flood risk 1/10 · Minimal
- FEMA flood zone
- X (unshaded)
- Chance of flooding over 30 yrs
- 0.0%
- Est. flood insurance / yr
- $507 – $1,088
Fire risk 4/10 · Minor
- Est. fire insurance / yr
- $666 – $1,236
Heat risk 8/10 · Major
- Hot days now (above 108°F)
- 7 days/yr
- Hot days in 30 yrs
- 15 days/yr
Wind risk 6/10 · Moderate
- Chance of severe wind over 30 yrs
- 27.0%
Air-quality risk 2/10 · Minimal
- Unhealthy air days now
- 2 days/yr
- Unhealthy air days in 30 yrs
- 2 days/yr
Risk factors via First Street. Map © Google.
Why this score? — see what drove the D- grade
The composite is a weighted blend of 9 inputs, each scored 0–100. Each bar is that input's sub-score; the figure is the points it added to the 100-point composite (weight × sub-score).
- Cash flow +14.0/30.0
- DSCR +4.2/10.0
- Schools +4.0/10.0
- Livability +3.0/5.0
- 1% rule +2.8/10.0
- ARV discount +2.8/15.0
- Rent growth +2.5/5.0
- Condition / age +2.5/5.0
- Appreciation +0.0/10.0
$315,000
🖨 Deal sheet (PDF) 📄 Offer letter ✓ Due diligence
Listing remarks
Welcome to 284 Shorewood Drive in Colonial Beach, Virginia! Built in 2024 and meticulously maintained, this like-new ranch-style home offers the perfect blend of modern comfort and peaceful living. Featuring 3 bedrooms, 2 full bathrooms, and 1,132 square feet of thoughtfully designed living space, this home is move-in ready and waiting for its next owner. The bright and functional kitchen is equipped with stainless steel appliances, a new garbage disposal, and ample cabinet space, flowing seamlessly into the main living area. Step outside and enjoy everything this property has to offer. The spacious rear deck is perfect for entertaining, grilling, or simply relaxing while overlooking the fu
Key facts
- Inviting front porch
- Oversized driveway
- Spacious rear deck
Tags
Property features AI
Finance
- Other: Water-oriented property with access for boating, canoe/kayak, fishing, personal watercraft, swimming, and waterski/wakeboard (Mattox Creek)
- HOA & community: Community boat ramp; Community center; Lake access; Picnic area; Water/lake privileges; Private water access; Community dock (1)
Exterior
- Parking: Gravel driveway; Driveway parking
- Utilities: Public water; Public sewer; Electric hot water; Electric heating/cooling; Central A/C
- Home design: Detached property; Estimated year built
- Construction: Vinyl siding; Block and concrete elements; Stick-built construction; Batts and blown-in insulation; CPVC/PVC; Crawl space foundation; Architectural shingle roof
- Exterior features: Wood fencing; Deck(s); Porch(es); Shed; Navigable water access (Mattox Creek)
Interior
- Kitchen: Built-in microwave; Dishwasher; Disposal; Electric range/oven; Refrigerator; Stainless steel appliances
- Bedrooms: 3 bedrooms on the main level
- Flooring: Luxury vinyl plank
- Bathrooms: 2 full bathrooms on the main level
- Heating & cooling: Heat pump heating; Central air; Ceiling fans; Electric heating and cooling components
- Interior features: Attic; Ceiling fans; Open floor plan with combination dining/living and kitchen/dining areas; Dining area; Master bathroom; Recessed lighting; Stall shower; Tub/shower; Upgraded countertops; Drywall walls/ceilings
- Laundry & utility: Stacked washer/dryer; Electric water heater
Neighborhood map
What this means for you Summary
Snapshot
- This is a 3-bed/2.0-bath single-family listed at $315k.
Deal economics
- At list price, monthly cash flow is $39 ($463/yr) — positive.
- The deal already cash-flows at list — no discount required.
- To meet the 1% rule (rent ≥ 1% of price), the offer needs to be $247k (21.5% below list).
- Recommended offer: $247k (21.5% below list) — sets the bar for 1% rule.
- Cap rate 6.4% vs local median 4.5% in Colonial Beach — top-decile yield for the area; either an underpriced asset or a hidden risk that comps aren't pricing in. Stress-test before assuming the spread holds.
Location & tenants
- Location reads 59/100 on livability (#460 in VA) — a working-class tenant base; expect higher turnover. Strengths: crime B, cost of living B; Watch: amenities F, commute F, health & safety F.
- Westmoreland County Public School District (rural): math 34% / reading 59% proficiency, ranked #105 of 131 in VA (top 80%) — families likely to look elsewhere, expect single-tenant / working-renter base with shorter leases; 64% free/reduced lunch — lower-income household profile, screen leases tightly.
- Zoned schools: Washington District Elementary (math 32% / reading 52%, grade F, #866 of 1,108 statewide, top 80%, 385 students, 100% FRL); Montross Middle (math 38% / reading 58%, grade C-, #247 of 342 statewide, top 74%, 309 students, 101% FRL); Westmoreland High (math 32% / reading 82%, grade C, #263 of 319 statewide, top 84%, 486 students, 100% FRL) — zoned schools average 100% FRL vs 64% district-wide (36 pts higher); higher-poverty schools than district average — tighter screening recommended.
- Market conditions: 195 active listings in the ZIP; 2 comparable units currently listed for rent nearby; 220 units permitted in Westmoreland County in 2024 (0 in 5+ unit buildings).
- At $2,472/mo this rent would consume 46% of the median local household income ($65k/yr) (locally 126% of renters already pay >50% of income on rent) — very limited rent-growth headroom before tenants either downsize or default.
Forward outlook
- Local home prices are declining (-3.0%/yr); year-one equity from $2k of loan paydown is wiped out by about $9k of value loss. Plan a longer hold.
- Westmoreland County population projected to shrink 7% by 2050 — rents likely to lag national; underwrite the cash flow, not the appreciation.
Negotiation context
- Only 10 days on market — expect competitive offers; lowballing is unlikely to land.
Risks & watch-outs
- Climate carrying-cost: major wind risk, 27% chance of damaging wind over 30y; extreme-heat days projected 7→15/yr by 2055 (HVAC capex compounding) — expect insurance premiums to compound above CPI over the hold.
Questions for the listing agent
- Is there a deadline driving the sale (1031 exchange, divorce, estate, relocation)? That informs how much negotiation room exists.
- Schools are B-rated — typically a magnet for longer-tenancy family renters. What's the average tenant stay here, and is there a school-zone premium baked into asking?
- The area grade is low — what's the realistic commute time and amenity access for the typical tenant pool here? Any planned neighborhood developments (good or bad) we should know about?
- What's the average days-on-market for RENTAL listings here right now (not sales)? A rising rental-DOM trend means longer vacancies and softer asking-rent achievability than the comps imply.
- What's the recent tenant-quality profile in this submarket — average credit score on applications, eviction rate, late-payment / NSF rate, and stable-employment percentage? A property-management company in the area should have these aggregated.
- How much new for-sale + rental construction is in the pipeline within 1–3 miles? Heavy new supply typically softens prices + rents 12–24 months out; constrained supply supports both.
Investment metrics
- 1% rule
- 0.78% ✗
- Cap rate
- 6.44%
- Cash-on-cash
- 0.52%
- DSCR
- 1.02
- GRM
- 10.6
CMA / ARV
- ARV (on-the-fly)
- $285,264
- Comps found
- 12
Show comp detail 12 sales within ~0.75 mi
| Address | Dist | Beds/Ba | Sqft | Sold | Price | $/sf | Match |
|---|---|---|---|---|---|---|---|
| 85 Wildwood Rd | 0.08mi | 3/2.0 | 1,224 (+8%) | 2mo | $309,900 | $253 | 81 |
| 218 Shorewood Dr | 0.09mi | 3/2.0 | 1,224 (+8%) | 2mo | $290,000 | $237 | 80 |
| 227 Forest Grove Rd | 0.40mi | 3/2.0 | 1,120 (-1%) | 4mo | $297,000 | $265 | 76 |
| 245 Azure Dr | 0.18mi | 3/2.0 | 1,224 (+8%) | 5mo | $309,900 | $253 | 74 |
| 249 Wildwood Rd | 0.14mi | 3/2.0 | 1,296 (+14%) | 1mo | $359,000 | $277 | 69 |
| 261 Azure Dr | 0.18mi | 3/2.0 | 1,288 (+14%) | 2mo | $311,000 | $241 | 67 |
| 339 Azure Dr | 0.19mi | 3/2.0 | 1,288 (+14%) | 3mo | $310,000 | $241 | 66 |
| 236 Forest Grove Rd | 0.40mi | 3/2.0 | 1,224 (+8%) | 3mo | $314,900 | $257 | 65 |
| 218 Circle Ln | 0.64mi | 3/2.0 | 1,080 (-5%) | 1mo | $272,000 | $252 | 62 |
| 84 Pinewood Ln | 0.34mi | 3/2.0 | 1,300 (+15%) | 1mo | $324,900 | $250 | 59 |
| 43 Dale Dr | 0.50mi | 2/1.0 (-1) | 962 (-15%) | 5mo | $240,000 | $249 | 38 |
| 130 Poplar Rd | 0.73mi | 3/2.0 | 1,296 (+14%) | 6mo | $316,680 | $244 | 36 |
Match score weights: distance 35% · size 25% · config 20% · recency 20%. Top-matched comps best support the ARV.
Projected returns pro-forma
-3.0% appreciation · 3.0% rent growth · sell at horizon
- IRR
- -15.5%
- Equity multiple
- 0.45×
- Total profit
- $-48,711
- Equity at exit
- $46,968
- IRR
- -7.1%
- Equity multiple
- 0.55×
- Total profit
- $-39,758
- Equity at exit
- $27,235
Cash invested: $88,200 (down + closing). Projections, not guarantees.
Landlord ↔ Tenant lean methodology
- Overall (STATE)
- 55 Moderately Landlord-Leaning
- State Virginia
- 55 Moderately Landlord-Leaning · D+2
- County
- — inherits STATE
- City
- — inherits STATE
ZIP-level market 22443
- Active inventory
- 195
- Price-to-rent
- 10.6×
Monthly cashflow live
- Estimated rent
- $2,472 medium interval (Pro) →
- Mortgage (P&I)
- −$1,652
- Tax from tax record
- −$131 /mo · $1,573/yr
- Insurance
- −$131
- HOA
- −$0
- Vacancy / Maint / Mgmt
- −$519
- Net cashflow
- $39
Break-even live
Sensitivity live
| Price | -10% $217 | -5% $128 | +0% $39 | +5% $-51 | +10% $-140 |
|---|---|---|---|---|---|
| Rent | -10% $-157 | -5% $-59 | +0% $39 | +5% $136 | +10% $234 |
| Rate | -1.0pp $197 | -0.5pp $119 | base $39 | +0.5pp $-43 | +1.0pp $-126 |
UW: 25.0% down · 7.5% · 30yr · 1.5% tax · 5.0% vac · 8.0% maint · 8.0% mgmt
Financing live
Cash to close
- Down payment
- $78,750
- Closing costs
- $9,450
- Reserves months
- —
- Total cash needed
- —
Loan-product check · same deal, 3 products live
Conventional
25% down · 7.5% · 30yr
- Down + closing
- —
- Monthly P&I
- —
- Monthly cashflow
- —
- DSCR
- —
- Eligible?
- —
Personal DTI + credit; lowest rate.
DSCR
20% down · 8.5% · 30yr
- Down + closing
- —
- Monthly P&I
- —
- Monthly cashflow
- —
- DSCR
- —
- Eligible?
- —
No personal income docs; deal must DSCR.
Hard money
10% down · 12.0% · 12mo
- Down + closing
- —
- Monthly P&I
- —
- Monthly cashflow
- —
- DSCR
- —
- Eligible?
- —
Short-term bridge; refi at stabilization.
Rent comps 2 comps
| Address | Beds | Baths | Sqft | Rent | $/sqft | DOM | Units | Dist |
|---|---|---|---|---|---|---|---|---|
| 47 Birch Ln Colonial Beach, VA | 3.0 | 2.0 | 1300 | $2,545 | $1.96 | 16d | 1 | 0.36mi |
| 14 Azalea Way Colonial Beach, VA | 3.0 | 2.0 | 1311 | $2,250 | $1.72 | 45d | 1 | 0.62mi |
Listing history 8 events
-
2026-06-21days on market $315,000 Active 10 DOM
-
2026-06-18days on market $315,000 Active 7 DOM
-
2026-06-17days on market $315,000 Active 6 DOM
-
2026-06-16days on market $315,000 Active 5 DOM
-
2026-06-15days on market $315,000 Active 4 DOM
-
2026-06-14days on market $315,000 Active 2 DOM
-
2026-06-13remarks 699-char remark
-
2026-06-13$315,000 Active 1 DOM
ⓘ Source: listings_history table (triggers on properties + properties_extension) + one-shot
backfill from property_details.listing_events for pre-trigger history.
Tax reassessment forecast VA · Resets to sale price
- Current annual tax
- $1,573 · $131/mo
- Projected year-2 tax
- $2,583 · $215/mo
- Expected delta
- +$1,010/yr (+$84/mo · 64.2%)
ⓘ Screening estimate from a state-policy table — verify with the county assessor before closing.
Climate risk First Street
- Flood 1/10 Low FEMA zone X (unshaded) · 0% chance over 30 yrs
- Wildfire 4/10 Moderate
- Heat 8/10 Severe 7 d/yr ≥108°F today · 15 d/yr by 30 yrs out
- Wind 6/10 Major 27% chance of damaging wind over 30 yrs
- Air quality 2/10 Low 2 unhealthy d/yr today · 2 by 30 yrs out
Nearby sold comps map
Loading sold comps map…
Walkable amenities ~0.75 mi
Loading nearby amenities…
Taxation est. · year 1
- Rental income
- $29,663
- − Mortgage interest
- −$17,645
- − Property taxes
- −$1,573
- − Insurance
- −$1,575
- − Repairs & maintenance
- −$2,373
- − Management
- −$2,373
- − Depreciation
- −$9,164
- Taxable loss
- −$5,040
- Est. tax savings @ 24.0%
- +$1,210
- After-tax cash flow
- $1,672/yr
For passive investors: Depreciation is non-cash, so a rental often shows a tax loss while cash-flowing — sheltering income. Rental losses are passive: they offset passive income freely, and up to $25,000/yr can offset ordinary (W-2) income if you actively participate and your MAGI is under $100k (phasing out to $0 by $150k); unused losses carry forward. On sale, claimed depreciation is recaptured at up to 25%, and gains may owe capital-gains tax (a 1031 exchange can defer both). Figures are a year-1 estimate at your 24.0% rate — not tax advice; consult a CPA.
Schools (NCES district)
- District
- Westmoreland County Public School District
- NCES district ID
- 5103980
- Math proficiency
- 34% ▼ -47.00%
- Reading proficiency
- 59% ▼ -11.00%
- Median HH income
- $51,665
- Composite
- 39.94/100
- National rank
- #3845
- State rank
- #105 of 131 in VA
Livability — Colonial Beach
- Score
- 59/100
- State rank
- #460
- US rank
- #19615
Category grades
Schools grade is shown separately in the Schools card above.
Census & demographics
- County
- Westmoreland County · 10,011 people
- City population
- 10,011
- Metro
- nan
- Population (ZIP)
- 10,011
- Household income
- $64,810
- Rent vs Own
- Severe rent burden
- 126.0
Population outlook (Westmoreland County) Hauer SSP2
- Today (2025)
- 17,643 people
- By 2030
- 17,520 · -0.7%
- By 2040
- 17,041 · -3.4%
- By 2050
- 16,397 · -7.1%
- By 2075
- 15,012 · -14.9%
- By 2100
- 12,917 · -26.8%
Race, ethnicity, and origin ACS 2023
- Neighborhood character
- Predominantly White (71%)
- Race & ethnicity
- White 71% Black 15% Two or more races 7% Hispanic / Latino 6% Asian 2%
- Hispanic origin (detail)
- Mexican 5%
- Common ancestry
- Slovak 2% Italian 2% Scotch-Irish 1%
- Foreign-born
- 3% · Canada
- Languages at home
- 96% English-only · Spanish 3%
Political lean MEDSL · Westmoreland
- 2024 margin
- R (+14.3) · D 42.4% · R 56.7%
- 2008→2024 swing
- -24.5pp toward R · 2008: 10.2pp · 2024: -14.3pp
- All cycles
- 2024: R+14.3 2020: R+8.2 2016: R+7.3 2012: D+0.5 2008: D+10.2
Not yet ingested
- Civics
- —
Market trends
- HPI YoY
- ▼ -127.23%
- Current HPI
- 152.1518
- Rent YoY
- —
- Metro
- nan
- State GDP YoY
- ▲ 2.40%
- F500 in state
- 50
Industry mix (Fortune 500 HQ in VA)
| Industry | F500 HQs | Revenue |
|---|---|---|
| Aerospace / Defense | 4 | $236B |
|
||
| Technology / Defense | 3 | $32B |
|
||
| Financial Services | 2 | $176B |
|
||
| Utilities | 2 | $27B |
|
||
| Insurance | 2 | $25B |
|
||
| Technology | 2 | $15B |
|
||
Price history
+5.4% since first listed2 events — show timeline
- 2026-06-11 Listed $315,000 BRIGHT MLS
- 2024-09-10 Sold (Public Records) $298,900 Public Records
Property tax history
+36.3%/yrLatest (2025): $1,573 · +689.9% YoY. Source: county tax records.
Cash-flow waterfall
monthlySold comps — $/sqft
last 12 mo · ≤1 miLoading sold comps…