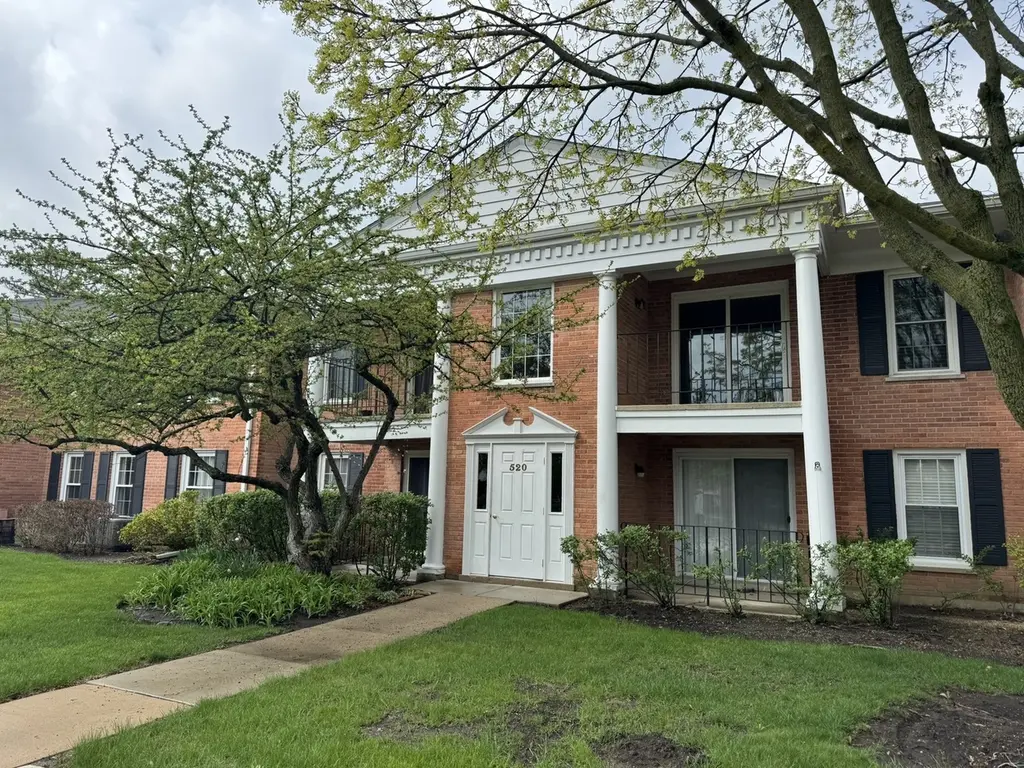
520 Shorely Dr #102 · Barrington, IL
Flood risk No data
- FEMA flood zone
- —
- Chance of flooding over 30 yrs
- —
- Est. flood insurance / yr
- —
Fire risk No data
- Est. fire insurance / yr
- —
Heat risk No data
- Hot days now (above threshold)
- —
- Hot days in 30 yrs
- —
Wind risk No data
- Chance of severe wind over 30 yrs
- —
Air-quality risk No data
- Unhealthy air days now
- —
- Unhealthy air days in 30 yrs
- —
Risk factors via First Street. Map © Google.
Why this score? — see what drove the D grade
The composite is a weighted blend of 9 inputs, each scored 0–100. Each bar is that input's sub-score; the figure is the points it added to the 100-point composite (weight × sub-score).
- Cash flow +11.4/30.0
- ARV discount +7.5/15.0
- 1% rule +5.9/10.0
- Schools +4.7/10.0
- Livability +3.9/5.0
- DSCR +3.3/10.0
- Rent growth +2.5/5.0
- Condition / age +2.5/5.0
- Appreciation +0.0/10.0
$225,000
🖨 Deal sheet (PDF) 📄 Offer letter ✓ Due diligence
Listing remarks
Lovely updated 2-bedroom, 2 full bathroom ground floor unit in Barrington! Ideally located close to shopping, Metra, restaurants, and parks, this move-in ready home offers both comfort and convenience. The updated kitchen features white cabinets and granite countertops flowing into an open, functional layout perfect for everyday living. Spacious bedrooms include large closets, and the primary bathroom is designed with a walk-in shower, low threshold, grab bars for easy accessibility. Additional highlights include sliding doors to patio area, recessed lighting, designated 1-car garage, ample outdoor parking, and a private storage closet on the same level. A great opportunity for both homeown
Key facts
- $465 HOA
- Garage
- Built 1969
Property features AI
Finance
- Other: Parcel number 13363030980000; Property is offered with possession at closing
- HOA & community: Monthly association fee of $465; Association includes water, insurance, exterior maintenance, lawn care, and snow removal; Pets allowed (cats OK)
Exterior
- Parking: Detached 1-car garage (owned)
- Home design: Attached single (condo); Entry on level 1; Currently leased
- Construction: Built approximately 51–60 years ago; Built before 1978
- Exterior features: Condo community setting
Interior
- Bedrooms: 2 bedrooms; Master bedroom with full bath
- Bathrooms: 2 full bathrooms
- Interior features: Dining room; Family room; Living room; Laundry room
- Laundry & utility: In-unit laundry
Neighborhood map
What this means for you Summary
Snapshot
- This is a 2-bed/2.0-bath condo listed at $225k.
Deal economics
- At list price, monthly cash flow is $-79 ($-952/yr) — negative.
- To cash-flow at today's rent, offer at most $214k (5.1% below list).
- Meets the 1% rule at list price ($2k rent vs $225k).
- Recommended offer: $214k (5.1% below list) — sets the bar for cash-flow.
- Cap rate 5.9% vs local median 2.4% in Barrington — top-decile yield for the area; either an underpriced asset or a hidden risk that comps aren't pricing in. Stress-test before assuming the spread holds.
Location & tenants
- Location reads 77/100 on livability (#156 in IL, #2,854 nationally) — a middle-class / working-renter tenant base. Strengths: crime A+, employment A+, housing A-; Watch: health & safety D+, amenities D-, cost of living F.
- Barrington CUSD 220 (suburban): math 46% / reading 49% proficiency, ranked #42 of 620 in IL (top 7%) — families likely to look elsewhere, expect single-tenant / working-renter base with shorter leases; only 16% free/reduced lunch — higher-income household profile.
- Zoned schools: Hough Street Elem School (math 57% / reading 62%, grade B-, #68 of 2,056 statewide, top 4%, 275 students, 0% FRL); Barrington Middle Sch Station (math 32% / reading 44%, grade F, #159 of 665 statewide, top 25%, 964 students, 0% FRL); Barrington High School (math 61% / reading 59%, grade C+, #18 of 693 statewide, top 3%, 2,802 students, 0% FRL) — zoned schools average 0% FRL vs 16% district-wide (16 pts lower); this property's tenant base skews higher-income than the district average.
- Market conditions: 246 active listings in the ZIP; 16 comparable units currently listed for rent nearby; rentals at typical pace (median 26d on market — plan ~3-4 weeks tenant-placement turnaround); high-income renter base; 948 units permitted in Lake County in 2024 (424 in 5+ unit buildings).
- This rent is only 17% of the median local income ($178k/yr) — well below the 30% rent-burden line; pricing power to push rent on renewal without tenant pushback.
Forward outlook
- Local home prices are declining (-3.0%/yr); year-one equity from $2k of loan paydown is wiped out by about $7k of value loss. Plan a longer hold.
- Lake County population projected to shrink 8% by 2050 — rents likely to lag national; underwrite the cash flow, not the appreciation.
Negotiation context
- It's been on market 18 days — a 2% lower offer ($222k) is reasonable based on typical stale-listing flexibility.
Questions for the listing agent
- What do current leases actually rent for vs. the listed asking? Can we see a recent rent roll and the last 12 months of T-12 income?
- Built in 1969 — when were the roof, HVAC, electrical panel, plumbing, and water heater last replaced?
- What does the HOA fee cover, when was the last increase, and are there any pending special assessments or reserve-fund shortfalls?
- Any open or pending special assessments — roof, HVAC, plumbing, elevator, façade? What's the per-unit balance and payoff schedule, and is the seller paying it off at close or rolling it to the buyer?
- Is there a deadline driving the sale (1031 exchange, divorce, estate, relocation)? That informs how much negotiation room exists.
- Schools are A-rated — typically a magnet for longer-tenancy family renters. What's the average tenant stay here, and is there a school-zone premium baked into asking?
- The area grade is low — what's the realistic commute time and amenity access for the typical tenant pool here? Any planned neighborhood developments (good or bad) we should know about?
- What's the average days-on-market for RENTAL listings here right now (not sales)? A rising rental-DOM trend means longer vacancies and softer asking-rent achievability than the comps imply.
- What's the recent tenant-quality profile in this submarket — average credit score on applications, eviction rate, late-payment / NSF rate, and stable-employment percentage? A property-management company in the area should have these aggregated.
- How much new apartment / multifamily construction is in the pipeline within 1–3 miles? Heavy new supply (>2% of stock underway) typically softens rents 12–24 months out; light construction supports rent growth.
Investment metrics
- 1% rule
- 1.09% ✓
- Cap rate
- 5.87%
- Cash-on-cash
- -1.51%
- DSCR
- 0.93
- GRM
- 7.6
CMA / ARV
No comps found within radius.
Projected returns pro-forma
-3.0% appreciation · 3.0% rent growth · sell at horizon
- IRR
- -18.6%
- Equity multiple
- 0.35×
- Total profit
- $-41,191
- Equity at exit
- $33,548
- IRR
- -10.7%
- Equity multiple
- 0.35×
- Total profit
- $-41,065
- Equity at exit
- $19,454
Cash invested: $63,000 (down + closing). Projections, not guarantees.
Landlord ↔ Tenant lean methodology
- Overall (STATE)
- 43 Moderately Tenant-Leaning
- State Illinois
- 43 Moderately Tenant-Leaning · D+7
- County
- — inherits STATE
- City
- — inherits STATE
ZIP-level market 60010
- Active inventory
- 246
- Price-to-rent
- 7.6×
Monthly cashflow live
- Estimated rent
- $2,456 high interval (Pro) →
- Mortgage (P&I)
- −$1,180
- Tax est. 1.5%
- −$281 /mo · $3,375/yr
- Insurance
- −$94
- HOA
- −$465
- Vacancy / Maint / Mgmt
- −$516
- Net cashflow
- $-79
Break-even live
Sensitivity live
| Price | -10% $76 | -5% $-2 | +0% $-79 | +5% $-157 | +10% $-235 |
|---|---|---|---|---|---|
| Rent | -10% $-273 | -5% $-176 | +0% $-79 | +5% $18 | +10% $115 |
| Rate | -1.0pp $34 | -0.5pp $-22 | base $-79 | +0.5pp $-138 | +1.0pp $-197 |
UW: 25.0% down · 7.5% · 30yr · 1.5% tax · 5.0% vac · 8.0% maint · 8.0% mgmt
Financing live
Cash to close
- Down payment
- $56,250
- Closing costs
- $6,750
- Reserves months
- —
- Total cash needed
- —
Loan-product check · same deal, 3 products live
Conventional
25% down · 7.5% · 30yr
- Down + closing
- —
- Monthly P&I
- —
- Monthly cashflow
- —
- DSCR
- —
- Eligible?
- —
Personal DTI + credit; lowest rate.
DSCR
20% down · 8.5% · 30yr
- Down + closing
- —
- Monthly P&I
- —
- Monthly cashflow
- —
- DSCR
- —
- Eligible?
- —
No personal income docs; deal must DSCR.
Hard money
10% down · 12.0% · 12mo
- Down + closing
- —
- Monthly P&I
- —
- Monthly cashflow
- —
- DSCR
- —
- Eligible?
- —
Short-term bridge; refi at stabilization.
Rent comps 16 comps
| Address | Beds | Baths | Sqft | Rent | $/sqft | DOM | Units | Dist |
|---|---|---|---|---|---|---|---|---|
| 530 Shorely Dr #104 Barrington, IL | 2.0 | 2.0 | 1100 | $2,300 | $2.09 | 45d | 1 | 0.02mi |
| 510 Shorely Dr #201 Barrington, IL | 2.0 | 2.0 | 1200 | $2,390 | $1.99 | 4d | 1 | 0.05mi |
| 510 Shorely Dr #201 Barrington, IL | 2.0 | 2.0 | 1200 | $2,490 | $2.08 | 12d | 1 | 0.05mi |
| 101 W Liberty St Barrington, IL | 1.0–2.0 | 1.0–2.0 | 991 | $3,250 | $3.28 | 0d | 16 | 0.30mi |
| 212 Franklin St Unit 2 Barrington, IL | 1.0 | 1.0 | 960 | $2,295 | $2.39 | 0d | 1 | 0.36mi |
| 212 Franklin St Barrington, IL | 1.0 | 1.0 | 960 | $2,295 | $2.39 | 26d | 1 | 0.36mi |
| 212 Franklin St Barrington, IL | 1.0 | 1.0 | 960 | $2,295 | $2.39 | 45d | 1 | 0.36mi |
| 100 E Station St #316 Barrington, IL | 2.0 | 2.0 | 1455 | $3,000 | $2.06 | 26d | 1 | 0.52mi |
| 320 W Main St Unit 2 Barrington, IL | 1.0 | 1.0 | 700 | $1,700 | $2.43 | 45d | 1 | 0.57mi |
| 528 E Main St Barrington, IL | 2.0 | 1.5 | 1200 | $2,200 | $1.83 | 22d | 1 | 0.58mi |
| 327 E Lake St Barrington, IL | 3.0 | 1.0 | 1000 | $2,350 | $2.35 | 12d | 1 | 0.61mi |
| 327 E Lake St Unit 327 Barrington, IL | 3.0 | 1.0 | 1000 | $2,350 | $2.35 | 7d | 1 | 0.63mi |
| 115 N Hager Ave Barrington, IL | 3.0 | 2.0 | 1473 | $3,400 | $2.31 | 45d | 1 | 0.66mi |
| 336 E Russell St Unit 2 Barrington, IL | 3.0 | 2.0 | 1475 | $2,700 | $1.83 | 7d | 1 | 0.72mi |
| 342 E Russell St Unit 2 Barrington, IL | 3.0 | 1.5 | 1400 | $2,400 | $1.71 | 26d | 1 | 0.73mi |
| 600 W Russell St #210 Barrington, IL | 2.0 | 1.5 | 1160 | $2,300 | $1.98 | 26d | 1 | 0.91mi |
HOA detail condo
- Monthly dues
- $465 · $5,580/yr
- Assessments
- None detected in remarks — confirm with the listing agent.
Listing history 12 events
-
2026-06-21days on market $225,000 Coming Soon 18 DOM
-
2026-06-18days on market $225,000 Coming Soon 15 DOM
-
2026-06-17days on market $225,000 Coming Soon 14 DOM
-
2026-06-16days on market $225,000 Coming Soon 13 DOM
-
2026-06-15days on market $225,000 Coming Soon 12 DOM
-
2026-06-13days on market $225,000 Coming Soon 10 DOM
-
2026-06-13days on market $225,000 Coming Soon 9 DOM
-
2026-06-09days on market $225,000 Coming Soon 6 DOM
-
2026-06-08days on market $225,000 Coming Soon 5 DOM
-
2026-06-07days on market $225,000 Coming Soon 4 DOM
-
2026-06-04remarks 699-char remark
-
2026-06-04$225,000 Coming Soon 1 DOM
ⓘ Source: listings_history table (triggers on properties + properties_extension) + one-shot
backfill from property_details.listing_events for pre-trigger history.
Nearby sold comps map
Loading sold comps map…
Walkable amenities ~0.75 mi
Loading nearby amenities…
Taxation est. · year 1
- Rental income
- $29,477
- − Mortgage interest
- −$12,603
- − Property taxes
- −$3,375
- − Insurance
- −$1,125
- − Repairs & maintenance
- −$2,358
- − Management
- −$2,358
- − HOA
- −$5,580
- − Depreciation
- −$6,545
- Taxable loss
- −$4,468
- Est. tax savings @ 24.0%
- +$1,072
- After-tax cash flow
- $120/yr
For passive investors: Depreciation is non-cash, so a rental often shows a tax loss while cash-flowing — sheltering income. Rental losses are passive: they offset passive income freely, and up to $25,000/yr can offset ordinary (W-2) income if you actively participate and your MAGI is under $100k (phasing out to $0 by $150k); unused losses carry forward. On sale, claimed depreciation is recaptured at up to 25%, and gains may owe capital-gains tax (a 1031 exchange can defer both). Figures are a year-1 estimate at your 24.0% rate — not tax advice; consult a CPA.
Schools (NCES district)
- District
- Barrington CUSD 220
- NCES district ID
- 1705050
- Math proficiency
- 46% ▼ -10.00%
- Reading proficiency
- 49% ▼ -11.00%
- Median HH income
- $114,016
- Composite
- 46.83/100
- National rank
- #2376
- State rank
- #42 of 620 in IL
Livability — Barrington
- Score
- 77/100
- State rank
- #156
- US rank
- #2854
Category grades
Schools grade is shown separately in the Schools card above.
Census & demographics
- Census place
- Barrington, IL
- County
- Lake County · 591,991 people
- City population
- 45,747
- Metro
- Chicago-Naperville-Elgin, IL-IN-WI
- Population (ZIP)
- 45,747
- Household income
- $177,566
- Rent vs Own
- Severe rent burden
- 553.0
Population outlook (Lake County) Hauer SSP2
- Today (2025)
- 700,217 people
- By 2030
- 693,290 · -1.0%
- By 2040
- 673,588 · -3.8%
- By 2050
- 643,556 · -8.1%
- By 2075
- 562,792 · -19.6%
- By 2100
- 457,715 · -34.6%
Race, ethnicity, and origin ACS 2023
- Neighborhood character
- Predominantly White (77%)
- Race & ethnicity
- White 77% Asian 14% Two or more races 5% Hispanic / Latino 4%
- Common ancestry
- Romanian 11% Slovak 2% Portuguese 2%
- Foreign-born
- 17% · South Korea, China, Canada
- Languages at home
- 79% English-only · Other Indo-European 5% Russian/Polish/Slavic 5% Other Asian/Pacific 3%
Political lean MEDSL · Lake
- 2024 margin
- Strong D (+20.8) · D 59.7% · R 38.9% · Other 1.4%
- 2008→2024 swing
- +1.1pp toward D · 2008: 19.6pp · 2024: 20.8pp
- All cycles
- 2024: D+20.8 2020: D+24.1 2016: D+20.3 2012: D+8.1 2008: D+19.6
Not yet ingested
- Civics
- —
Market trends
- HPI YoY
- ▼ -179.65%
- Current HPI
- 181.3706
- Rent YoY
- —
- Metro
- Chicago-Naperville-Elgin, IL-IN-WI
- State GDP YoY
- ▲ 1.59%
- F500 in state
- 60
Industry mix (Fortune 500 HQ in IL)
| Industry | F500 HQs | Revenue |
|---|---|---|
| Insurance | 4 | $201B |
|
||
| Consumer Goods | 4 | $87B |
|
||
| Industrial Machinery | 3 | $64B |
|
||
| Healthcare | 2 | $55B |
|
||
| Retail / Pharmacy | 1 | $148B |
|
||
| Agriculture / Food | 1 | $86B |
|
||
Cash-flow waterfall
monthlySold comps — $/sqft
last 12 mo · ≤1 miLoading sold comps…