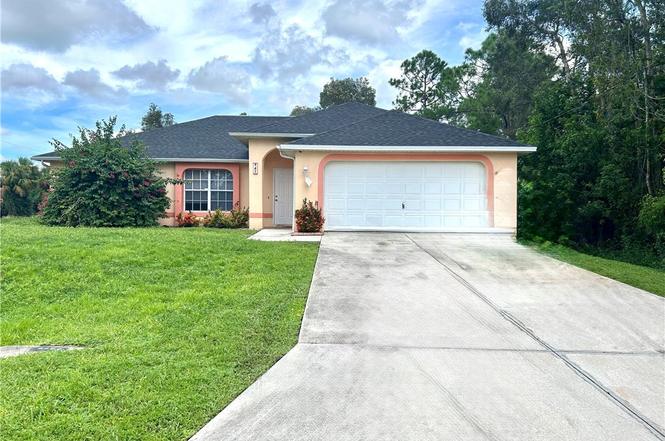
947 Hunter St E · Lehigh Acres, FL
Flood risk 1/10 · Minimal
- FEMA flood zone
- X (unshaded)
- Chance of flooding over 30 yrs
- 0.0%
- Est. flood insurance / yr
- $507 – $1,088
Fire risk 2/10 · Minimal
- Est. fire insurance / yr
- $947 – $1,759
Heat risk 9/10 · Severe
- Hot days now (above 109°F)
- 7 days/yr
- Hot days in 30 yrs
- 27 days/yr
Wind risk 10/10 · Severe
- Chance of severe wind over 30 yrs
- 99.0%
Air-quality risk 2/10 · Minimal
- Unhealthy air days now
- 1 days/yr
- Unhealthy air days in 30 yrs
- 2 days/yr
Risk factors via First Street. Map © Google.
Why this score? — see what drove the D grade
The composite is a weighted blend of 9 inputs, each scored 0–100. Each bar is that input's sub-score; the figure is the points it added to the 100-point composite (weight × sub-score).
- ARV discount +10.3/15.0
- Appreciation +10.0/10.0
- Cash flow +7.4/30.0
- Schools +4.1/10.0
- Livability +3.0/5.0
- Condition / age +2.5/5.0
- DSCR +1.6/10.0
- 1% rule +1.5/10.0
- Rent growth +1.3/5.0
$300,000
🖨 Deal sheet (PDF) 📄 Offer letter ✓ Due diligence
Listing remarks MLS
3/2/2 house located near to SR-82 and east lee high School, seller are very motivated!!!
Key facts
- New a/c unit
- Remodeled bathroom
- Corner-lot
Tags
Property features AI
Finance
- Financial info: Land lease expires 2025-10-31; Pets allowed
- HOA & community: No association fee
Exterior
- Parking: Attached 2-car garage; Driveway; Paved parking
- Utilities: Septic tank; No cable available
- Home design: Single-story; Resale property; Faces west; RS-1 zoning
- Construction: Brick, block, and concrete construction; Shingle roof; Built on standard foundation
- Exterior features: Corner lot; Public maintained road; East exposure; No additional exterior features listed
Interior
- Kitchen: Electric cooktop; Freezer; Refrigerator
- Bedrooms: Bedroom on main level; Great Room
- Flooring: Tile
- Bathrooms: 2 full bathrooms
- Heating & cooling: Central heating (electric); Central air conditioning (electric)
- Interior features: Double-hung windows; Kitchen island; Open living/dining area; Tub/shower; Walk-in closet(s); Unfurnished
- Laundry & utility: Washer and dryer (inside); Water softener
Neighborhood map
What this means for you Summary
Snapshot
- This is a 3-bed/2.0-bath single-family listed at $300k.
Deal economics
- At list price, monthly cash flow is $-382 ($-5k/yr) — negative.
- To cash-flow at today's rent, offer at most $232k (22.5% below list).
- To meet the 1% rule (rent ≥ 1% of price), the offer needs to be $196k (34.6% below list).
- Recommended offer: $196k (34.6% below list) — sets the bar for 1% rule.
Location & tenants
- Location reads 59/100 on livability (#826 in FL) — a working-class tenant base; expect higher turnover. Strengths: cost of living A+, housing A+; Watch: crime C-, employment D+, amenities F.
- Lee (suburban): math 47% / reading 50% proficiency, ranked #42 of 73 in FL (top 58%) — families likely to look elsewhere, expect single-tenant / working-renter base with shorter leases.
- Zoned schools: Veterans Park Academy For The Arts (math 41% / reading 45%, grade F, #1,366 of 2,144 statewide, top 64%, 2,133 students, 36% FRL); Oak Hammock Middle School (math 43% / reading 41%, grade D-, #340 of 571 statewide, top 61%, 1,563 students, 56% FRL); Lehigh Senior High School (math 23% / reading 45%, grade F, #394 of 667 statewide, top 60%, 2,476 students, 57% FRL).
- Market conditions: Rents falling (-4.7%/yr); 2476 active listings in the ZIP; 40 comparable units currently listed for rent nearby; rentals at typical pace (median 22d on market — plan ~3-4 weeks tenant-placement turnaround); 15,411 units permitted in Lee County in 2024 (4,686 in 5+ unit buildings).
- This rent runs 33% of the median local income ($72k/yr) — at the standard rent-burdened threshold; future hikes will face affordability resistance.
Forward outlook
- In year one you build about $32k of equity ($2k loan paydown + $30k appreciation (10.0% local appreciation)).
- Lee County population projected at +44% by 2050 — long-run rental-demand tailwind backs the buy-and-hold thesis.
- By year 2, paydown + projected appreciation supports a ~$52k cash-out refi (75% LTV) — recoverable capital for the next deal without selling this one.
Negotiation context
- It's been on market 261 days — a 12% lower offer ($264k) is reasonable based on typical stale-listing flexibility.
- 4 sale attempts since 24y ago with the ask held roughly flat each time — persistent listings suggest the price (not the market) is what's stuck; bring a comps-based counter.
Risks & watch-outs
- Climate carrying-cost: severe wind risk, 99% chance of damaging wind over 30y; extreme-heat days projected 7→27/yr by 2055 (HVAC capex compounding) — expect insurance premiums to compound above CPI over the hold.
Questions for the listing agent
- What do current leases actually rent for vs. the listed asking? Can we see a recent rent roll and the last 12 months of T-12 income?
- It's been on market 261 days. Have you received any prior offers? Is the seller open to a 35% concession, seller financing, or rate buy-down credit?
- Why hasn't it sold? Are there any deal-killer items the seller is aware of (foundation, flood, title, zoning, code violations)?
- Is there a deadline driving the sale (1031 exchange, divorce, estate, relocation)? That informs how much negotiation room exists.
- Schools are D-rated, which usually means shorter tenancies and higher turnover. Who's the typical renter profile here, and what's been the actual vacancy rate?
- The area grade is low — what's the realistic commute time and amenity access for the typical tenant pool here? Any planned neighborhood developments (good or bad) we should know about?
- What's the average days-on-market for RENTAL listings here right now (not sales)? A rising rental-DOM trend means longer vacancies and softer asking-rent achievability than the comps imply.
- What's the recent tenant-quality profile in this submarket — average credit score on applications, eviction rate, late-payment / NSF rate, and stable-employment percentage? A property-management company in the area should have these aggregated.
- How much new for-sale + rental construction is in the pipeline within 1–3 miles? Heavy new supply typically softens prices + rents 12–24 months out; constrained supply supports both.
Investment metrics
- 1% rule
- 0.65% ✗
- Cap rate
- 4.76%
- Cash-on-cash
- -5.46%
- DSCR
- 0.76
- GRM
- 12.7
CMA / ARV
- ARV (on-the-fly)
- $319,858
- Comps found
- 12
Show comp detail 12 sales within ~0.75 mi
| Address | Dist | Beds/Ba | Sqft | Sold | Price | $/sf | Match |
|---|---|---|---|---|---|---|---|
| 628 Locust Ave S | 0.46mi | 3/2.0 | 1,500 (+2%) | 3mo | $325,000 | $217 | 73 |
| 555 Mcarthur Blvd | 0.19mi | 3/2.0 | 1,401 (-5%) | 15mo | $265,000 | $189 | 70 |
| 823 Hoosier St E | 0.71mi | 3/2.0 | 1,478 (+0%) | 4mo | $325,000 | $220 | 63 |
| 925 Winters St E | 0.31mi | 3/2.0 | 1,270 (-14%) | 7mo | $280,000 | $220 | 56 |
| 853 Frederick Reid St E | 0.49mi | 3/2.0 | 1,630 (+11%) | 9mo | $339,900 | $209 | 52 |
| 1105 Milwaukee Blvd | 0.71mi | 3/2.0 | 1,593 (+8%) | 2mo | $500,000 | $314 | 52 |
| 821 Frederick Reid St E | 0.73mi | 3/2.0 | 1,614 (+10%) | 1mo | $315,000 | $195 | 49 |
| 819 Frederick Reid St E | 0.74mi | 3/2.0 | 1,601 (+9%) | 2mo | $299,000 | $187 | 49 |
| 718 Bedford Point Ave | 0.72mi | 4/3.0 (+1) | 1,580 (+7%) | 0mo | $314,900 | $199 | 45 |
| 507 Kilarney Ave S | 0.43mi | 3/2.0 | 1,640 (+11%) | 22mo | $370,000 | $226 | 43 |
| 1105 Artic St E | 0.72mi | 4/2.0 (+1) | 1,638 (+11%) | 5mo | $319,900 | $195 | 38 |
| 944 Dobbins St E | 0.71mi | 3/2.0 | 1,327 (-10%) | 23mo | $315,000 | $237 | 31 |
Match score weights: distance 35% · size 25% · config 20% · recency 20%. Top-matched comps best support the ARV.
Projected returns pro-forma
10.0% appreciation · 0.0% rent growth · sell at horizon
- IRR
- 19.7%
- Equity multiple
- 2.59×
- Total profit
- $133,236
- Equity at exit
- $270,264
- IRR
- 17.5%
- Equity multiple
- 5.77×
- Total profit
- $401,092
- Equity at exit
- $582,834
Cash invested: $84,000 (down + closing). Projections, not guarantees.
Landlord ↔ Tenant lean methodology
- Overall (STATE)
- 87 Strongly Landlord-Friendly
- State Florida
- 87 Strongly Landlord-Friendly · R+3
- County
- — inherits STATE
- City
- — inherits STATE
ZIP-level market 33974
- Home prices YoY
- 5.8%
- Rents YoY
- -4.7%
- Active inventory
- 2476
- Price-to-rent
- 12.7×
Monthly cashflow live
- Estimated rent
- $1,962 high interval (Pro) →
- Mortgage (P&I)
- −$1,573
- Tax from tax record
- −$234 /mo · $2,811/yr
- Insurance
- −$125
- HOA
- −$0
- Vacancy / Maint / Mgmt
- −$412
- Net cashflow
- $-382
Break-even live
Sensitivity live
| Price | -10% $-212 | -5% $-297 | +0% $-382 | +5% $-467 | +10% $-552 |
|---|---|---|---|---|---|
| Rent | -10% $-537 | -5% $-460 | +0% $-382 | +5% $-305 | +10% $-227 |
| Rate | -1.0pp $-231 | -0.5pp $-306 | base $-382 | +0.5pp $-460 | +1.0pp $-539 |
UW: 25.0% down · 7.5% · 30yr · 1.5% tax · 5.0% vac · 8.0% maint · 8.0% mgmt
Financing live
Cash to close
- Down payment
- $75,000
- Closing costs
- $9,000
- Reserves months
- —
- Total cash needed
- —
Loan-product check · same deal, 3 products live
Conventional
25% down · 7.5% · 30yr
- Down + closing
- —
- Monthly P&I
- —
- Monthly cashflow
- —
- DSCR
- —
- Eligible?
- —
Personal DTI + credit; lowest rate.
DSCR
20% down · 8.5% · 30yr
- Down + closing
- —
- Monthly P&I
- —
- Monthly cashflow
- —
- DSCR
- —
- Eligible?
- —
No personal income docs; deal must DSCR.
Hard money
10% down · 12.0% · 12mo
- Down + closing
- —
- Monthly P&I
- —
- Monthly cashflow
- —
- DSCR
- —
- Eligible?
- —
Short-term bridge; refi at stabilization.
Rent comps 40 comps
| Address | Beds | Baths | Sqft | Rent | $/sqft | DOM | Units | Dist |
|---|---|---|---|---|---|---|---|---|
| 954 Pilgrim St E Lehigh Acres, FL | 3.0 | 2.0 | 1246 | $1,625 | $1.30 | 4d | 1 | 0.04mi |
| 928 Milwaukee Blvd Lehigh Acres, FL | 4.0 | 2.0 | 1719 | $1,990 | $1.16 | 25d | 1 | 0.19mi |
| 538 Flamingo Ave S Lehigh Acres, FL | 3.0 | 2.0 | 1272 | $1,791 | $1.41 | 5d | 1 | 0.26mi |
| 538 Cypress Ave S Lehigh Acres, FL | 3.0 | 2.0 | 1055 | $1,699 | $1.61 | 5d | 1 | 0.34mi |
| 908 Winters St E Lehigh Acres, FL | 3.0 | 2.0 | 1639 | $2,200 | $1.34 | 12d | 1 | 0.39mi |
| 940 Sterling St E Lehigh Acres, FL | 4.0 | 2.0 | 1389 | $1,750 | $1.26 | 5d | 1 | 0.41mi |
| 541 Hawthorne Ave S Lehigh Acres, FL | 3.0 | 2.0 | 1634 | $1,921 | $1.18 | 5d | 1 | 0.41mi |
| 886 Milwaukee Blvd Lehigh Acres, FL | 3.0 | 2.0 | 1205 | $1,900 | $1.58 | 25d | 1 | 0.44mi |
| 635 Hawthorne Ave S Lehigh Acres, FL | 3.0 | 2.0 | 1029 | $1,300 | $1.26 | 25d | 1 | 0.47mi |
| 635 Hawthorne Ave S Lehigh Acres, FL | 3.0 | 2.0 | 1029 | $1,300 | $1.26 | 23d | 1 | 0.47mi |
| 970 Lakeside Dr Lehigh Acres, FL | 3.0 | 2.0 | 1325 | $1,800 | $1.36 | 21d | 1 | 0.52mi |
| 874 Apartment St Lehigh Acres, FL | 3.0 | 2.0 | 1200 | $1,750 | $1.46 | 25d | 1 | 0.56mi |
| 862 Charles Sise St E Lehigh Acres, FL | 3.0 | 2.0 | 1582 | $2,664 | $1.68 | 25d | 1 | 0.66mi |
| 556 Sherwood Ave S Lehigh Acres, FL | 3.0 | 2.0 | 1582 | $2,175 | $1.37 | 25d | 1 | 0.68mi |
| 1018 Kent St E Lehigh Acres, FL | 3.0 | 2.0 | 1600 | $2,000 | $1.25 | 18d | 1 | 0.72mi |
| 459 Lockport Ave S Lehigh Acres, FL | 3.0 | 2.0 | 1650 | $2,000 | $1.21 | 25d | 1 | 0.76mi |
| 730 Holmes Ave Unit 728 Lehigh Acres, FL | 3.0 | 2.0 | 1080 | $1,500 | $1.39 | 13d | 1 | 0.76mi |
| 708 Godwid Ave S Lehigh Acres, FL | 3.0 | 2.0 | 1758 | $2,150 | $1.22 | 23d | 1 | 0.83mi |
| 710 Godwid Ave S Lehigh Acres, FL | 3.0 | 2.0 | 1758 | $2,150 | $1.22 | 5d | 1 | 0.85mi |
| 710 Godwid Ave S Lehigh Acres, FL | 3.0 | 2.0 | 1758 | $2,150 | $1.22 | 23d | 1 | 0.85mi |
| 710 Godwid Ave S Lehigh Acres, FL | 3.0 | 2.0 | 1758 | $2,150 | $1.22 | 5d | 1 | 0.85mi |
| 604 Thomas Sherwin Ave S Lehigh Acres, FL | 4.0 | 2.0 | 1493 | $2,200 | $1.47 | 5d | 1 | 0.87mi |
| 684 Thomas Sherwin Ave S Lehigh Acres, FL | 3.0 | 2.0 | 1288 | $1,695 | $1.32 | 5d | 1 | 0.88mi |
| 708 Genoa Ave S Lehigh Acres, FL | 3.0 | 2.0 | 1055 | $1,650 | $1.56 | 5d | 1 | 0.90mi |
| 756 Holmes Ave Lehigh Acres, FL | 3.0 | 2.0 | 1100 | $1,450 | $1.32 | 12d | 1 | 0.90mi |
| 947 Grant Blvd Lehigh Acres, FL | 4.0 | 2.0 | 1650 | $2,145 | $1.30 | 25d | 1 | 0.92mi |
| 573 Bell Blvd S Lehigh Acres, FL | 3.0 | 2.0 | 1218 | $1,900 | $1.56 | 16d | 1 | 0.94mi |
| 382 McArthur Blvd Lehigh Acres, FL | 3.0 | 2.0 | 1055 | $2,200 | $2.09 | 25d | 1 | 0.94mi |
| 442 Genoa Ave S Lehigh Acres, FL | 4.0 | 2.0 | 1365 | $1,750 | $1.28 | 5d | 1 | 0.95mi |
| 761 Kirkman Ave S Lehigh Acres, FL | 3.0 | 2.0 | 1188 | $1,900 | $1.60 | 25d | 1 | 0.95mi |
| 1144 Essex St E Lehigh Acres, FL | 3.0 | 2.0 | 1464 | $1,650 | $1.13 | 21d | 1 | 0.99mi |
| 930 Ainsworth St W Lehigh Acres, FL | 3.0 | 2.0 | 1165 | $1,395 | $1.20 | 18d | 1 | 1.09mi |
| 508 Bell Blvd S Lehigh Acres, FL | 3.0 | 2.0 | 1200 | $1,800 | $1.50 | 25d | 1 | 1.11mi |
| 762 Gallo Ave S #764 Lehigh Acres, FL | 3.0 | 2.0 | 1127 | $1,195 | $1.06 | 23d | 1 | 1.13mi |
| 1147 Antonio St E Lehigh Acres, FL | 3.0 | 2.0 | 1713 | $2,300 | $1.34 | 3d | 1 | 1.16mi |
| 927 Chenault St Lehigh Acres, FL | 3.0 | 2.0 | 1132 | $1,700 | $1.50 | 25d | 1 | 1.18mi |
| 925 Chenault St Lehigh Acres, FL | 3.0 | 2.0 | 1132 | $1,700 | $1.50 | 25d | 1 | 1.18mi |
| 459 Lackey Ave S Lehigh Acres, FL | 4.0 | 2.0 | 1833 | $1,825 | $1.00 | 4d | 1 | 1.18mi |
| 637 Montclair Ave S Lehigh Acres, FL | 3.0 | 2.0 | 1497 | $1,660 | $1.11 | 25d | 1 | 1.19mi |
| 907 Chenault St Lehigh Acres, FL | 2.0 | 4.0 | 1200 | $1,250 | $1.04 | 16d | 1 | 1.20mi |
Listing history 20 events
-
2026-06-22days on market $300,000 Active 261 DOM
-
2026-06-17days on market $300,000 Active 257 DOM
-
2026-06-16days on market $300,000 Active 256 DOM
-
2026-06-16days on market $300,000 Active 255 DOM
-
2026-06-13days on market $300,000 Active 253 DOM
-
2026-06-09days on market $300,000 Active 249 DOM
-
2026-06-07days on market $300,000 Active 247 DOM
-
2026-06-02days on market $300,000 Active 242 DOM
-
2026-06-01days on market $300,000 Active 241 DOM
-
2026-06-01days on market $300,000 Active 240 DOM
-
2025-10-01$300,000 Active
-
2023-02-24historical 88-char remark
Show marketing remark (88 chars)
3/2/2 house located near to SR-82 and east lee high School, seller are very motivated!!!
-
2023-02-24soldstatus $290,000 Closed 88-char remark
Show marketing remark (88 chars)
3/2/2 house located near to SR-82 and east lee high School, seller are very motivated!!!
-
2023-01-09status Pending 88-char remark
Show marketing remark (88 chars)
3/2/2 house located near to SR-82 and east lee high School, seller are very motivated!!!
-
2022-12-26price $285,000 88-char remark
Show marketing remark (88 chars)
3/2/2 house located near to SR-82 and east lee high School, seller are very motivated!!!
-
2022-10-19$310,000 Active 88-char remark
Show marketing remark (88 chars)
3/2/2 house located near to SR-82 and east lee high School, seller are very motivated!!!
-
2019-03-15soldstatus $155,000 Sold 192-char remark
Show marketing remark (192 chars)
This is a very nice home with 3 bedrooms 2 baths, also a screened lanai and 2 car garage. Corner lot with privacy. Quiet, peaceful neighborhood. Conveniently located to SR82, and shopping etc.
-
2019-02-07status Pending 192-char remark
Show marketing remark (192 chars)
This is a very nice home with 3 bedrooms 2 baths, also a screened lanai and 2 car garage. Corner lot with privacy. Quiet, peaceful neighborhood. Conveniently located to SR82, and shopping etc.
-
2019-02-01$155,900 Active 192-char remark
Show marketing remark (192 chars)
This is a very nice home with 3 bedrooms 2 baths, also a screened lanai and 2 car garage. Corner lot with privacy. Quiet, peaceful neighborhood. Conveniently located to SR82, and shopping etc.
-
2002-12-02$9,999
ⓘ Source: listings_history table (triggers on properties + properties_extension) + one-shot
backfill from property_details.listing_events for pre-trigger history.
Tax reassessment forecast FL · Resets to sale price
- Current annual tax
- $2,811 · $234/mo
- Projected year-2 tax
- $2,811 · $234/mo
- Expected delta
- $0/yr ($0/mo · 0.0%)
ⓘ Screening estimate from a state-policy table — verify with the county assessor before closing.
Climate risk First Street
- Flood 1/10 Low FEMA zone X (unshaded) · 0% chance over 30 yrs
- Wildfire 2/10 Low
- Heat 9/10 Extreme 7 d/yr ≥109°F today · 27 d/yr by 30 yrs out
- Wind 10/10 Extreme 99% chance of damaging wind over 30 yrs
- Air quality 2/10 Low 1 unhealthy d/yr today · 2 by 30 yrs out
Nearby sold comps map
Loading sold comps map…
Walkable amenities ~0.75 mi
Loading nearby amenities…
Taxation est. · year 1
- Rental income
- $23,548
- − Mortgage interest
- −$16,805
- − Property taxes
- −$2,811
- − Insurance
- −$1,500
- − Repairs & maintenance
- −$1,884
- − Management
- −$1,884
- − Depreciation
- −$8,727
- Taxable loss
- −$10,062
- Est. tax savings @ 24.0%
- +$2,415
- After-tax cash flow
- $-2,172/yr
For passive investors: Depreciation is non-cash, so a rental often shows a tax loss while cash-flowing — sheltering income. Rental losses are passive: they offset passive income freely, and up to $25,000/yr can offset ordinary (W-2) income if you actively participate and your MAGI is under $100k (phasing out to $0 by $150k); unused losses carry forward. On sale, claimed depreciation is recaptured at up to 25%, and gains may owe capital-gains tax (a 1031 exchange can defer both). Figures are a year-1 estimate at your 24.0% rate — not tax advice; consult a CPA.
Schools (NCES district)
- District
- Lee
- NCES district ID
- 1201080
- Math proficiency
- 47% ▼ -11.00%
- Reading proficiency
- 50% ▼ -4.00%
- Median HH income
- $49,518
- Composite
- 41.49/100
- National rank
- #3458
- State rank
- #42 of 73 in FL
Livability — Lehigh Acres
- Score
- 59/100
- State rank
- #826
- US rank
- #20055
Category grades
Schools grade is shown separately in the Schools card above.
Census & demographics
- Census place
- Lehigh Acres, FL
- County
- Lee County · 788,662 people
- City population
- 130,638
- Metro
- Cape Coral-Fort Myers, FL
- Population (ZIP)
- 19,927
- Household income
- $72,192
- Rent vs Own
- Severe rent burden
- 434.0
Population outlook (Lee County) Hauer SSP2
- Today (2025)
- 871,946 people
- By 2030
- 955,468 · +9.6%
- By 2040
- 1,113,587 · +27.7%
- By 2050
- 1,256,891 · +44.1%
- By 2075
- 1,560,270 · +78.9%
- By 2100
- 1,726,848 · +98.0%
Race, ethnicity, and origin ACS 2023
- Neighborhood character
- Diverse neighborhood (Simpson 0.64)
- Race & ethnicity
- Hispanic / Latino 52% Two or more races 31% White 26% Black 18%
- Hispanic origin (detail)
- Mexican 12% Puerto Rican 7% Cuban 20% Dominican 4%
- Common ancestry
- Hispanic 7% Italian 1% Portuguese 1%
- Foreign-born
- 32% · Canada, Jamaica
- Languages at home
- 48% English-only · Spanish 43% French/Haitian/Cajun 7% Other Indo-European 1%
Political lean MEDSL · Lee
- 2024 margin
- Strong R (+28.4) · D 35.5% · R 63.9%
- 2008→2024 swing
- -18.0pp toward R · 2008: -10.4pp · 2024: -28.4pp
- All cycles
- 2024: R+28.4 2020: R+19.2 2016: R+20.4 2012: R+16.6 2008: R+10.4
Not yet ingested
- Civics
- —
Market trends
- HPI YoY
- ▲ 16.53%
- Current HPI
- 303.3399
- Rent YoY
- ▼ -4.68%
- Metro
- Cape Coral-Fort Myers, FL
- State GDP YoY
- ▲ 3.28%
- F500 in state
- 36
Industry mix (Fortune 500 HQ in FL)
| Industry | F500 HQs | Revenue |
|---|---|---|
| Industrial Technology | 2 | $29B |
|
||
| Insurance | 2 | $17B |
|
||
| Retail | 1 | $60B |
|
||
| Technology Distribution | 1 | $58B |
|
||
| Homebuilding | 1 | $35B |
|
||
| Technology Manufacturing | 1 | $35B |
|
||
Price history
+2900.3% since first listed10 events — show timeline
- 2025-10-01 Listed $300,000 FORTMLS
- 2023-02-24 Listing Removed — FORTMLS
- 2023-02-24 Sold (MLS) $290,000 FORTMLS
- 2023-01-09 Pending — FORTMLS
- 2022-12-26 Price Changed $285,000 FORTMLS
- 2022-10-19 Listed $310,000 FORTMLS
- 2019-03-15 Sold (MLS) $155,000 FORTMLS
- 2019-02-07 Pending — FORTMLS
- 2019-02-01 Listed $155,900 FORTMLS
- 2002-12-02 Listed $9,999 FORTMLS
Property tax history
+9.6%/yrLatest (2022): $2,811 · +17.6% YoY. Source: county tax records.
Cash-flow waterfall
monthlySold comps — $/sqft
last 12 mo · ≤1 miLoading sold comps…