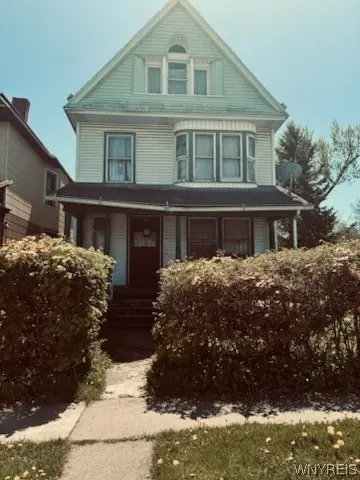
95 Northland Ave · Buffalo, NY
Flood risk 1/10 · Minimal
- FEMA flood zone
- X (unshaded)
- Chance of flooding over 30 yrs
- 0.0%
- Est. flood insurance / yr
- $473 – $860
Fire risk 1/10 · Minimal
- Est. fire insurance / yr
- $691 – $1,283
Heat risk 3/10 · Minor
- Hot days now (above 91°F)
- 7 days/yr
- Hot days in 30 yrs
- 15 days/yr
Wind risk 1/10 · Minimal
- Chance of severe wind over 30 yrs
- —
Air-quality risk 4/10 · Minor
- Unhealthy air days now
- 4 days/yr
- Unhealthy air days in 30 yrs
- 9 days/yr
Risk factors via First Street. Map © Google.
Why this score? — see what drove the B- grade
The composite is a weighted blend of 9 inputs, each scored 0–100. Each bar is that input's sub-score; the figure is the points it added to the 100-point composite (weight × sub-score).
- Cash flow +30.0/30.0
- 1% rule +10.0/10.0
- DSCR +10.0/10.0
- ARV discount +7.5/15.0
- Livability +3.9/5.0
- Schools +3.3/10.0
- Rent growth +2.5/5.0
- Condition / age +2.5/5.0
- Appreciation +0.0/10.0
$90,500
🖨 Deal sheet 📄 Offer letter ✓ Due diligence
Listing remarks
Great investment property. Needs some TLC. Sold "as is".
Key facts
- 2,100 sq ft lot
- Built 1900
- Listed 22 days
Property features AI
Exterior
- Parking: No garage; No driveway
- Utilities: Public water (connected); Sewer connected
- Home design: 2-story existing residence
- Construction: Aluminum and vinyl siding; Stone foundation
- Exterior features: Rectangular residential lot; City street frontage; Lot dimensions approximately 30 x 70
Interior
- Kitchen: Eat-in kitchen
- Bedrooms: One bedroom on the main level
- Flooring: Hardwood; Varies
- Bathrooms: One full bathroom (main level)
- Heating & cooling: Gas forced-air heating
- Interior features: Eat-in kitchen; Natural woodwork; Varies hardwood flooring; Has full basement
- Laundry & utility: Gas water heater
Neighborhood map
What this means for you Summary
Snapshot
- This is a 3-bed/1.0-bath single-family listed at $90k.
Deal economics
- At list price, monthly cash flow is $1k ($13k/yr) — positive.
- The deal already cash-flows at list — no discount required.
- Meets the 1% rule at list price ($2k rent vs $90k).
- Recommended offer: $89k (1.5% below list) — sets the bar for market timing.
- Cap rate 20.8% vs local median 8.0% in Buffalo — top-decile yield for the area; either an underpriced asset or a hidden risk that comps aren't pricing in. Stress-test before assuming the spread holds.
Location & tenants
- Location reads 77/100 on livability (#195 in NY, #3,011 nationally) — a middle-class / working-renter tenant base. Strengths: commute A+, housing A+, health & safety A+; Watch: crime F, employment D-.
- Buffalo City School District (urban): math 41% / reading 40% proficiency, ranked #535 of 590 in NY (top 91%) — families likely to look elsewhere, expect single-tenant / working-renter base with shorter leases; 75% free/reduced lunch — lower-income household profile, screen leases tightly.
- Market conditions: 54 active listings in the ZIP; 19 comparable units currently listed for rent nearby; rentals at typical pace (median 24d on market — plan ~3-4 weeks tenant-placement turnaround); 1,244 units permitted in Erie County in 2024 (563 in 5+ unit buildings).
- At $2,065/mo this rent would consume 51% of the median local household income ($48k/yr) (locally 723% of renters already pay >50% of income on rent) — very limited rent-growth headroom before tenants either downsize or default.
Forward outlook
- Local home prices are declining (-3.0%/yr); year-one equity from $626 of loan paydown is wiped out by about $3k of value loss. Plan a longer hold.
- At projected returns (-3.0% appreciation + 3.0% rent growth), your $25k cash investment doubles in ~3 years — after that, you're playing with house money.
Negotiation context
- It's been on market 22 days — a 2% lower offer ($89k) is reasonable based on typical stale-listing flexibility.
Risks & watch-outs
- Watch-outs: built in 1900 — expect roof / HVAC / electrical / plumbing capex.
Questions for the listing agent
- Built in 1900 — when were the roof, HVAC, electrical panel, plumbing, and water heater last replaced?
- Is there a deadline driving the sale (1031 exchange, divorce, estate, relocation)? That informs how much negotiation room exists.
- Crime grade is F in this area — have there been break-ins, vandalism, or insurance claims at this property in the last 3 years? What carrier currently insures it and at what premium?
- What's the average days-on-market for RENTAL listings here right now (not sales)? A rising rental-DOM trend means longer vacancies and softer asking-rent achievability than the comps imply.
- What's the recent tenant-quality profile in this submarket — average credit score on applications, eviction rate, late-payment / NSF rate, and stable-employment percentage? A property-management company in the area should have these aggregated.
- How much new for-sale + rental construction is in the pipeline within 1–3 miles? Heavy new supply typically softens prices + rents 12–24 months out; constrained supply supports both.
Investment metrics
- 1% rule
- 2.28% ✓
- Cap rate
- 20.76%
- Cash-on-cash
- 51.66%
- DSCR
- 3.30
- GRM
- 3.7
CMA / ARV
- ARV (on-the-fly)
- $266,392
- Comps found
- 12
Show comp detail 12 sales within ~0.75 mi
| Address | Dist | Beds/Ba | Sqft | Sold | Price | $/sf | Match |
|---|---|---|---|---|---|---|---|
| 41 Brunswick Blvd Blvd | 0.26mi | 3/2.0 | 2,054 (+3%) | 13mo | $260,000 | $127 | 67 |
| 42 Lancaster Ave | 0.67mi | 4/2.5 (+1) | 1,979 (-0%) | 3mo | $448,750 | $227 | 54 |
| 1366 Michigan Ave Ave | 0.68mi | 4/2.0 (+1) | 2,093 (+5%) | 0mo | $145,000 | $69 | 50 |
| 141 Loring Ave | 0.57mi | 4/2.0 (+1) | 2,134 (+7%) | 4mo | $255,000 | $119 | 48 |
| 164 Harvard Pl | 0.36mi | 3/2.5 | 1,700 (-14%) | 8mo | $344,000 | $202 | 46 |
| 175 Oxford Ave | 0.37mi | 3/2.5 | 2,258 (+14%) | 10mo | $434,000 | $192 | 46 |
| 88 Donaldson Rd | 0.39mi | 3/1.5 | 1,699 (-14%) | 13mo | $217,000 | $128 | 45 |
| 19 Saint James Pl | 0.70mi | 3/1.5 | 2,130 (+7%) | 11mo | $500,000 | $235 | 44 |
| 76 Lancaster Ave | 0.74mi | 4/2.5 (+1) | 2,115 (+6%) | 5mo | $283,000 | $134 | 40 |
| 466 Northland Ave | 0.72mi | 3/1.0 | 1,814 (-9%) | 19mo | $200,000 | $110 | 36 |
| 196 Hughes Ave | 0.60mi | 4/2.0 (+1) | 1,808 (-9%) | 17mo | $240,000 | $133 | 33 |
| 825 Auburn Ave | 0.69mi | 4/2.5 (+1) | 2,236 (+12%) | 3mo | $575,000 | $257 | 33 |
Match score weights: distance 35% · size 25% · config 20% · recency 20%. Top-matched comps best support the ARV.
Projected returns pro-forma
-3.0% appreciation · 3.0% rent growth · sell at horizon
- IRR
- 49.5%
- Equity multiple
- 3.16×
- Total profit
- $54,797
- Equity at exit
- $13,494
- IRR
- 55.0%
- Equity multiple
- 6.41×
- Total profit
- $137,102
- Equity at exit
- $7,825
Cash invested: $25,340 (down + closing). Projections, not guarantees.
Landlord ↔ Tenant lean methodology
- Overall (STATE)
- 15 Strongly Tenant-Friendly
- State New York
- 15 Strongly Tenant-Friendly · D+10
- County
- — inherits STATE
- City
- — inherits STATE
ZIP-level market 14208
- Home prices YoY
- -3.4%
- Active inventory
- 54
- Price-to-rent
- 3.7×
Monthly cashflow live
- Estimated rent
- $2,065 high interval (Pro) →
- Mortgage (P&I)
- −$475
- Tax from tax record
- −$28 /mo · $340/yr
- Insurance
- −$38
- HOA
- −$0
- Vacancy / Maint / Mgmt
- −$434
- Net cashflow
- $1,091
Break-even live
UW: 25.0% down · 7.5% · 30yr · 1.5% tax · 5.0% vac · 8.0% maint · 8.0% mgmt
Financing live
Cash to close
- Down payment
- $22,625
- Closing costs
- $2,715
- Reserves months
- —
- Total cash needed
- —
Loan-product check · same deal, 3 products live
Conventional
25% down · 7.5% · 30yr
- Down + closing
- —
- Monthly P&I
- —
- Monthly cashflow
- —
- DSCR
- —
- Eligible?
- —
Personal DTI + credit; lowest rate.
DSCR
20% down · 8.5% · 30yr
- Down + closing
- —
- Monthly P&I
- —
- Monthly cashflow
- —
- DSCR
- —
- Eligible?
- —
No personal income docs; deal must DSCR.
Hard money
10% down · 12.0% · 12mo
- Down + closing
- —
- Monthly P&I
- —
- Monthly cashflow
- —
- DSCR
- —
- Eligible?
- —
Short-term bridge; refi at stabilization.
Rent comps 19 comps
| Address | Beds | Baths | Sqft | Rent | $/sqft | DOM | Units | Dist |
|---|---|---|---|---|---|---|---|---|
| 102 Florida St Buffalo, NY | 3.0 | 1.0 | 1296 | $1,650 | $1.27 | 43d | 1 | 0.11mi |
| 1786 Main St Unit 104 Buffalo, NY | 2.0 | 2.0 | 1256 | $1,875 | $1.49 | 43d | 1 | 0.21mi |
| 184 Butler Ave Unit 1545840P Buffalo, NY | 4.0 | 1.0 | 1496 | $3,226 | $2.16 | 14d | 1 | 0.57mi |
| 563 Humboldt Pkwy Buffalo, NY | 3.0 | 1.0 | 2004 | $1,200 | $0.60 | 23d | 1 | 0.61mi |
| 121 Humboldt Pkwy Unit B Buffalo, NY | 2.0 | 1.0 | 1265 | $1,750 | $1.38 | 43d | 1 | 0.68mi |
| 73 Inter Park Ave Buffalo, NY | 3.0 | 1.0 | 2080 | $1,300 | $0.62 | 14d | 1 | 0.83mi |
| 740 Elmwood Ave Buffalo, NY | 3.0 | 1.0 | 2000 | $1,995 | $1.00 | 14d | 1 | 1.09mi |
| 888 Delaware Ave Buffalo, NY | 2.0 | 1.0–2.0 | 899 | $2,440 | $2.71 | 23d | 1 | 1.12mi |
| 569 Elmwood Ave Buffalo, NY | 2.0 | 1.0 | 1500 | $1,750 | $1.17 | 11d | 1 | 1.15mi |
| 552 Potomac Ave Buffalo, NY | 2.0 | 1.0 | 2500 | $2,200 | $0.88 | 43d | 1 | 1.22mi |
| 451 Elmwood Ave Buffalo, NY | 2.0 | 1.0 | 1633 | $3,305 | $2.02 | 43d | 1 | 1.24mi |
| 19 North St Buffalo, NY | 2.0 | 1.0–2.0 | 1306 | $2,910 | $2.23 | 10d | 7 | 1.34mi |
| 217 Norwood Ave Apt 1 Buffalo, NY | 2.0 | 1.0 | 1500 | $2,700 | $1.80 | 43d | 1 | 1.34mi |
| 836 Richmond Ave Buffalo, NY | 4.0 | 3.5 | 1982 | $4,500 | $2.27 | 43d | 1 | 1.37mi |
| 330 Bryant St Buffalo, NY | 3.0 | 2.0 | 2224 | $2,200 | $0.99 | 19d | 1 | 1.37mi |
| 118 Ashland Ave Buffalo, NY | 3.0 | 1.0 | 1326 | $1,850 | $1.40 | 14d | 1 | 1.39mi |
| 202 Summit Ave Unit 1 Buffalo, NY | 3.0 | 1.0 | 2000 | $2,400 | $1.20 | 23d | 1 | 1.44mi |
| 40 Putnam St Buffalo, NY | 4.0 | 1.0 | 1600 | $2,100 | $1.31 | 23d | 1 | 1.46mi |
| 83 Baynes St Unit Lower Buffalo, NY | 3.0 | 1.0 | 2550 | $1,850 | $0.73 | 14d | 1 | 1.50mi |
Listing history 15 events
-
2026-06-18days on market $90,500 Active 22 DOM
-
2026-06-17days on market $90,500 Active 21 DOM
-
2026-06-16days on market $90,500 Active 20 DOM
-
2026-06-15days on market $90,500 Active 19 DOM
-
2026-06-13days on market $90,500 Active 17 DOM
-
2026-06-13days on market $90,500 Active 16 DOM
-
2026-06-10days on market $90,500 Active 14 DOM
-
2026-06-09days on market $90,500 Active 13 DOM
-
2026-06-08days on market $90,500 Active 12 DOM
-
2026-06-07days on market $90,500 Active 11 DOM
-
2026-06-03days on market $90,500 Active 7 DOM
-
2026-06-02days on market $90,500 Active 6 DOM
-
2026-06-01days on market $90,500 Active 5 DOM
-
2026-05-31days on market $90,500 Active 4 DOM
-
2026-05-27$90,500 Active
ⓘ Source: listings_history table (triggers on properties + properties_extension) + one-shot
backfill from property_details.listing_events for pre-trigger history.
Tax reassessment forecast NY · Partial reset (capped growth)
- Current annual tax
- $340 · $28/mo
- Projected year-2 tax
- $935 · $78/mo
- Expected delta
- +$595/yr (+$50/mo · 174.8%)
ⓘ Screening estimate from a state-policy table — verify with the county assessor before closing.
Climate risk First Street
- Flood 1/10 Low FEMA zone X (unshaded) · 0% chance over 30 yrs
- Wildfire 1/10 Low
- Heat 3/10 Moderate 7 d/yr ≥91°F today · 15 d/yr by 30 yrs out
- Wind 1/10 Low
- Air quality 4/10 Moderate 4 unhealthy d/yr today · 9 by 30 yrs out
Nearby sold comps map
Loading sold comps map…
Walkable amenities ~0.75 mi
Loading nearby amenities…
Taxation est. · year 1
- Rental income
- $24,784
- − Mortgage interest
- −$5,069
- − Property taxes
- −$340
- − Insurance
- −$452
- − Repairs & maintenance
- −$1,983
- − Management
- −$1,983
- − Depreciation
- −$2,633
- Taxable income
- $12,324
- Est. tax owed @ 24.0%
- −$2,958
- After-tax cash flow
- $10,134/yr
For passive investors: Depreciation is non-cash, so a rental often shows a tax loss while cash-flowing — sheltering income. Rental losses are passive: they offset passive income freely, and up to $25,000/yr can offset ordinary (W-2) income if you actively participate and your MAGI is under $100k (phasing out to $0 by $150k); unused losses carry forward. On sale, claimed depreciation is recaptured at up to 25%, and gains may owe capital-gains tax (a 1031 exchange can defer both). Figures are a year-1 estimate at your 24.0% rate — not tax advice; consult a CPA.
Schools (NCES district)
- District
- Buffalo City School District
- NCES district ID
- 3605850
- Math proficiency
- 41% ▲ 11.00%
- Reading proficiency
- 40% ▲ 7.00%
- Median HH income
- $31,665
- Composite
- 33.17/100
- National rank
- #5544
- State rank
- #535 of 590 in NY
Livability — Buffalo
- Score
- 77/100
- State rank
- #195
- US rank
- #3011
Category grades
Schools grade is shown separately in the Schools card above.
Census & demographics
- Census place
- Buffalo, NY
- County
- Erie County · 714,559 people
- City population
- 440,021
- Metro
- Buffalo-Cheektowaga, NY
- Population (ZIP)
- 12,572
- Household income
- $48,476
- Rent vs Own
- Severe rent burden
- 723.0
Population outlook (Erie County) Hauer SSP2
- Today (2025)
- 933,037 people
- By 2030
- 935,181 · +0.2%
- By 2040
- 928,531 · -0.5%
- By 2050
- 905,725 · -2.9%
- By 2075
- 834,037 · -10.6%
- By 2100
- 708,033 · -24.1%
Race, ethnicity, and origin ACS 2023
- Neighborhood character
- Predominantly Black (72%)
- Race & ethnicity
- Black 72% White 15% Asian 6% Two or more races 4% Hispanic / Latino 3%
- Common ancestry
- Romanian 2% Italian 1% Hispanic 0%
- Foreign-born
- 7% · Canada, South Korea, Philippines
- Languages at home
- 89% English-only · Other Indo-European 3% Spanish 2% French/Haitian/Cajun 1%
Political lean MEDSL · Erie
- 2024 margin
- Lean D (+9.7) · D 54.8% · R 45.2%
- 2008→2024 swing
- -7.9pp toward R · 2008: 17.5pp · 2024: 9.7pp
- All cycles
- 2024: D+9.7 2020: D+14.7 2016: D+4.8 2012: D+15.6 2008: D+17.5
Not yet ingested
- Civics
- —
Market trends
- HPI YoY
- ▼ -16.37%
- Current HPI
- 459.2084
- Rent YoY
- —
- Metro
- Buffalo-Cheektowaga, NY
- State GDP YoY
- ▲ 2.60%
- F500 in state
- 92
Industry mix (Fortune 500 HQ in NY)
| Industry | F500 HQs | Revenue |
|---|---|---|
| Financial Services | 10 | $950B |
|
||
| Consumer Goods | 9 | $162B |
|
||
| Insurance | 4 | $225B |
|
||
| Telecommunications | 2 | $144B |
|
||
| Pharmaceuticals | 2 | $112B |
|
||
| Media / Entertainment | 2 | $69B |
|
||
Price history
1 event — show timeline
- 2026-05-27 Listed $90,500 WNYREIS
Property tax history
+8.4%/yrLatest (2025): $340 · +8.4% YoY. Source: county tax records.
Cash-flow waterfall
monthlySold comps — $/sqft
last 12 mo · ≤1 miLoading sold comps…