2345 E 21st Ave · Gary, IN
Flood risk 1/10 · Minimal
- FEMA flood zone
- X (unshaded)
- Chance of flooding over 30 yrs
- 0.0%
- Est. flood insurance / yr
- $507 – $1,088
Fire risk 3/10 · Minor
- Est. fire insurance / yr
- $717 – $1,331
Heat risk 2/10 · Minimal
- Hot days now (above 103°F)
- 7 days/yr
- Hot days in 30 yrs
- 14 days/yr
Wind risk 2/10 · Minimal
- Chance of severe wind over 30 yrs
- 0.0%
Air-quality risk 4/10 · Minor
- Unhealthy air days now
- 6 days/yr
- Unhealthy air days in 30 yrs
- 7 days/yr
Risk factors via First Street. Map © Google.
Why this score? — see what drove the D+ grade
The composite is a weighted blend of 9 inputs, each scored 0–100. Each bar is that input's sub-score; the figure is the points it added to the 100-point composite (weight × sub-score).
- Cash flow +15.0/30.0
- ARV discount +7.5/15.0
- Appreciation +5.5/10.0
- 1% rule +5.0/10.0
- DSCR +5.0/10.0
- Livability +3.7/5.0
- Rent growth +2.5/5.0
- Condition / age +2.5/5.0
- Schools +0.5/10.0
$28,500
🖨 Deal sheet 📄 Offer letter ✓ Due diligence
Listing remarks MLS
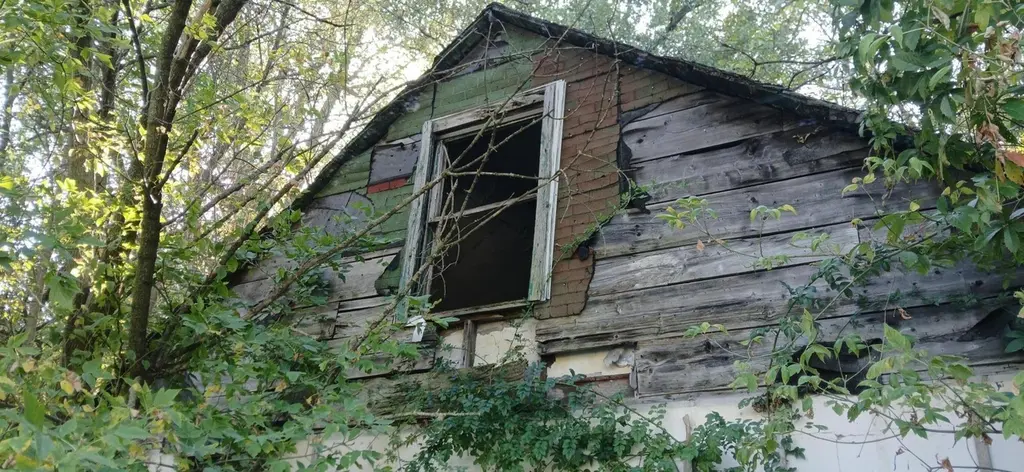
There is a house in there-" SOME WHERE OVER THE RAINBOW "! 3 Beds & 1 Bath, waiting on you to REVIVE, this once lovely home! Think of the nature landscaping options available to you. Restore, rebuild , or demolish, the land will be yours to utilize your creativity. The location provides access to three major interstate highway exchanges, I-65, I-80-94, US 12/20, and scenic Miller Beach. You are also MINUTES away from major shopping malls, eateries, supermarkets and more. Start CLEARING and START CREATING!!
Key facts
- Eateries
- Supermarkets
- 0.5 acre lot
Tags
Neighborhood map
What this means for you Summary
Snapshot
- This is a 3-bed/1.0-bath single-family listed at $28k.
Deal economics
- At list price, monthly cash flow is $923 ($11k/yr) — positive.
- The deal already cash-flows at list — no discount required.
- Meets the 1% rule at list price ($1k rent vs $28k).
- Recommended offer: $25k (12.0% below list) — sets the bar for market timing.
- Cap rate 45.2% vs local median 9.1% in Gary — top-decile yield for the area; either an underpriced asset or a hidden risk that comps aren't pricing in. Stress-test before assuming the spread holds.
Location & tenants
- Location reads 73/100 on livability (#105 in IN) — a middle-class / working-renter tenant base. Strengths: commute A+, cost of living A+, housing A+; Watch: schools F, crime F, employment F.
- Gary Community School Corporation (urban): math 3% / reading 11% proficiency, ranked #299 of 301 in IN (top 99%) — low school quality limits family demand, transient renter base, plan for 1-2y turnover; 80% free/reduced lunch — lower-income household profile, screen leases tightly.
- Market conditions: 121 active listings in the ZIP; 23 comparable units currently listed for rent nearby; rentals leasing fast (median 12d on market — plan ~1-2 weeks tenant-placement turnaround); lower-income renter base — watch delinquency; 1,642 units permitted in Lake County in 2024 (14 in 5+ unit buildings).
- At $1,411/mo this rent would consume 59% of the median local household income ($29k/yr) (locally 392% of renters already pay >50% of income on rent) — very limited rent-growth headroom before tenants either downsize or default.
Forward outlook
- In year one you build about $476 of equity ($197 loan paydown + $279 appreciation (1.0% local appreciation)).
- Lake County population projected to shrink 7% by 2050 — rents likely to lag national; underwrite the cash flow, not the appreciation.
- At projected returns (1.0% appreciation + 3.0% rent growth), your $8k cash investment doubles in ~1 year — after that, you're playing with house money.
Negotiation context
- It's been on market 174 days — a 12% lower offer ($25k) is reasonable based on typical stale-listing flexibility.
- 2 sale attempts since 2y ago with the ask held roughly flat each time — persistent listings suggest the price (not the market) is what's stuck; bring a comps-based counter.
Risks & watch-outs
- Watch-outs: built in 1947 — expect roof / HVAC / electrical / plumbing capex.
Questions for the listing agent
- It's been on market 174 days. Have you received any prior offers? Is the seller open to a 12% concession, seller financing, or rate buy-down credit?
- Built in 1947 — when were the roof, HVAC, electrical panel, plumbing, and water heater last replaced?
- Why hasn't it sold? Are there any deal-killer items the seller is aware of (foundation, flood, title, zoning, code violations)?
- Is there a deadline driving the sale (1031 exchange, divorce, estate, relocation)? That informs how much negotiation room exists.
- Schools are F-rated, which usually means shorter tenancies and higher turnover. Who's the typical renter profile here, and what's been the actual vacancy rate?
- Crime grade is F in this area — have there been break-ins, vandalism, or insurance claims at this property in the last 3 years? What carrier currently insures it and at what premium?
- The area grade is low — what's the realistic commute time and amenity access for the typical tenant pool here? Any planned neighborhood developments (good or bad) we should know about?
- What's the average days-on-market for RENTAL listings here right now (not sales)? A rising rental-DOM trend means longer vacancies and softer asking-rent achievability than the comps imply.
- What's the recent tenant-quality profile in this submarket — average credit score on applications, eviction rate, late-payment / NSF rate, and stable-employment percentage? A property-management company in the area should have these aggregated.
- How much new for-sale + rental construction is in the pipeline within 1–3 miles? Heavy new supply typically softens prices + rents 12–24 months out; constrained supply supports both.
Investment metrics
- 1% rule
- 4.95% ✓
- Cap rate
- 45.18%
- Cash-on-cash
- 138.87%
- DSCR
- 7.18
- GRM
- 1.7
CMA / ARV
- ARV (median comp)
- $71,880
- List price
- $28,500
- Delta
- -60.35%
- Verdict
- UNDERPRICED
- Comps
- 20 within 1.0 mi
Show comp detail 12 sales within ~0.75 mi
| Address | Dist | Beds/Ba | Sqft | Sold | Price | $/sf | Match |
|---|---|---|---|---|---|---|---|
| 1976 Missouri Ter | 0.20mi | 3/1.0 | 1,037 (-3%) | 5mo | $8,500 | $8 | 82 |
| 2801 Central Ave | 0.34mi | 3/1.0 | 1,046 (-2%) | 9mo | $65,000 | $62 | 73 |
| 2601 E 22nd Ave | 0.26mi | 2/1.0 (-1) | 925 (-13%) | 1mo | $99,999 | $108 | 60 |
| 2543 E 21st Pl | 0.21mi | 3/2.0 | 1,177 (+10%) | 14mo | $36,900 | $31 | 57 |
| 2047 Ohio St | 0.66mi | 3/2.0 | 1,092 (+2%) | 6mo | $92,000 | $84 | 56 |
| 2601 Marshalltown Dr | 0.39mi | 3/1.0 | 999 (-6%) | 19mo | $90,000 | $90 | 55 |
| 2801 Central Dr | 0.36mi | 3/1.0 | 933 (-13%) | 11mo | $129,900 | $139 | 52 |
| 1996 Central Dr | 0.32mi | 3/1.0 | 935 (-12%) | 16mo | $108,000 | $116 | 51 |
| 2714 E 21st Pl | 0.30mi | 3/1.0 | 1,200 (+12%) | 18mo | $65,000 | $54 | 50 |
| 2546 E 22nd Pl | 0.25mi | 4/1.0 (+1) | 1,197 (+12%) | 17mo | $102,000 | $85 | 49 |
| 2417 Marshalltown Ln | 0.46mi | 3/1.0 | 925 (-13%) | 15mo | $45,000 | $49 | 44 |
| 2437 Marshalltown Ln | 0.44mi | 3/1.0 | 925 (-13%) | 19mo | $120,000 | $130 | 42 |
Match score weights: distance 35% · size 25% · config 20% · recency 20%. Top-matched comps best support the ARV.
Projected returns pro-forma
0.98% appreciation · 3.0% rent growth · sell at horizon
- IRR
- —
- Equity multiple
- 8.44×
- Total profit
- $59,339
- Equity at exit
- $9,699
- IRR
- —
- Equity multiple
- 17.64×
- Total profit
- $132,796
- Equity at exit
- $12,866
Cash invested: $7,980 (down + closing). Projections, not guarantees.
Landlord ↔ Tenant lean methodology
- Overall (STATE)
- 90 Strongly Landlord-Friendly
- State Indiana
- 90 Strongly Landlord-Friendly · R+11
- County
- — inherits STATE
- City
- — inherits STATE
ZIP-level market 46407
- Home prices YoY
- 0.4%
- Active inventory
- 121
- Price-to-rent
- 1.7×
Monthly cashflow live
- Estimated rent
- $1,411 high interval (Pro) →
- Mortgage (P&I)
- −$149
- Tax from tax record
- −$30 /mo · $359/yr
- Insurance
- −$12
- HOA
- −$0
- Vacancy / Maint / Mgmt
- −$296
- Net cashflow
- $923
Break-even live
UW: 25.0% down · 7.5% · 30yr · 1.5% tax · 5.0% vac · 8.0% maint · 8.0% mgmt
Financing live
Cash to close
- Down payment
- $7,125
- Closing costs
- $855
- Reserves months
- —
- Total cash needed
- —
Loan-product check · same deal, 3 products live
Conventional
25% down · 7.5% · 30yr
- Down + closing
- —
- Monthly P&I
- —
- Monthly cashflow
- —
- DSCR
- —
- Eligible?
- —
Personal DTI + credit; lowest rate.
DSCR
20% down · 8.5% · 30yr
- Down + closing
- —
- Monthly P&I
- —
- Monthly cashflow
- —
- DSCR
- —
- Eligible?
- —
No personal income docs; deal must DSCR.
Hard money
10% down · 12.0% · 12mo
- Down + closing
- —
- Monthly P&I
- —
- Monthly cashflow
- —
- DSCR
- —
- Eligible?
- —
Short-term bridge; refi at stabilization.
Rent comps 23 comps
| Address | Beds | Baths | Sqft | Rent | $/sqft | DOM | Units | Dist |
|---|---|---|---|---|---|---|---|---|
| 2257 Central Dr Gary, IN | 4.0 | 2.0 | 1220 | $1,650 | $1.35 | 43d | 1 | 0.17mi |
| 2025 Central Dr Gary, IN | 3.0 | 1.0 | 875 | $1,550 | $1.77 | 43d | 1 | 0.28mi |
| 2561 E 23rd Ave Gary, IN | 4.0 | 1.0 | 1490 | $1,350 | $0.91 | 43d | 1 | 0.33mi |
| 2612 Marshalltown Dr Gary, IN | 4.0 | 1.0 | 1195 | $1,450 | $1.21 | 11d | 1 | 0.36mi |
| 2612 Marshalltown Dr Gary, IN | 4.0 | 1.0 | 1195 | $1,450 | $1.21 | 3d | 1 | 0.36mi |
| 2908 Central Dr Gary, IN | 3.0 | 1.0 | 884 | $1,525 | $1.73 | 1d | 1 | 0.41mi |
| 1843 Illinois St Gary, IN | 2.0 | 1.0 | 725 | $1,200 | $1.66 | 16d | 1 | 0.52mi |
| 2306 Vermont St Gary, IN | 3.0 | 1.5 | 1200 | $1,300 | $1.08 | 1d | 1 | 0.92mi |
| 2355 Rhode Island St Gary, IN | 2.0 | 1.0 | 701 | $1,095 | $1.56 | 43d | 1 | 0.97mi |
| 1252-54 Idaho St Gary, IN | 3.0 | 1.0 | 900 | $2,200 | $2.44 | 1d | 1 | 1.00mi |
| 2453 Prospect St Gary, IN | 2.0 | 1.0 | 704 | $1,095 | $1.56 | 1d | 1 | 1.11mi |
| 2425 Prospect St Gary, IN | 3.0 | 1.0 | 1051 | $1,400 | $1.33 | 1d | 1 | 1.12mi |
| 2315 Industrial Blvd Gary, IN | 2.0 | 1.0 | 989 | $950 | $0.96 | 3d | 1 | 1.12mi |
| 2315 Industrial Blvd Unit B Gary, IN | 3.0 | 1.0 | 989 | $1,150 | $1.16 | 1d | 1 | 1.12mi |
| 2315 Industrial Blvd Gary, IN | 2.0 | 1.0 | 989 | $950 | $0.96 | 1d | 1 | 1.12mi |
| 2061 Maryland St Gary, IN | 2.0 | 1.0 | 975 | $950 | $0.97 | 43d | 1 | 1.17mi |
| 904 Idaho St Gary, IN | 2.0 | 1.0 | 1176 | $1,200 | $1.02 | 43d | 1 | 1.18mi |
| 2300 Maryland St Gary, IN | 2.0 | 1.0 | 900 | $1,000 | $1.11 | 19d | 1 | 1.23mi |
| 2336 Delaware St Gary, IN | 3.0 | 1.0 | 816 | $1,100 | $1.35 | 1d | 1 | 1.29mi |
| 844 Tennessee St Gary, IN | 3.0 | 1.5 | 1000 | $1,500 | $1.50 | 43d | 1 | 1.31mi |
| 1329 Delaware St Gary, IN | 2.0 | 1.0 | 1100 | $1,100 | $1.00 | 43d | 1 | 1.39mi |
| 1316 Delaware St Unit 2 Gary, IN | 2.0 | 1.0 | 700 | $950 | $1.36 | 20d | 1 | 1.43mi |
| 2022 Massachusetts St Gary, IN | 2.0 | 1.0 | 965 | $1,000 | $1.04 | 1d | 1 | 1.45mi |
Listing history 17 events
-
2026-06-18days on market $28,500 Active 174 DOM
-
2026-06-17days on market $28,500 Active 173 DOM
-
2026-06-16days on market $28,500 Active 172 DOM
-
2026-06-15days on market $28,500 Active 171 DOM
-
2026-06-13days on market $28,500 Active 169 DOM
-
2026-06-13days on market $28,500 Active 168 DOM
-
2026-06-09days on market $28,500 Active 165 DOM
-
2026-06-08days on market $28,500 Active 164 DOM
-
2026-06-07days on market $28,500 Active 163 DOM
-
2026-06-04days on market $28,500 Active 160 DOM
-
2026-06-03days on market $28,500 Active 159 DOM
-
2026-06-02days on market $28,500 Active 158 DOM
-
2026-06-01days on market $28,500 Active 157 DOM
-
2026-05-31days on market $28,500 Active 156 DOM
-
2025-12-26$28,500 Active 533-char remark
Show marketing remark (533 chars)
There is a house in there-" SOME WHERE OVER THE RAINBOW "! 3 Beds & 1 Bath, waiting on you to REVIVE, this once lovely home! Think of the nature landscaping options available to you. Restore, rebuild , or demolish, the land will be yours to utilize your creativity. The location provides access to three major interstate highway exchanges, I-65, I-80-94, US 12/20, and scenic Miller Beach. You are also MINUTES away from major shopping malls, eateries, supermarkets and more. Start CLEARING and START CREATING!!
-
2025-10-12historical
-
2024-10-11$28,500 Active
ⓘ Source: listings_history table (triggers on properties + properties_extension) + one-shot
backfill from property_details.listing_events for pre-trigger history.
Tax reassessment forecast IN · Partial reset (capped growth)
- Current annual tax
- $359 · $30/mo
- Projected year-2 tax
- $359 · $30/mo
- Expected delta
- $0/yr ($0/mo · 0.0%)
ⓘ Screening estimate from a state-policy table — verify with the county assessor before closing.
Climate risk First Street
- Flood 1/10 Low FEMA zone X (unshaded) · 0% chance over 30 yrs
- Wildfire 3/10 Moderate
- Heat 2/10 Low 7 d/yr ≥103°F today · 14 d/yr by 30 yrs out
- Wind 2/10 Low 0% chance of damaging wind over 30 yrs
- Air quality 4/10 Moderate 6 unhealthy d/yr today · 7 by 30 yrs out
Nearby sold comps map
Loading sold comps map…
Walkable amenities ~0.75 mi
Loading nearby amenities…
Taxation est. · year 1
- Rental income
- $16,932
- − Mortgage interest
- −$1,596
- − Property taxes
- −$359
- − Insurance
- −$142
- − Repairs & maintenance
- −$1,355
- − Management
- −$1,355
- − Depreciation
- −$829
- Taxable income
- $11,296
- Est. tax owed @ 24.0%
- −$2,711
- After-tax cash flow
- $8,371/yr
For passive investors: Depreciation is non-cash, so a rental often shows a tax loss while cash-flowing — sheltering income. Rental losses are passive: they offset passive income freely, and up to $25,000/yr can offset ordinary (W-2) income if you actively participate and your MAGI is under $100k (phasing out to $0 by $150k); unused losses carry forward. On sale, claimed depreciation is recaptured at up to 25%, and gains may owe capital-gains tax (a 1031 exchange can defer both). Figures are a year-1 estimate at your 24.0% rate — not tax advice; consult a CPA.
Schools (NCES district)
- District
- Gary Community School Corporation
- NCES district ID
- 1803870
- Math proficiency
- 3% ▼ -10.00%
- Reading proficiency
- 11% ▼ -6.00%
- Median HH income
- $27,739
- Composite
- 4.98/100
- National rank
- #10039
- State rank
- #299 of 301 in IN
Livability — Gary
- Score
- 73/100
- State rank
- #105
- US rank
- #5592
Category grades
Schools grade is shown separately in the Schools card above.
Census & demographics
- Census place
- Gary, IN
- County
- Lake County · 422,878 people
- City population
- 63,701
- Metro
- Chicago-Naperville-Elgin, IL-IN-WI
- Population (ZIP)
- 8,577
- Household income
- $28,526
- Rent vs Own
- Severe rent burden
- 392.0
Population outlook (Lake County) Hauer SSP2
- Today (2025)
- 484,026 people
- By 2030
- 478,091 · -1.2%
- By 2040
- 462,974 · -4.3%
- By 2050
- 449,894 · -7.1%
- By 2075
- 436,169 · -9.9%
- By 2100
- 426,607 · -11.9%
Race, ethnicity, and origin ACS 2023
- Neighborhood character
- Predominantly Black (91%)
- Race & ethnicity
- Black 91% Hispanic / Latino 3% White 2% Two or more races 1%
- Common ancestry
- Romanian 1%
- Foreign-born
- 1% · Canada
- Languages at home
- 97% English-only · Spanish 1% Russian/Polish/Slavic 1% French/Haitian/Cajun 1%
Political lean MEDSL · Lake
- 2024 margin
- Lean D (+5.6) · D 52.1% · R 46.5% · Other 1.5%
- 2008→2024 swing
- -28.6pp toward R · 2008: 34.3pp · 2024: 5.6pp
- All cycles
- 2024: D+5.6 2020: D+15.1 2016: D+20.6 2012: D+31.0 2008: D+34.3
Not yet ingested
- Civics
- —
Market trends
- HPI YoY
- ▲ 0.98%
- Current HPI
- 253.2856
- Rent YoY
- —
- Metro
- Chicago-Naperville-Elgin, IL-IN-WI
- State GDP YoY
- ▲ 2.90%
- F500 in state
- 18
Industry mix (Fortune 500 HQ in IN)
| Industry | F500 HQs | Revenue |
|---|---|---|
| Industrial Machinery | 2 | $37B |
|
||
| Healthcare | 1 | $177B |
|
||
| Pharmaceuticals | 1 | $45B |
|
||
| Metals / Steel | 1 | $18B |
|
||
| Agriculture | 1 | $17B |
|
||
| Packaging | 1 | $12B |
|
||
Price history
+0.0% since first listed3 events — show timeline
- 2025-12-26 Listed $28,500 NIRA MLS as Distributed by MLS Grid
- 2025-10-12 Listing Removed — NIRA MLS as Distributed by MLS Grid
- 2024-10-11 Listed $28,500 NIRA MLS as Distributed by MLS Grid
Property tax history
-16.9%/yrLatest (2024): $359 · +1.6% YoY. Source: county tax records.
Cash-flow waterfall
monthlySold comps — $/sqft
last 12 mo · ≤1 miLoading sold comps…