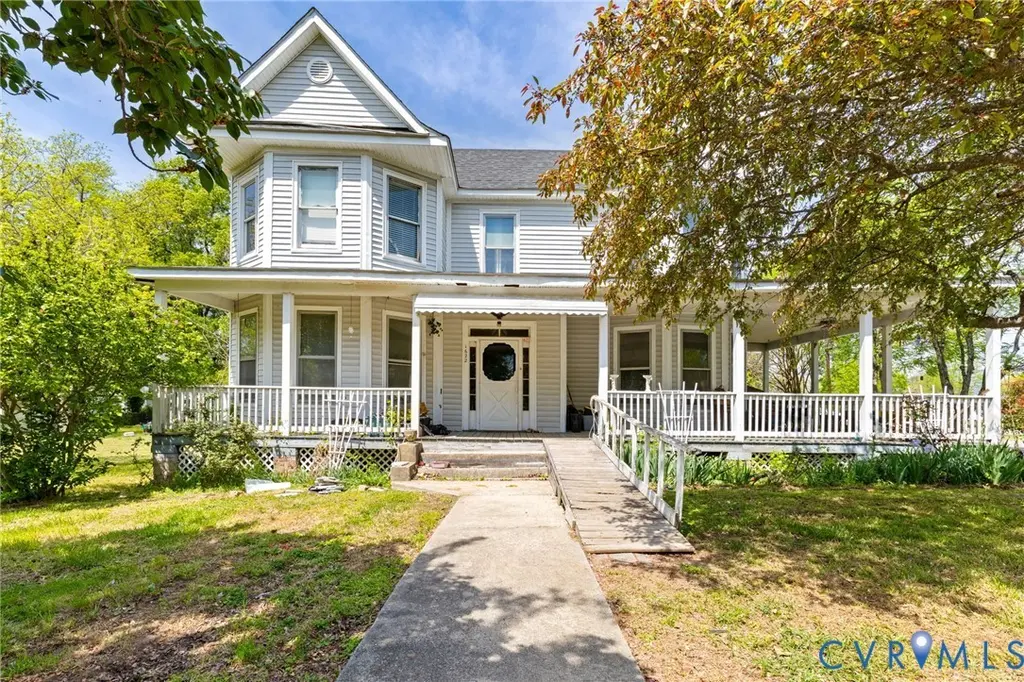
1622 12th St · Victoria, VA
Flood risk No data
- FEMA flood zone
- —
- Chance of flooding over 30 yrs
- —
- Est. flood insurance / yr
- —
Fire risk No data
- Est. fire insurance / yr
- —
Heat risk No data
- Hot days now (above threshold)
- —
- Hot days in 30 yrs
- —
Wind risk No data
- Chance of severe wind over 30 yrs
- —
Air-quality risk No data
- Unhealthy air days now
- —
- Unhealthy air days in 30 yrs
- —
Risk factors via First Street. Map © Google.
Why this score? — see what drove the C grade
The composite is a weighted blend of 9 inputs, each scored 0–100. Each bar is that input's sub-score; the figure is the points it added to the 100-point composite (weight × sub-score).
- Cash flow +22.8/30.0
- ARV discount +7.5/15.0
- DSCR +7.3/10.0
- 1% rule +4.9/10.0
- Appreciation +4.7/10.0
- Schools +3.9/10.0
- Livability +3.5/5.0
- Rent growth +2.5/5.0
- Condition / age +2.5/5.0
$115,000
🖨 Deal sheet 📄 Offer letter ✓ Due diligence
Listing remarks
ABSOLUTE AUCTION! Online only. List price is the suggested starting bid. Timeless 1902 Victorian on a prominent 1/3-acre corner lot in a quiet neighborhood. Offering 3,440 square feet, this property blends historic charm with exceptional potential. Roof replaced around 2019. Standout features include a ¼ wraparound covered porch, soaring ceilings, original hardwood floors, wide trim, and built-in cabinetry. Six spacious bedrooms, including a first-floor primary suite with dual closets. Classic gable rooflines complete the architectural appeal. With some TLC, this property will truly shine. Ideal as a private residence or conversion to a Bed & Breakfast. Located near downtown am
Key facts
- Built 1965
Neighborhood map
What this means for you Summary
Snapshot
- This is a 4-bed/3.0-bath single-family listed at $115k.
Deal economics
- At list price, monthly cash flow is $199 ($2k/yr) — positive.
- The deal already cash-flows at list — no discount required.
- To meet the 1% rule (rent ≥ 1% of price), the offer needs to be $114k (0.7% below list).
- Recommended offer: $114k (0.7% below list) — sets the bar for 1% rule.
Location & tenants
- Location reads 70/100 on livability (#235 in VA) — a middle-class / working-renter tenant base. Strengths: cost of living A+, health & safety A+, housing A; Watch: amenities F, commute F, employment F.
- Lunenburg County Public School District (rural): math 33% / reading 60% proficiency, ranked #110 of 131 in VA (top 84%) — families likely to look elsewhere, expect single-tenant / working-renter base with shorter leases; 60% free/reduced lunch — lower-income household profile, screen leases tightly.
- Market conditions: 25 active listings in the ZIP; 25 units permitted in Lunenburg County in 2024 (0 in 5+ unit buildings).
Forward outlook
- In year one you build about $42 of equity ($795 loan paydown + $-753 appreciation (-0.7% local appreciation)).
- Lunenburg County population projected at -27% by 2050 — secular population decline; favor cash flow + early exit over multi-decade hold.
- At projected returns (-0.7% appreciation + 3.0% rent growth), your $32k cash investment doubles in ~9 years — after that, you're playing with house money.
Negotiation context
- Only 0 days on market — expect competitive offers; lowballing is unlikely to land.
- 5 sale attempts since 6y ago with the ask held roughly flat each time — persistent listings suggest the price (not the market) is what's stuck; bring a comps-based counter.
Questions for the listing agent
- Built in 1965 — when were the roof, HVAC, electrical panel, plumbing, and water heater last replaced?
- Is there a deadline driving the sale (1031 exchange, divorce, estate, relocation)? That informs how much negotiation room exists.
- Schools are B-rated — typically a magnet for longer-tenancy family renters. What's the average tenant stay here, and is there a school-zone premium baked into asking?
- What's the average days-on-market for RENTAL listings here right now (not sales)? A rising rental-DOM trend means longer vacancies and softer asking-rent achievability than the comps imply.
- What's the recent tenant-quality profile in this submarket — average credit score on applications, eviction rate, late-payment / NSF rate, and stable-employment percentage? A property-management company in the area should have these aggregated.
- How much new for-sale + rental construction is in the pipeline within 1–3 miles? Heavy new supply typically softens prices + rents 12–24 months out; constrained supply supports both.
Investment metrics
- 1% rule
- 0.99% ✗
- Cap rate
- 8.37%
- Cash-on-cash
- 7.42%
- DSCR
- 1.33
- GRM
- 8.4
CMA / ARV
No comps found within radius.
Projected returns pro-forma
-0.65% appreciation · 3.0% rent growth · sell at horizon
- IRR
- 4.0%
- Equity multiple
- 1.18×
- Total profit
- $5,793
- Equity at exit
- $29,678
- IRR
- 10.0%
- Equity multiple
- 2.01×
- Total profit
- $32,479
- Equity at exit
- $32,830
Cash invested: $32,200 (down + closing). Projections, not guarantees.
Landlord ↔ Tenant lean methodology
- Overall (STATE)
- 55 Moderately Landlord-Leaning
- State Virginia
- 55 Moderately Landlord-Leaning · D+2
- County
- — inherits STATE
- City
- — inherits STATE
ZIP-level market 23974
- Home prices YoY
- -0.4%
- Active inventory
- 25
- Price-to-rent
- 8.4×
Monthly cashflow live
- Estimated rent
- $1,142 medium interval (Pro) →
- Mortgage (P&I)
- −$603
- Tax from tax record
- −$52 /mo · $624/yr
- Insurance
- −$48
- HOA
- −$0
- Vacancy / Maint / Mgmt
- −$240
- Net cashflow
- $199
Break-even live
UW: 25.0% down · 7.5% · 30yr · 1.5% tax · 5.0% vac · 8.0% maint · 8.0% mgmt
Financing live
Cash to close
- Down payment
- $28,750
- Closing costs
- $3,450
- Reserves months
- —
- Total cash needed
- —
Loan-product check · same deal, 3 products live
Conventional
25% down · 7.5% · 30yr
- Down + closing
- —
- Monthly P&I
- —
- Monthly cashflow
- —
- DSCR
- —
- Eligible?
- —
Personal DTI + credit; lowest rate.
DSCR
20% down · 8.5% · 30yr
- Down + closing
- —
- Monthly P&I
- —
- Monthly cashflow
- —
- DSCR
- —
- Eligible?
- —
No personal income docs; deal must DSCR.
Hard money
10% down · 12.0% · 12mo
- Down + closing
- —
- Monthly P&I
- —
- Monthly cashflow
- —
- DSCR
- —
- Eligible?
- —
Short-term bridge; refi at stabilization.
Listing history 10 events
-
2026-06-10pricestatusdays on market $115,000 Under Contract
-
2026-04-21$50,000 Active 806-char remark
-
2026-04-01historical
-
2026-03-25status Active
-
2026-03-23status Pending
-
2026-03-19$140,000 Active
-
2020-08-13soldstatus $112,000
-
2020-08-13soldstatus $112,000
-
2020-03-04$116,000
-
2018-06-29soldstatus $144,600
ⓘ Source: listings_history table (triggers on properties + properties_extension) + one-shot
backfill from property_details.listing_events for pre-trigger history.
Tax reassessment forecast VA · Resets to sale price
- Current annual tax
- $624 · $52/mo
- Projected year-2 tax
- $943 · $79/mo
- Expected delta
- +$319/yr (+$27/mo · 51.2%)
ⓘ Screening estimate from a state-policy table — verify with the county assessor before closing.
Nearby sold comps map
Loading sold comps map…
Walkable amenities ~0.75 mi
Loading nearby amenities…
Taxation est. · year 1
- Rental income
- $13,704
- − Mortgage interest
- −$6,442
- − Property taxes
- −$624
- − Insurance
- −$575
- − Repairs & maintenance
- −$1,096
- − Management
- −$1,096
- − Depreciation
- −$3,345
- Taxable income
- $525
- Est. tax owed @ 24.0%
- −$126
- After-tax cash flow
- $2,264/yr
For passive investors: Depreciation is non-cash, so a rental often shows a tax loss while cash-flowing — sheltering income. Rental losses are passive: they offset passive income freely, and up to $25,000/yr can offset ordinary (W-2) income if you actively participate and your MAGI is under $100k (phasing out to $0 by $150k); unused losses carry forward. On sale, claimed depreciation is recaptured at up to 25%, and gains may owe capital-gains tax (a 1031 exchange can defer both). Figures are a year-1 estimate at your 24.0% rate — not tax advice; consult a CPA.
Schools (NCES district)
- District
- Lunenburg County Public School District
- NCES district ID
- 5102310
- Math proficiency
- 33% ▼ -41.00%
- Reading proficiency
- 60% ▼ -13.00%
- Median HH income
- $37,728
- Composite
- 38.6/100
- National rank
- #4162
- State rank
- #110 of 131 in VA
Livability — Victoria
- Score
- 70/100
- State rank
- #235
- US rank
- #7920
Category grades
Schools grade is shown separately in the Schools card above.
Census & demographics
- Census place
- Victoria, VA
- Population (ZIP)
- 4,908
Population outlook (Lunenburg County) Hauer SSP2
- Today (2025)
- 11,367 people
- By 2030
- 10,757 · -5.4%
- By 2040
- 9,464 · -16.7%
- By 2050
- 8,329 · -26.7%
- By 2075
- 6,292 · -44.6%
- By 2100
- 4,575 · -59.8%
Race, ethnicity, and origin ACS 2023
- Neighborhood character
- Majority White (55%)
- Race & ethnicity
- White 55% Black 39% Two or more races 5% Hispanic / Latino 3%
- Common ancestry
- Serbian 1% Slovak 1% Romanian 1%
- Foreign-born
- 1% · Canada
- Languages at home
- 99% English-only · Spanish 1%
Political lean MEDSL · Lunenburg
- 2024 margin
- Strong R (+22.8) · D 38.3% · R 61.1%
- 2008→2024 swing
- -19.3pp toward R · 2008: -3.5pp · 2024: -22.8pp
- All cycles
- 2024: R+22.8 2020: R+18.6 2016: R+17.6 2012: R+5.0 2008: R+3.5
Not yet ingested
- Civics
- —
Market trends
- HPI YoY
- ▼ -0.65%
- Current HPI
- 177.4653
- Rent YoY
- —
- Metro
- —
- State GDP YoY
- ▲ 2.40%
- F500 in state
- 50
Industry mix (Fortune 500 HQ in VA)
| Industry | F500 HQs | Revenue |
|---|---|---|
| Aerospace / Defense | 4 | $236B |
|
||
| Technology / Defense | 3 | $32B |
|
||
| Financial Services | 2 | $176B |
|
||
| Utilities | 2 | $27B |
|
||
| Insurance | 2 | $25B |
|
||
| Technology | 2 | $15B |
|
||
Price history
-20.5% since first listed11 events — show timeline
- 2026-06-10 Listed $115,000 FSBO.com
- 2026-05-20 Listing Removed — CVRMLS
- 2026-04-21 Listed $50,000 CVRMLS
- 2026-04-01 Listing Removed — CVRMLS
- 2026-03-25 Relisted — CVRMLS
- 2026-03-23 Pending — CVRMLS
- 2026-03-19 Listed $140,000 CVRMLS
- 2020-08-13 Sold (Public Records) $112,000 Public Records
- 2020-08-13 Sold (MLS) $112,000 LMLS
- 2020-03-04 Listed $116,000 LMLS
- 2018-06-29 Sold (Public Records) $144,600 Public Records
Property tax history
+1.9%/yrLatest (2026): $624 · +12.1% YoY. Source: county tax records.
Cash-flow waterfall
monthlySold comps — $/sqft
last 12 mo · ≤1 miLoading sold comps…