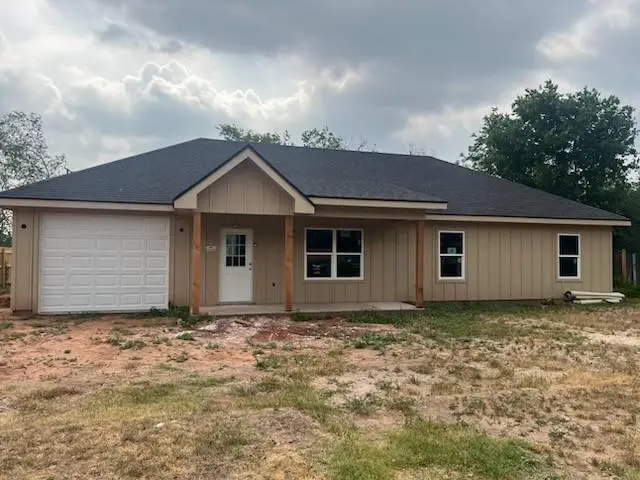
1001 Jeanette St · Abilene, TX
Flood risk 1/10 · Minimal
- FEMA flood zone
- X (unshaded)
- Chance of flooding over 30 yrs
- 0.0%
- Est. flood insurance / yr
- $507 – $1,088
Fire risk 1/10 · Minimal
- Est. fire insurance / yr
- $1,222 – $2,270
Heat risk 6/10 · Moderate
- Hot days now (above 103°F)
- 7 days/yr
- Hot days in 30 yrs
- 23 days/yr
Wind risk 4/10 · Minor
- Chance of severe wind over 30 yrs
- 11.0%
Air-quality risk 1/10 · Minimal
- Unhealthy air days now
- 0 days/yr
- Unhealthy air days in 30 yrs
- 0 days/yr
Risk factors via First Street. Map © Google.
Why this score? — see what drove the B grade
The composite is a weighted blend of 9 inputs, each scored 0–100. Each bar is that input's sub-score; the figure is the points it added to the 100-point composite (weight × sub-score).
- Cash flow +30.0/30.0
- ARV discount +10.5/15.0
- DSCR +10.0/10.0
- 1% rule +7.4/10.0
- Rent growth +5.0/5.0
- Livability +3.8/5.0
- Schools +2.8/10.0
- Condition / age +2.5/5.0
- Appreciation +0.0/10.0
$249,900
🖨 Deal sheet 📄 Offer letter ✓ Due diligence
Listing remarks
Discover modern comfort and thoughtful design in this stunning new construction home situated on a desirable corner lot in the heart of Abilene. Featuring 3 spacious bedrooms and 2 full bathrooms, this home offers an open-concept layout with a bright living room highlighted by soaring vaulted ceilings. The beautiful eat-in kitchen is designed for both style and function, complete with a center island, custom-built cabinetry, granite countertops, and a large walk-in pantry. Brand-new electric range, microwave, and dishwasher are included for added convenience. Enjoy a full-size utility room with additional custom cabinets, abundant storage space, and a dedicated folding area. The private pri
Key facts
- Eat-in kitchen
- Vaulted ceilings
- Corner lot
Tags
Property features AI
Finance
- HOA & community: No association
Exterior
- Parking: Attached 1-car garage; Covered driveway / covered parking (1 covered space)
- Utilities: City water; City sewer; Cable available; High-speed internet available
- Home design: Single family residence; Residential property; One story; New construction - incomplete (Year built: 2026)
- Construction: Slab foundation
- Exterior features: Wood fencing; Corner lot
Interior
- Kitchen: Eat-in kitchen with granite counters and kitchen island; Built-in cabinets; Pantry / Walk-in pantry; Dishwasher; Electric range; Microwave; Disposal
- Bedrooms: Primary bedroom on main level (14 x 12); Two additional bedrooms on main level (each 11 x 11)
- Bathrooms: Two full bathrooms; Primary bathroom with dual sinks, granite counters, custom closet system
- Heating & cooling: Central heating (electric); Central air conditioning (electric)
- Interior features: Built-in features; Cable TV available; Cathedral ceilings; Eat-in kitchen; Granite counters; High-speed internet available; Vaulted ceilings; Walk-in closets; One living area; Room count: 8; Levels: One
- Laundry & utility: Separate utility room with built-in cabinets; Full-size washer/dryer area; Electric dryer hookup
Neighborhood map
What this means for you Summary
Snapshot
- This is a 3-bed/3.0-bath single-family listed at $250k.
Deal economics
- At list price, monthly cash flow is $969 ($12k/yr) — positive.
- The deal already cash-flows at list — no discount required.
- Meets the 1% rule at list price ($3k rent vs $250k).
- Recommended offer: $246k (1.5% below list) — sets the bar for market timing.
- Cap rate 10.9% vs local median 6.7% in Abilene — top-decile yield for the area; either an underpriced asset or a hidden risk that comps aren't pricing in. Stress-test before assuming the spread holds.
Location & tenants
- Location reads 75/100 on livability (#142 in TX, #4,037 nationally) — a middle-class / working-renter tenant base. Strengths: cost of living A+, housing A+, health & safety A+; Watch: crime D, commute F.
- Abilene ISD (urban): math 32% / reading 34% proficiency, ranked #575 of 826 in TX (top 70%) — families likely to look elsewhere, expect single-tenant / working-renter base with shorter leases.
- Zoned schools: Austin El (math 48% / reading 49%, grade D, #950 of 4,322 statewide, top 22%, 724 students, 60% FRL) — zoned schools at 60% FRL track the district average.
- Zoned-school proficiency averages 48% at this address vs 33% district-wide (+16 pts) — the actual schools serving this property are materially stronger than the Abilene ISD average implies; a family-tenant draw the district grade alone would hide.
- Market conditions: Rents rising fast (+33.5%/yr); 370 active listings in the ZIP; 3 comparable units currently listed for rent nearby; rentals at typical pace (median 21d on market — plan ~3-4 weeks tenant-placement turnaround); solid renter incomes; 508 units permitted in Taylor County in 2024 (0 in 5+ unit buildings).
- This rent runs 42% of the median local income ($90k/yr) — at the standard rent-burdened threshold; future hikes will face affordability resistance.
Forward outlook
- Local home prices are declining (-3.0%/yr); year-one equity from $2k of loan paydown is wiped out by about $7k of value loss. Plan a longer hold.
- Taylor County population projected at +16% by 2050 — long-run rental-demand tailwind backs the buy-and-hold thesis.
- At projected returns (-3.0% appreciation + 8.0% rent growth), your $70k cash investment doubles in ~6 years — after that, you're playing with house money.
Negotiation context
- It's been on market 17 days — a 2% lower offer ($246k) is reasonable based on typical stale-listing flexibility.
Risks & watch-outs
- Climate carrying-cost: extreme-heat days projected 7→23/yr by 2055 (HVAC capex compounding) — expect insurance premiums to compound above CPI over the hold.
Questions for the listing agent
- Is there a deadline driving the sale (1031 exchange, divorce, estate, relocation)? That informs how much negotiation room exists.
- Schools are D-rated, which usually means shorter tenancies and higher turnover. Who's the typical renter profile here, and what's been the actual vacancy rate?
- Crime grade is D in this area — have there been break-ins, vandalism, or insurance claims at this property in the last 3 years? What carrier currently insures it and at what premium?
- What's the average days-on-market for RENTAL listings here right now (not sales)? A rising rental-DOM trend means longer vacancies and softer asking-rent achievability than the comps imply.
- What's the recent tenant-quality profile in this submarket — average credit score on applications, eviction rate, late-payment / NSF rate, and stable-employment percentage? A property-management company in the area should have these aggregated.
- How much new for-sale + rental construction is in the pipeline within 1–3 miles? Heavy new supply typically softens prices + rents 12–24 months out; constrained supply supports both.
Investment metrics
- 1% rule
- 1.24% ✓
- Cap rate
- 10.95%
- Cash-on-cash
- 16.63%
- DSCR
- 1.74
- GRM
- 6.7
CMA / ARV
- ARV (on-the-fly)
- $267,970
- Comps found
- 12
Show comp detail 12 sales within ~0.75 mi
| Address | Dist | Beds/Ba | Sqft | Sold | Price | $/sf | Match |
|---|---|---|---|---|---|---|---|
| 734 Vine St | 0.29mi | 4/2.5 (+1) | 2,038 (-3%) | 4mo | $150,000 | $74 | 70 |
| 1174 Palm St | 0.19mi | 4/2.0 (+1) | 1,963 (-7%) | 2mo | $250,000 | $127 | 69 |
| 517 Jeanette St | 0.43mi | 3/1.0 | 2,116 (+0%) | 4mo | $175,000 | $83 | 68 |
| 533 Sayles Blvd | 0.53mi | 3/2.0 | 2,063 (-2%) | 4mo | $282,500 | $137 | 64 |
| 749 Poplar St | 0.33mi | 4/2.0 (+1) | 2,252 (+7%) | 1mo | $90,000 | $40 | 64 |
| 701 Sayles Blvd | 0.42mi | 4/3.0 (+1) | 2,254 (+7%) | 2mo | $330,000 | $146 | 62 |
| 501 Palm St | 0.48mi | 3/3.0 | 2,258 (+7%) | 6mo | $249,600 | $111 | 61 |
| 1017 Sayles Blvd | 0.27mi | 3/2.0 | 1,844 (-13%) | 4mo | $275,000 | $149 | 58 |
| 2145 Idlewild St | 0.39mi | 2/2.0 (-1) | 2,298 (+9%) | 3mo | $459,900 | $200 | 56 |
| 1341 S 11th St | 0.22mi | 4/2.0 (+1) | 1,819 (-14%) | 3mo | $228,000 | $125 | 55 |
| 1017 Santos St | 0.41mi | 2/2.0 (-1) | 1,859 (-12%) | 2mo | $324,900 | $175 | 51 |
| 750 Ross Ave | 0.64mi | 3/3.0 | 2,364 (+12%) | 6mo | $217,000 | $92 | 45 |
Match score weights: distance 35% · size 25% · config 20% · recency 20%. Top-matched comps best support the ARV.
Projected returns pro-forma
-3.0% appreciation · 8.0% rent growth · sell at horizon
- IRR
- 12.8%
- Equity multiple
- 1.54×
- Total profit
- $37,511
- Equity at exit
- $37,261
- IRR
- 25.0%
- Equity multiple
- 3.66×
- Total profit
- $186,233
- Equity at exit
- $21,607
Cash invested: $69,972 (down + closing). Projections, not guarantees.
Landlord ↔ Tenant lean methodology
- Overall (STATE)
- 87 Strongly Landlord-Friendly
- State Texas
- 87 Strongly Landlord-Friendly · R+5
- County
- — inherits STATE
- City
- — inherits STATE
ZIP-level market 79602
- Home prices YoY
- -19.6%
- Rents YoY
- 33.5%
- Active inventory
- 370
- Price-to-rent
- 6.7×
Monthly cashflow live
- Estimated rent
- $3,097 medium interval (Pro) →
- Mortgage (P&I)
- −$1,311
- Tax from tax record
- −$63 /mo · $752/yr
- Insurance
- −$104
- HOA
- −$0
- Vacancy / Maint / Mgmt
- −$650
- Net cashflow
- $969
Break-even live
UW: 25.0% down · 7.5% · 30yr · 1.5% tax · 5.0% vac · 8.0% maint · 8.0% mgmt
Financing live
Cash to close
- Down payment
- $62,475
- Closing costs
- $7,497
- Reserves months
- —
- Total cash needed
- —
Loan-product check · same deal, 3 products live
Conventional
25% down · 7.5% · 30yr
- Down + closing
- —
- Monthly P&I
- —
- Monthly cashflow
- —
- DSCR
- —
- Eligible?
- —
Personal DTI + credit; lowest rate.
DSCR
20% down · 8.5% · 30yr
- Down + closing
- —
- Monthly P&I
- —
- Monthly cashflow
- —
- DSCR
- —
- Eligible?
- —
No personal income docs; deal must DSCR.
Hard money
10% down · 12.0% · 12mo
- Down + closing
- —
- Monthly P&I
- —
- Monthly cashflow
- —
- DSCR
- —
- Eligible?
- —
Short-term bridge; refi at stabilization.
Rent comps 3 comps
| Address | Beds | Baths | Sqft | Rent | $/sqft | DOM | Units | Dist |
|---|---|---|---|---|---|---|---|---|
| 725 Peach St Abilene, TX | 3.0 | 2.0 | 1618 | $3,500 | $2.16 | 21d | 1 | 0.31mi |
| 1349 Meander St Abilene, TX | 3.0 | 1.0 | 1532 | $3,800 | $2.48 | 13d | 1 | 0.38mi |
| 2402 S 20th St Abilene, TX | 2.0 | 1.0 | 2040 | $1,400 | $0.69 | 21d | 1 | 1.04mi |
Listing history 9 events
-
2026-06-07statusdays on market $249,900 Pending 17 DOM
-
2026-06-03days on market $249,900 Active Option Contract 16 DOM
-
2026-06-02days on market $249,900 Active Option Contract 15 DOM
-
2026-06-01days on market $249,900 Active Option Contract 14 DOM
-
2026-05-31days on market $249,900 Active Option Contract 13 DOM
-
2026-05-30days on market $249,900 Active Option Contract 12 DOM
-
2026-05-18$249,900 Active
-
2025-04-10soldstatus
-
2003-12-16soldstatus
ⓘ Source: listings_history table (triggers on properties + properties_extension) + one-shot
backfill from property_details.listing_events for pre-trigger history.
Tax reassessment forecast TX · Resets to sale price
- Current annual tax
- $752 · $63/mo
- Projected year-2 tax
- $4,573 · $381/mo
- Expected delta
- +$3,821/yr (+$318/mo · 507.8%)
ⓘ Screening estimate from a state-policy table — verify with the county assessor before closing.
Climate risk First Street
- Flood 1/10 Low FEMA zone X (unshaded) · 0% chance over 30 yrs
- Wildfire 1/10 Low
- Heat 6/10 Major 7 d/yr ≥103°F today · 23 d/yr by 30 yrs out
- Wind 4/10 Moderate 11% chance of damaging wind over 30 yrs
- Air quality 1/10 Low 0 unhealthy d/yr today · 0 by 30 yrs out
Nearby sold comps map
Loading sold comps map…
Walkable amenities ~0.75 mi
Loading nearby amenities…
Taxation est. · year 1
- Rental income
- $37,166
- − Mortgage interest
- −$13,998
- − Property taxes
- −$752
- − Insurance
- −$1,250
- − Repairs & maintenance
- −$2,973
- − Management
- −$2,973
- − Depreciation
- −$7,270
- Taxable income
- $7,950
- Est. tax owed @ 24.0%
- −$1,908
- After-tax cash flow
- $9,725/yr
For passive investors: Depreciation is non-cash, so a rental often shows a tax loss while cash-flowing — sheltering income. Rental losses are passive: they offset passive income freely, and up to $25,000/yr can offset ordinary (W-2) income if you actively participate and your MAGI is under $100k (phasing out to $0 by $150k); unused losses carry forward. On sale, claimed depreciation is recaptured at up to 25%, and gains may owe capital-gains tax (a 1031 exchange can defer both). Figures are a year-1 estimate at your 24.0% rate — not tax advice; consult a CPA.
Schools (NCES district)
- District
- Abilene ISD
- NCES district ID
- 4807440
- Math proficiency
- 32% ▼ -11.00%
- Reading proficiency
- 34% ▼ -5.00%
- Median HH income
- $39,782
- Composite
- 27.71/100
- National rank
- #6909
- State rank
- #575 of 826 in TX
Livability — Abilene
- Score
- 75/100
- State rank
- #142
- US rank
- #4037
Category grades
Schools grade is shown separately in the Schools card above.
Census & demographics
- Census place
- Abilene, TX
- County
- Taylor County · 136,672 people
- City population
- 136,672
- Metro
- Abilene, TX
- Population (ZIP)
- 27,425
- Household income
- $89,551
- Rent vs Own
- Severe rent burden
- 338.0
Population outlook (Taylor County) Hauer SSP2
- Today (2025)
- 145,270 people
- By 2030
- 150,050 · +3.3%
- By 2040
- 159,417 · +9.7%
- By 2050
- 168,883 · +16.3%
- By 2075
- 194,436 · +33.8%
- By 2100
- 203,163 · +39.9%
Race, ethnicity, and origin ACS 2023
- Neighborhood character
- Majority White (64%)
- Race & ethnicity
- White 64% Hispanic / Latino 22% Two or more races 12% Black 10% Asian 2%
- Hispanic origin (detail)
- Mexican 19%
- Common ancestry
- Romanian 2% Italian 2% Portuguese 2%
- Foreign-born
- 6% · Canada, Vietnam, Jamaica
- Languages at home
- 87% English-only · Spanish 9% Other Asian/Pacific 1% French/Haitian/Cajun 1%
Political lean MEDSL · Taylor
- 2024 margin
- Solid R (+49.8) · D 24.6% · R 74.4% · Other 1.0%
- 2008→2024 swing
- -4.2pp toward R · 2008: -45.6pp · 2024: -49.8pp
- All cycles
- 2024: R+49.8 2020: R+45.3 2016: R+51.1 2012: R+53.6 2008: R+45.6
Not yet ingested
- Civics
- —
Market trends
- HPI YoY
- ▼ -46.04%
- Current HPI
- 189.3098
- Rent YoY
- ▲ 33.46%
- Metro
- Abilene, TX
- State GDP YoY
- ▲ 3.95%
- F500 in state
- 110
Industry mix (Fortune 500 HQ in TX)
| Industry | F500 HQs | Revenue |
|---|---|---|
| Energy | 16 | $1,198B |
|
||
| Technology | 5 | $198B |
|
||
| Engineering / Construction | 4 | $72B |
|
||
| Energy Services | 3 | $60B |
|
||
| Utilities | 3 | $41B |
|
||
| Healthcare | 2 | $330B |
|
||
Price history
3 events — show timeline
- 2026-05-18 Listed $249,900 NTREIS
- 2025-04-10 Sold (Public Records) — Public Records
- 2003-12-16 Sold (Public Records) — Public Records
Property tax history
+4.6%/yrLatest (2025): $752 · +8.3% YoY. Source: county tax records.
Cash-flow waterfall
monthlySold comps — $/sqft
last 12 mo · ≤1 miLoading sold comps…