46 Pink Dogwood Trl · Kimberling City, MO
Flood risk 1/10 · Minimal
- FEMA flood zone
- X (unshaded)
- Chance of flooding over 30 yrs
- 0.0%
- Est. flood insurance / yr
- $507 – $1,088
Fire risk 1/10 · Minimal
- Est. fire insurance / yr
- $1,054 – $1,958
Heat risk 5/10 · Moderate
- Hot days now (above 104°F)
- 7 days/yr
- Hot days in 30 yrs
- 20 days/yr
Wind risk 2/10 · Minimal
- Chance of severe wind over 30 yrs
- 1.0%
Air-quality risk 1/10 · Minimal
- Unhealthy air days now
- 0 days/yr
- Unhealthy air days in 30 yrs
- 0 days/yr
Risk factors via First Street. Map © Google.
Why this score? — see what drove the C- grade
The composite is a weighted blend of 9 inputs, each scored 0–100. Each bar is that input's sub-score; the figure is the points it added to the 100-point composite (weight × sub-score).
- Cash flow +17.0/30.0
- ARV discount +15.0/15.0
- DSCR +5.3/10.0
- 1% rule +4.7/10.0
- Livability +3.5/5.0
- Schools +3.2/10.0
- Rent growth +2.5/5.0
- Condition / age +2.5/5.0
- Appreciation +0.0/10.0
$179,900
🖨 Deal sheet 📄 Offer letter ✓ Due diligence
Listing remarks MLS
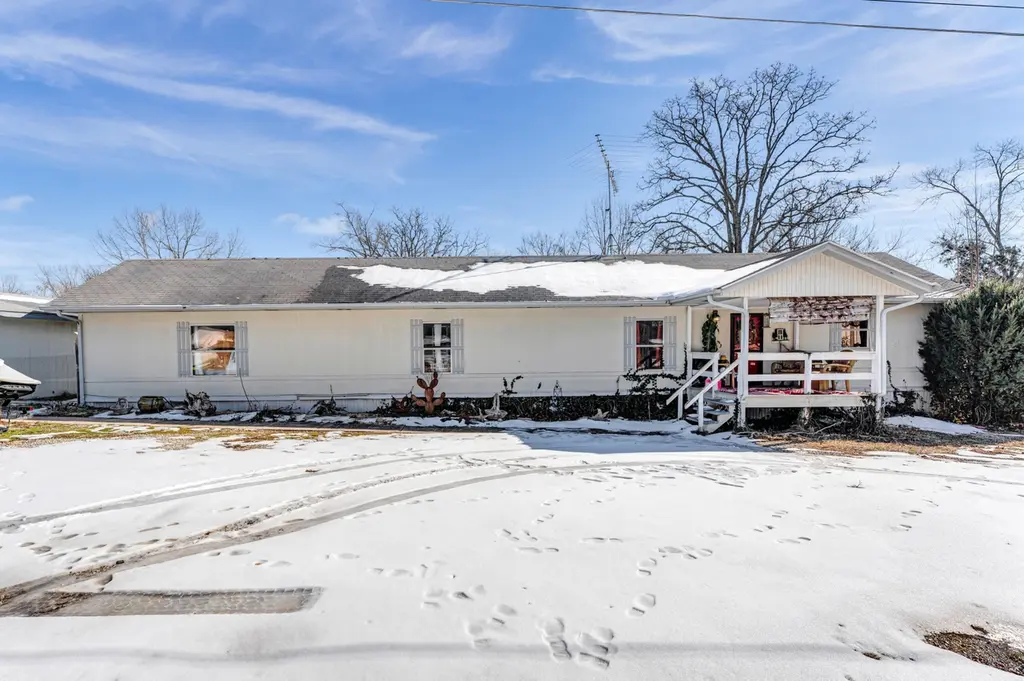
A manufactured home set on a flat, comfortable lot with a two-car detached garage could be your ideal full or part time retreat. Unwind on the front porch to enjoy a glimpse of Table Rock Lake, or hop on a bike to explore Joe Bald State Park. This property is a short stroll or ride from Table Rock Lake. The home could use a little TLC, but with your own touches, it can shine.
Key facts
- Front porch
- 0.26 acre lot
- 2 garage spots
Tags
Neighborhood map
What this means for you Summary
Snapshot
- This is a 3-bed/2.0-bath manufactured listed at $180k.
Deal economics
- At list price, monthly cash flow is $122 ($1k/yr) — positive.
- The deal already cash-flows at list — no discount required.
- To meet the 1% rule (rent ≥ 1% of price), the offer needs to be $175k (2.7% below list).
- Recommended offer: $164k (9.0% below list) — sets the bar for market timing.
- Cap rate 7.1% vs local median 1.7% in Kimberling City — top-decile yield for the area; either an underpriced asset or a hidden risk that comps aren't pricing in. Stress-test before assuming the spread holds.
Location & tenants
- Location reads 69/100 on livability (#162 in MO) — a middle-class / working-renter tenant base. Strengths: crime A+, cost of living A+, housing A+; Watch: health & safety C-, schools D, employment D.
- Reeds Spring R-IV (rural): math 34% / reading 42% proficiency, ranked #182 of 324 in MO (top 56%) — families likely to look elsewhere, expect single-tenant / working-renter base with shorter leases.
- Market conditions: 288 active listings in the ZIP; 1 comparable units currently listed for rent nearby; 191 units permitted in Stone County in 2024 (0 in 5+ unit buildings).
Forward outlook
- Local home prices are declining (-3.0%/yr); year-one equity from $1k of loan paydown is wiped out by about $5k of value loss. Plan a longer hold.
- Stone County population projected at -30% by 2050 — secular population decline; favor cash flow + early exit over multi-decade hold.
Negotiation context
- It's been on market 103 days — a 9% lower offer ($164k) is reasonable based on typical stale-listing flexibility.
- 4 sale attempts since 19y ago with the ask held roughly flat each time — persistent listings suggest the price (not the market) is what's stuck; bring a comps-based counter.
Risks & watch-outs
- Climate carrying-cost: extreme-heat days projected 7→20/yr by 2055 (HVAC capex compounding) — expect insurance premiums to compound above CPI over the hold.
Questions for the listing agent
- It's been on market 103 days. Have you received any prior offers? Is the seller open to a 9% concession, seller financing, or rate buy-down credit?
- What does the HOA fee cover, when was the last increase, and are there any pending special assessments or reserve-fund shortfalls?
- Why hasn't it sold? Are there any deal-killer items the seller is aware of (foundation, flood, title, zoning, code violations)?
- Is there a deadline driving the sale (1031 exchange, divorce, estate, relocation)? That informs how much negotiation room exists.
- Schools are D-rated, which usually means shorter tenancies and higher turnover. Who's the typical renter profile here, and what's been the actual vacancy rate?
- What's the average days-on-market for RENTAL listings here right now (not sales)? A rising rental-DOM trend means longer vacancies and softer asking-rent achievability than the comps imply.
- What's the recent tenant-quality profile in this submarket — average credit score on applications, eviction rate, late-payment / NSF rate, and stable-employment percentage? A property-management company in the area should have these aggregated.
- How much new for-sale + rental construction is in the pipeline within 1–3 miles? Heavy new supply typically softens prices + rents 12–24 months out; constrained supply supports both.
Investment metrics
- 1% rule
- 0.97% ✗
- Cap rate
- 7.11%
- Cash-on-cash
- 2.91%
- DSCR
- 1.13
- GRM
- 8.6
CMA / ARV
- ARV (median comp)
- $223,191
- List price
- $179,900
- Delta
- -19.40%
- Verdict
- UNDERPRICED
- Comps
- 3 within 2.0 mi
Show comp detail 1 sale within ~0.75 mi
| Address | Dist | Beds/Ba | Sqft | Sold | Price | $/sf | Match |
|---|---|---|---|---|---|---|---|
| 5932 Joe Bald Rd | 0.07mi | 3/2.0 | 1,456 (-2%) | 24mo | $130,000 | $89 | 72 |
Match score weights: distance 35% · size 25% · config 20% · recency 20%. Top-matched comps best support the ARV.
Projected returns pro-forma
-3.0% appreciation · 3.0% rent growth · sell at horizon
- IRR
- -11.7%
- Equity multiple
- 0.58×
- Total profit
- $-21,328
- Equity at exit
- $26,824
- IRR
- -2.5%
- Equity multiple
- 0.83×
- Total profit
- $-8,397
- Equity at exit
- $15,554
Cash invested: $50,372 (down + closing). Projections, not guarantees.
Landlord ↔ Tenant lean methodology
- Overall (STATE)
- 81 Strongly Landlord-Friendly
- State Missouri
- 81 Strongly Landlord-Friendly · R+10
- County
- — inherits STATE
- City
- — inherits STATE
ZIP-level market 65686
- Home prices YoY
- -31.2%
- Active inventory
- 288
- Price-to-rent
- 8.6×
Monthly cashflow live
- Estimated rent
- $1,750 medium interval (Pro) →
- Mortgage (P&I)
- −$943
- Tax est. 1.5%
- −$225 /mo · $2,698/yr
- Insurance
- −$75
- HOA
- −$17
- Vacancy / Maint / Mgmt
- −$368
- Net cashflow
- $122
Break-even live
UW: 25.0% down · 7.5% · 30yr · 1.5% tax · 5.0% vac · 8.0% maint · 8.0% mgmt
Financing live
Cash to close
- Down payment
- $44,975
- Closing costs
- $5,397
- Reserves months
- —
- Total cash needed
- —
Loan-product check · same deal, 3 products live
Conventional
25% down · 7.5% · 30yr
- Down + closing
- —
- Monthly P&I
- —
- Monthly cashflow
- —
- DSCR
- —
- Eligible?
- —
Personal DTI + credit; lowest rate.
DSCR
20% down · 8.5% · 30yr
- Down + closing
- —
- Monthly P&I
- —
- Monthly cashflow
- —
- DSCR
- —
- Eligible?
- —
No personal income docs; deal must DSCR.
Hard money
10% down · 12.0% · 12mo
- Down + closing
- —
- Monthly P&I
- —
- Monthly cashflow
- —
- DSCR
- —
- Eligible?
- —
Short-term bridge; refi at stabilization.
Rent comps 1 comps
| Address | Beds | Baths | Sqft | Rent | $/sqft | DOM | Units | Dist |
|---|---|---|---|---|---|---|---|---|
| 11 Kimberling Blvd Unit A Kimberling City, MO | 2.0 | 2.0 | 1140 | $1,750 | $1.54 | 43d | 1 | 1.38mi |
HOA detail
- Monthly dues
- $17 · $204/yr
Listing history 26 events
-
2026-06-19days on market $179,900 Active 103 DOM
-
2026-06-18days on market $179,900 Active 102 DOM
-
2026-06-17days on market $179,900 Active 101 DOM
-
2026-06-16days on market $179,900 Active 100 DOM
-
2026-06-15days on market $179,900 Active 99 DOM
-
2026-06-14days on market $179,900 Active 97 DOM
-
2026-06-12days on market $179,900 Active 96 DOM
-
2026-06-09days on market $179,900 Active 93 DOM
-
2026-06-08days on market $179,900 Active 92 DOM
-
2026-06-07days on market $179,900 Active 91 DOM
-
2026-06-05days on market $179,900 Active 88 DOM
-
2026-06-03days on market $179,900 Active 87 DOM
-
2026-06-02days on market $179,900 Active 86 DOM
-
2026-06-01days on market $179,900 Active 85 DOM
-
2026-05-31days on market $179,900 Active 84 DOM
-
2026-05-30days on market $179,900 Active 83 DOM
-
2026-05-13status Active 378-char remark
Show marketing remark (378 chars)
A manufactured home set on a flat, comfortable lot with a two-car detached garage could be your ideal full or part time retreat. Unwind on the front porch to enjoy a glimpse of Table Rock Lake, or hop on a bike to explore Joe Bald State Park. This property is a short stroll or ride from Table Rock Lake. The home could use a little TLC, but with your own touches, it can shine.
-
2026-04-14status Pending 378-char remark
Show marketing remark (378 chars)
A manufactured home set on a flat, comfortable lot with a two-car detached garage could be your ideal full or part time retreat. Unwind on the front porch to enjoy a glimpse of Table Rock Lake, or hop on a bike to explore Joe Bald State Park. This property is a short stroll or ride from Table Rock Lake. The home could use a little TLC, but with your own touches, it can shine.
-
2026-02-07$179,900 Active 378-char remark
Show marketing remark (378 chars)
A manufactured home set on a flat, comfortable lot with a two-car detached garage could be your ideal full or part time retreat. Unwind on the front porch to enjoy a glimpse of Table Rock Lake, or hop on a bike to explore Joe Bald State Park. This property is a short stroll or ride from Table Rock Lake. The home could use a little TLC, but with your own touches, it can shine.
-
2022-06-21soldstatus
-
2022-06-17soldstatus Closed 420-char remark
Show marketing remark (420 chars)
Manufactured home on a nice level lot with a 2 car detached garage can be your next full or part time home. Enjoy a nice quiet evening with the Partial Table Rock view from front porch or take a bike ride to Joe Bald state park. Yes! You read correctly, this home is a short walk or bike ride away from Table Rock Lake. Home needs a little tender, love and care but with some personalized touched you can make it great!
-
2022-06-05historical 420-char remark
Show marketing remark (420 chars)
Manufactured home on a nice level lot with a 2 car detached garage can be your next full or part time home. Enjoy a nice quiet evening with the Partial Table Rock view from front porch or take a bike ride to Joe Bald state park. Yes! You read correctly, this home is a short walk or bike ride away from Table Rock Lake. Home needs a little tender, love and care but with some personalized touched you can make it great!
-
2022-05-07$80,000 420-char remark
Show marketing remark (420 chars)
Manufactured home on a nice level lot with a 2 car detached garage can be your next full or part time home. Enjoy a nice quiet evening with the Partial Table Rock view from front porch or take a bike ride to Joe Bald state park. Yes! You read correctly, this home is a short walk or bike ride away from Table Rock Lake. Home needs a little tender, love and care but with some personalized touched you can make it great!
-
2022-02-01soldstatus
-
2007-07-10soldstatus
-
2007-02-16$59,000
ⓘ Source: listings_history table (triggers on properties + properties_extension) + one-shot
backfill from property_details.listing_events for pre-trigger history.
Climate risk First Street
- Flood 1/10 Low FEMA zone X (unshaded) · 0% chance over 30 yrs
- Wildfire 1/10 Low
- Heat 5/10 Major 7 d/yr ≥104°F today · 20 d/yr by 30 yrs out
- Wind 2/10 Low 100% chance of damaging wind over 30 yrs
- Air quality 1/10 Low 0 unhealthy d/yr today · 0 by 30 yrs out
Nearby sold comps map
Loading sold comps map…
Walkable amenities ~0.75 mi
Loading nearby amenities…
Taxation est. · year 1
- Rental income
- $21,000
- − Mortgage interest
- −$10,077
- − Property taxes
- −$2,698
- − Insurance
- −$900
- − Repairs & maintenance
- −$1,680
- − Management
- −$1,680
- − HOA
- −$204
- − Depreciation
- −$5,233
- Taxable loss
- −$1,473
- Est. tax savings @ 24.0%
- +$353
- After-tax cash flow
- $1,820/yr
For passive investors: Depreciation is non-cash, so a rental often shows a tax loss while cash-flowing — sheltering income. Rental losses are passive: they offset passive income freely, and up to $25,000/yr can offset ordinary (W-2) income if you actively participate and your MAGI is under $100k (phasing out to $0 by $150k); unused losses carry forward. On sale, claimed depreciation is recaptured at up to 25%, and gains may owe capital-gains tax (a 1031 exchange can defer both). Figures are a year-1 estimate at your 24.0% rate — not tax advice; consult a CPA.
Schools (NCES district)
- District
- Reeds Spring R-IV
- NCES district ID
- 2926160
- Math proficiency
- 34% ▼ -3.00%
- Reading proficiency
- 42% ▼ -1.00%
- Median HH income
- $42,158
- Composite
- 32.06/100
- National rank
- #5819
- State rank
- #182 of 324 in MO
Livability — Kimberling City
- Score
- 69/100
- State rank
- #162
- US rank
- #8879
Category grades
Schools grade is shown separately in the Schools card above.
Census & demographics
- Population (ZIP)
- 4,487
Population outlook (Stone County) Hauer SSP2
- Today (2025)
- 28,147 people
- By 2030
- 26,405 · -6.2%
- By 2040
- 22,762 · -19.1%
- By 2050
- 19,706 · -30.0%
- By 2075
- 14,742 · -47.6%
- By 2100
- 10,832 · -61.5%
Race, ethnicity, and origin ACS 2023
- Neighborhood character
- Predominantly White (96%)
- Race & ethnicity
- White 96% Two or more races 3%
- Common ancestry
- Lithuanian 4% Italian 3% Slovak 2%
- Foreign-born
- 2% · Canada
- Languages at home
- 99% English-only · Other Asian/Pacific 0%
Political lean MEDSL · Stone
- 2024 margin
- Solid R (+61.4) · D 18.9% · R 80.3%
- 2008→2024 swing
- -24.1pp toward R · 2008: -37.3pp · 2024: -61.4pp
- All cycles
- 2024: R+61.4 2020: R+61.1 2016: R+62.1 2012: R+49.2 2008: R+37.3
Not yet ingested
- Civics
- —
Market trends
- HPI YoY
- ▼ -90.17%
- Current HPI
- 198.5699
- Rent YoY
- —
- Metro
- —
- State GDP YoY
- ▲ 1.84%
- F500 in state
- 20
Industry mix (Fortune 500 HQ in MO)
| Industry | F500 HQs | Revenue |
|---|---|---|
| Healthcare | 1 | $163B |
|
||
| Insurance | 1 | $21B |
|
||
| Industrial Technology | 1 | $17B |
|
||
| Retail | 1 | $16B |
|
||
| Industrial Distribution | 1 | $10B |
|
||
| Utilities | 1 | $9B |
|
||
Price history
+204.9% since first listed10 events — show timeline
- 2026-05-13 Relisted — SOMO
- 2026-04-14 Pending — SOMO
- 2026-02-07 Listed $179,900 SOMO
- 2022-06-21 Sold (Public Records) — Public Records
- 2022-06-17 Sold (MLS) — SOMO
- 2022-06-05 Delisted — SOMO
- 2022-05-07 Listed $80,000 SOMO
- 2022-02-01 Sold (Public Records) — Public Records
- 2007-07-10 Sold (Public Records) — Public Records
- 2007-02-16 Listed $59,000 SOMO
Property tax history
+1.7%/yrLatest (2025): $309 · -0.0% YoY. Source: county tax records.
Cash-flow waterfall
monthlySold comps — $/sqft
last 12 mo · ≤1 miLoading sold comps…