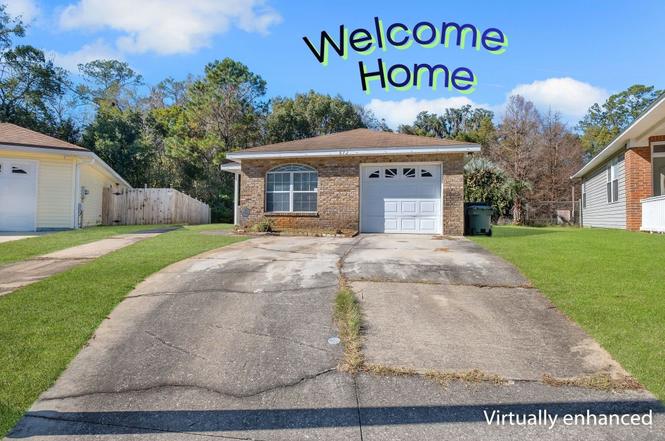
872 Medical Commons Dr · Tallahassee, FL
Flood risk 1/10 · Minimal
- FEMA flood zone
- X (unshaded)
- Chance of flooding over 30 yrs
- 0.0%
- Est. flood insurance / yr
- $507 – $1,088
Fire risk 2/10 · Minimal
- Est. fire insurance / yr
- $947 – $1,759
Heat risk 9/10 · Severe
- Hot days now (above 108°F)
- 7 days/yr
- Hot days in 30 yrs
- 21 days/yr
Wind risk 9/10 · Severe
- Chance of severe wind over 30 yrs
- 99.0%
Air-quality risk 4/10 · Minor
- Unhealthy air days now
- 5 days/yr
- Unhealthy air days in 30 yrs
- 6 days/yr
Risk factors via First Street. Map © Google.
Why this score? — see what drove the C grade
The composite is a weighted blend of 9 inputs, each scored 0–100. Each bar is that input's sub-score; the figure is the points it added to the 100-point composite (weight × sub-score).
- ARV discount +15.0/15.0
- Cash flow +14.4/30.0
- Appreciation +4.7/10.0
- DSCR +4.4/10.0
- Schools +4.3/10.0
- Livability +4.3/5.0
- 1% rule +3.7/10.0
- Rent growth +2.5/5.0
- Condition / age +2.5/5.0
$194,900
🖨 Deal sheet 📄 Offer letter ✓ Due diligence
Listing remarks
Welcome to this charming 3-bedroom, 2-bath home offering comfort, convenience, & incredible value in Tallahassee. Step inside to discover a spacious, functional layout filled with natural light, perfect for everyday living or entertaining. The inviting living area flows seamlessly into an eat-in kitchen, creating a great space for gathering with family and friends. Additional highlights include: 1-car garage for parking or extra storage. Single-story layout for easy, low-maintenance living. Generous lot with room to personalize or expand outdoor living space. Convenient access to shopping, dining, & nearby universities. Great opportunity for first-time buyers, downsizers, or inves
Key facts
- Front porch
- Eat in kitchen
- Conveniently located
Tags
Property features AI
Finance
- Financial info: Offered for sale
Exterior
- Parking: 1-car garage
- Utilities: Central air conditioning
- Home design: Single-story
- Exterior features: Patio; Paved road access
Interior
- Kitchen: Dishwasher; Oven; Range; Refrigerator
- Bedrooms: Bedroom 2: 10x10; Bedroom 3: 10x10
- Flooring: Carpet
- Bathrooms: 2 full bathrooms
- Interior features: Carpet flooring
Neighborhood map
What this means for you Summary
Snapshot
- This is a 3-bed/2.0-bath single-family listed at $195k.
Deal economics
- At list price, monthly cash flow is $38 ($460/yr) — positive.
- The deal already cash-flows at list — no discount required.
- To meet the 1% rule (rent ≥ 1% of price), the offer needs to be $169k (13.3% below list).
- Recommended offer: $169k (13.3% below list) — sets the bar for 1% rule.
- Cap rate 6.5% vs local median 4.2% in Tallahassee — top-decile yield for the area; either an underpriced asset or a hidden risk that comps aren't pricing in. Stress-test before assuming the spread holds.
Location & tenants
- Location reads 86/100 on livability (#19 in FL, #429 nationally) — a professional / high-income tenant draw. Strengths: amenities A+, commute A+, health & safety A+; Watch: employment D.
- Leon (urban): math 48% / reading 53% proficiency, ranked #33 of 73 in FL (top 45%) — acceptable for families but not a draw, mixed tenant base, ~2y average lease.
- Market conditions: 94 active listings in the ZIP; 22 comparable units currently listed for rent nearby; rentals at typical pace (median 21d on market — plan ~3-4 weeks tenant-placement turnaround); lower-income renter base — watch delinquency; 1,765 units permitted in Leon County in 2024 (975 in 5+ unit buildings).
- At $1,689/mo this rent would consume 53% of the median local household income ($38k/yr) (locally 1272% of renters already pay >50% of income on rent) — very limited rent-growth headroom before tenants either downsize or default.
Forward outlook
- In year one you build about $292 of equity ($1k loan paydown + $-1k appreciation (-0.5% local appreciation)).
- Leon County population projected at +23% by 2050 — long-run rental-demand tailwind backs the buy-and-hold thesis.
Negotiation context
- It's been on market 154 days — a 12% lower offer ($172k) is reasonable based on typical stale-listing flexibility.
- 2 sale attempts with the ask held roughly flat each time — persistent listings suggest the price (not the market) is what's stuck; bring a comps-based counter.
- Current owner paid $95k; list at $195k implies a 106% gain — meaningful room to come down on a strong offer.
Risks & watch-outs
- Climate carrying-cost: severe wind risk, 99% chance of damaging wind over 30y; extreme-heat days projected 7→21/yr by 2055 (HVAC capex compounding) — expect insurance premiums to compound above CPI over the hold.
Questions for the listing agent
- It's been on market 154 days. Have you received any prior offers? Is the seller open to a 13% concession, seller financing, or rate buy-down credit?
- Why hasn't it sold? Are there any deal-killer items the seller is aware of (foundation, flood, title, zoning, code violations)?
- Is there a deadline driving the sale (1031 exchange, divorce, estate, relocation)? That informs how much negotiation room exists.
- Schools are B-rated — typically a magnet for longer-tenancy family renters. What's the average tenant stay here, and is there a school-zone premium baked into asking?
- What's the average days-on-market for RENTAL listings here right now (not sales)? A rising rental-DOM trend means longer vacancies and softer asking-rent achievability than the comps imply.
- What's the recent tenant-quality profile in this submarket — average credit score on applications, eviction rate, late-payment / NSF rate, and stable-employment percentage? A property-management company in the area should have these aggregated.
- How much new for-sale + rental construction is in the pipeline within 1–3 miles? Heavy new supply typically softens prices + rents 12–24 months out; constrained supply supports both.
Investment metrics
- 1% rule
- 0.87% ✗
- Cap rate
- 6.53%
- Cash-on-cash
- 0.84%
- DSCR
- 1.04
- GRM
- 9.6
CMA / ARV
- ARV (on-the-fly)
- $235,000
- Comps found
- 12
Show comp detail 12 sales within ~0.75 mi
| Address | Dist | Beds/Ba | Sqft | Sold | Price | $/sf | Match |
|---|---|---|---|---|---|---|---|
| 848 Medical Commons Ct | 0.05mi | 3/2.0 | 1,260 (+1%) | 14mo | $225,000 | $179 | 85 |
| 822 Tucker St | 0.37mi | 3/2.0 | 1,275 (+2%) | 2mo | $260,000 | $204 | 78 |
| 2624 Saxon St | 0.21mi | 3/2.0 | 1,186 (-5%) | 5mo | $163,000 | $137 | 78 |
| 2224 Keith St | 0.38mi | 3/2.0 | 1,287 (+3%) | 9mo | $254,000 | $197 | 70 |
| 804 Medical Commons Ct | 0.15mi | 3/2.0 | 1,119 (-10%) | 11mo | $231,631 | $207 | 66 |
| 2250 Holton St | 0.35mi | 3/2.0 | 1,158 (-7%) | 7mo | $170,500 | $147 | 65 |
| 2228 Keith St | 0.37mi | 3/2.0 | 1,180 (-6%) | 13mo | $185,000 | $157 | 63 |
| 2207 Holton St | 0.46mi | 3/2.0 | 1,328 (+6%) | 14mo | $250,000 | $188 | 57 |
| 2507 Saxon St | 0.30mi | 3/2.0 | 1,092 (-13%) | 12mo | $207,000 | $190 | 54 |
| 507 Emory Ct | 0.59mi | 3/2.0 | 1,182 (-5%) | 13mo | $195,800 | $166 | 52 |
| 623 Brookridge Dr | 0.57mi | 3/2.0 | 1,118 (-11%) | 14mo | $250,000 | $224 | 44 |
| 2046 Holmes St | 0.69mi | 2/1.0 (-1) | 1,160 (-7%) | 14mo | $105,000 | $91 | 35 |
Match score weights: distance 35% · size 25% · config 20% · recency 20%. Top-matched comps best support the ARV.
Projected returns pro-forma
-0.54% appreciation · 3.0% rent growth · sell at horizon
- IRR
- -3.3%
- Equity multiple
- 0.85×
- Total profit
- $-8,172
- Equity at exit
- $51,376
- IRR
- 2.9%
- Equity multiple
- 1.30×
- Total profit
- $16,165
- Equity at exit
- $57,733
Cash invested: $54,572 (down + closing). Projections, not guarantees.
Landlord ↔ Tenant lean methodology
- Overall (STATE)
- 87 Strongly Landlord-Friendly
- State Florida
- 87 Strongly Landlord-Friendly · R+3
- County
- — inherits STATE
- City
- — inherits STATE
ZIP-level market 32310
- Home prices YoY
- -0.2%
- Active inventory
- 94
- Price-to-rent
- 9.6×
Monthly cashflow live
- Estimated rent
- $1,689 high interval (Pro) →
- Mortgage (P&I)
- −$1,022
- Tax from tax record
- −$193 /mo · $2,316/yr
- Insurance
- −$81
- HOA
- −$0
- Vacancy / Maint / Mgmt
- −$355
- Net cashflow
- $38
Break-even live
UW: 25.0% down · 7.5% · 30yr · 1.5% tax · 5.0% vac · 8.0% maint · 8.0% mgmt
Financing live
Cash to close
- Down payment
- $48,725
- Closing costs
- $5,847
- Reserves months
- —
- Total cash needed
- —
Loan-product check · same deal, 3 products live
Conventional
25% down · 7.5% · 30yr
- Down + closing
- —
- Monthly P&I
- —
- Monthly cashflow
- —
- DSCR
- —
- Eligible?
- —
Personal DTI + credit; lowest rate.
DSCR
20% down · 8.5% · 30yr
- Down + closing
- —
- Monthly P&I
- —
- Monthly cashflow
- —
- DSCR
- —
- Eligible?
- —
No personal income docs; deal must DSCR.
Hard money
10% down · 12.0% · 12mo
- Down + closing
- —
- Monthly P&I
- —
- Monthly cashflow
- —
- DSCR
- —
- Eligible?
- —
Short-term bridge; refi at stabilization.
Rent comps 22 comps
| Address | Beds | Baths | Sqft | Rent | $/sqft | DOM | Units | Dist |
|---|---|---|---|---|---|---|---|---|
| 3111 Rackley Dr Tallahassee, FL | 4.0 | 2.5 | 1802 | $3,800 | $2.11 | 21d | 1 | 0.50mi |
| 3178 N Ridge Rd Apt A Tallahassee, FL | 2.0 | 2.0 | 995 | $1,350 | $1.36 | 14d | 1 | 0.50mi |
| 509 Famcee Ave Tallahassee, FL | 3.0 | 2.0 | 1079 | $1,700 | $1.58 | 21d | 1 | 0.52mi |
| 635 Palm Beach St Apt 125 Tallahassee, FL | 2.0 | 2.0 | 900 | $900 | $1.00 | 21d | 1 | 0.66mi |
| 2506 Sir Williams St Tallahassee, FL | 3.0 | 2.0 | 1662 | $2,050 | $1.23 | 21d | 1 | 0.71mi |
| 1240 Levy Ave Tallahassee, FL | 3.0 | 1.0 | 1290 | $1,350 | $1.05 | 21d | 1 | 0.80mi |
| 3000 S Adams St Tallahassee, FL | 1.0–3.0 | 1.0–3.0 | 884 | $1,850 | $2.09 | 21d | 8 | 0.91mi |
| 1616 McCaskill Ave Tallahassee, FL | 1.0–2.0 | 1.0 | 750 | $969 | $1.29 | 21d | 43 | 1.06mi |
| 1315 Pinellas St Tallahassee, FL | 3.0 | 3.0 | 1197 | $1,450 | $1.21 | 21d | 1 | 1.22mi |
| 401 Putnam Dr Tallahassee, FL | 1.0–2.0 | 1.0–2.0 | 766 | $1,250 | $1.63 | 21d | 1 | 1.28mi |
| 2205 Magnolia Cir Tallahassee, FL | 1.0–2.0 | 1.0–2.0 | 750 | $1,225 | $1.63 | 14d | 9 | 1.32mi |
| 2205 Magnolia Cir Tallahassee, FL | 1.0–2.0 | 1.0–2.0 | 750 | $1,225 | $1.63 | 21d | 1 | 1.32mi |
| 2218 Magnolia Cir Tallahassee, FL | 1.0–2.0 | 1.0–2.0 | 700 | $1,200 | $1.71 | 21d | 7 | 1.33mi |
| 1615 Sharkey St Tallahassee, FL | 4.0 | 2.0 | 1278 | $1,600 | $1.25 | 21d | 1 | 1.36mi |
| 3005 S Meridian St Tallahassee, FL | 3.0 | 1.0 | 998 | $2,300 | $2.30 | 21d | 1 | 1.38mi |
| 1643 Sharkey St Tallahassee, FL | 3.0 | 1.0 | 912 | $1,350 | $1.48 | 21d | 1 | 1.40mi |
| 402 Perkins St Tallahassee, FL | 4.0 | 2.0 | 1686 | $1,850 | $1.10 | 21d | 1 | 1.41mi |
| 1303 Airport Dr Unit A08 Tallahassee, FL | 2.0 | 2.5 | 1083 | $1,475 | $1.36 | 21d | 1 | 1.43mi |
| 418 Perkins St Tallahassee, FL | 4.0 | 2.0 | 1497 | $1,850 | $1.24 | 21d | 1 | 1.44mi |
| 1504 S Adams St #1 Tallahassee, FL | 2.0 | 2.0 | 1088 | $1,300 | $1.19 | 14d | 1 | 1.45mi |
| 1606 Airport Dr Tallahassee, FL | 3.0 | 2.0 | 1008 | $1,395 | $1.38 | 21d | 1 | 1.46mi |
| 1327 Jackson Bluff Rd Tallahassee, FL | 2.0–4.0 | 2.0 | 1450 | $685 | $0.47 | 21d | 1 | 1.49mi |
Listing history 21 events
-
2026-06-18days on market $194,900 Active 154 DOM
-
2026-06-17days on market $194,900 Active 153 DOM
-
2026-06-16days on market $194,900 Active 152 DOM
-
2026-06-15days on market $194,900 Active 151 DOM
-
2026-06-14days on market $194,900 Active 149 DOM
-
2026-06-10days on market $194,900 Active 146 DOM
-
2026-06-09days on market $194,900 Active 145 DOM
-
2026-06-08days on market $194,900 Active 144 DOM
-
2026-06-07days on market $194,900 Active 143 DOM
-
2026-06-05days on market $194,900 Active 140 DOM
-
2026-06-03days on market $194,900 Active 139 DOM
-
2026-06-02days on market $194,900 Active 138 DOM
-
2026-06-01days on market $194,900 Active 137 DOM
-
2026-05-31days on market $194,900 Active 136 DOM
-
2026-05-30days on market $194,900 Active 135 DOM
-
2026-03-20price $194,900
-
2026-03-06price $199,900
-
2026-02-18status Active
-
2026-02-05historical Active Under Contract
-
2026-01-15$204,900 Active
-
2004-06-15soldstatus $94,800
ⓘ Source: listings_history table (triggers on properties + properties_extension) + one-shot
backfill from property_details.listing_events for pre-trigger history.
Tax reassessment forecast FL · Resets to sale price
- Current annual tax
- $2,316 · $193/mo
- Projected year-2 tax
- $2,316 · $193/mo
- Expected delta
- $0/yr ($0/mo · 0.0%)
ⓘ Screening estimate from a state-policy table — verify with the county assessor before closing.
Climate risk First Street
- Flood 1/10 Low FEMA zone X (unshaded) · 0% chance over 30 yrs
- Wildfire 2/10 Low
- Heat 9/10 Extreme 7 d/yr ≥108°F today · 21 d/yr by 30 yrs out
- Wind 9/10 Extreme 99% chance of damaging wind over 30 yrs
- Air quality 4/10 Moderate 5 unhealthy d/yr today · 6 by 30 yrs out
Nearby sold comps map
Loading sold comps map…
Walkable amenities ~0.75 mi
Loading nearby amenities…
Taxation est. · year 1
- Rental income
- $20,273
- − Mortgage interest
- −$10,917
- − Property taxes
- −$2,316
- − Insurance
- −$974
- − Repairs & maintenance
- −$1,622
- − Management
- −$1,622
- − Depreciation
- −$5,670
- Taxable loss
- −$2,849
- Est. tax savings @ 24.0%
- +$684
- After-tax cash flow
- $1,143/yr
For passive investors: Depreciation is non-cash, so a rental often shows a tax loss while cash-flowing — sheltering income. Rental losses are passive: they offset passive income freely, and up to $25,000/yr can offset ordinary (W-2) income if you actively participate and your MAGI is under $100k (phasing out to $0 by $150k); unused losses carry forward. On sale, claimed depreciation is recaptured at up to 25%, and gains may owe capital-gains tax (a 1031 exchange can defer both). Figures are a year-1 estimate at your 24.0% rate — not tax advice; consult a CPA.
Schools (NCES district)
- District
- Leon
- NCES district ID
- 1201110
- Math proficiency
- 48% ▼ -13.00%
- Reading proficiency
- 53% ▼ -5.00%
- Median HH income
- $46,339
- Composite
- 42.84/100
- National rank
- #3131
- State rank
- #33 of 73 in FL
Livability — Tallahassee
- Score
- 86/100
- State rank
- #19
- US rank
- #429
Category grades
Schools grade is shown separately in the Schools card above.
Census & demographics
- Census place
- Tallahassee, FL
- County
- Leon County · 294,472 people
- City population
- 294,472
- Metro
- Tallahassee, FL
- Population (ZIP)
- 14,888
- Household income
- $38,288
- Rent vs Own
- Severe rent burden
- 1272.0
Population outlook (Leon County) Hauer SSP2
- Today (2025)
- 315,507 people
- By 2030
- 330,677 · +4.8%
- By 2040
- 358,465 · +13.6%
- By 2050
- 386,804 · +22.6%
- By 2075
- 465,480 · +47.5%
- By 2100
- 519,959 · +64.8%
Race, ethnicity, and origin ACS 2023
- Neighborhood character
- Diverse neighborhood (Simpson 0.61)
- Race & ethnicity
- Black 50% White 36% Hispanic / Latino 9% Two or more races 5%
- Hispanic origin (detail)
- Mexican 3%
- Common ancestry
- Italian 1% Lithuanian 1% Slovak 1%
- Foreign-born
- 4% · Canada
- Languages at home
- 92% English-only · Spanish 6% French/Haitian/Cajun 1% German/W. Germanic 1%
Political lean MEDSL · Leon
- 2024 margin
- Strong D (+21.8) · D 60.3% · R 38.5% · Other 1.2%
- 2008→2024 swing
- -2.5pp toward R · 2008: 24.3pp · 2024: 21.8pp
- All cycles
- 2024: D+21.8 2020: D+28.3 2016: D+25.1 2012: D+23.6 2008: D+24.3
Not yet ingested
- Civics
- —
Market trends
- HPI YoY
- ▼ -0.54%
- Current HPI
- 270.5721
- Rent YoY
- —
- Metro
- Tallahassee, FL
- State GDP YoY
- ▲ 3.28%
- F500 in state
- 36
Industry mix (Fortune 500 HQ in FL)
| Industry | F500 HQs | Revenue |
|---|---|---|
| Industrial Technology | 2 | $29B |
|
||
| Insurance | 2 | $17B |
|
||
| Retail | 1 | $60B |
|
||
| Technology Distribution | 1 | $58B |
|
||
| Homebuilding | 1 | $35B |
|
||
| Technology Manufacturing | 1 | $35B |
|
||
Price history
+105.6% since first listed6 events — show timeline
- 2026-03-20 Price Changed $194,900 CATRS
- 2026-03-06 Price Changed $199,900 CATRS
- 2026-02-18 Relisted — CATRS
- 2026-02-05 Contingent — CATRS
- 2026-01-15 Listed $204,900 CATRS
- 2004-06-15 Sold (Public Records) $94,800 Public Records
Property tax history
+3.2%/yrLatest (2025): $2,316 · +3.0% YoY. Source: county tax records.
Cash-flow waterfall
monthlySold comps — $/sqft
last 12 mo · ≤1 miLoading sold comps…