5 Arrowhead Dr · Waterloo, NY
Flood risk 1/10 · Minimal
- FEMA flood zone
- X
- Chance of flooding over 30 yrs
- 0.0%
- Est. flood insurance / yr
- $507 – $1,088
Fire risk 1/10 · Minimal
- Est. fire insurance / yr
- $691 – $1,283
Heat risk 3/10 · Minor
- Hot days now (above 97°F)
- 7 days/yr
- Hot days in 30 yrs
- 15 days/yr
Wind risk 1/10 · Minimal
- Chance of severe wind over 30 yrs
- 1.0%
Air-quality risk 2/10 · Minimal
- Unhealthy air days now
- 0 days/yr
- Unhealthy air days in 30 yrs
- 1 days/yr
Risk factors via First Street. Map © Google.
Why this score? — see what drove the B grade
The composite is a weighted blend of 9 inputs, each scored 0–100. Each bar is that input's sub-score; the figure is the points it added to the 100-point composite (weight × sub-score).
- Cash flow +30.0/30.0
- 1% rule +10.0/10.0
- DSCR +10.0/10.0
- ARV discount +9.4/15.0
- Livability +3.8/5.0
- Schools +3.4/10.0
- Condition / age +2.8/5.0
- Rent growth +2.5/5.0
- Appreciation +0.0/10.0
$86,000
🖨 Deal sheet 📄 Offer letter ✓ Due diligence
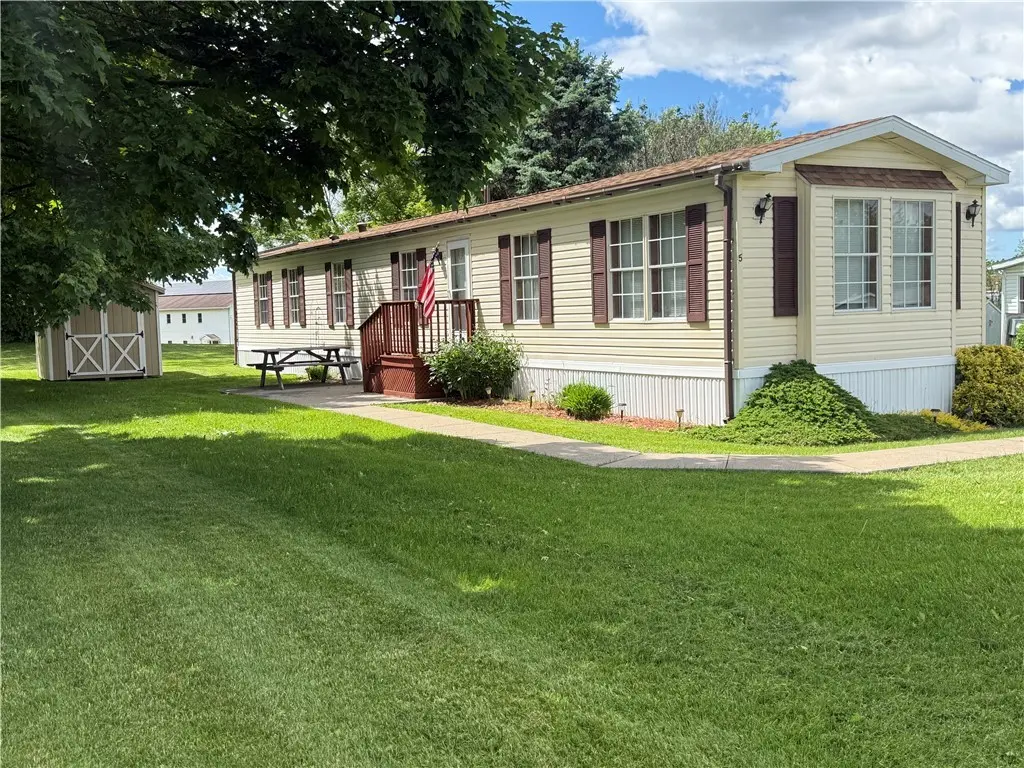
Listing remarks
Well-loved by one owner, this spacious single-wide manufactured home is set in the beautiful and welcoming Indian Hills community, established in 1993. Enjoy a peaceful setting with a nicely manicured yard, mature trees and shrubbery, a newer shed, concrete walkways, a concrete picnic area, and a double-wide blacktop driveway leading right to the door. Inside, the large owner’s suite offers a generous closet, full bath with garden tub, separate shower, private toilet area, large vanity, and plenty of cabinet space. The additional bedroom is a comfortable size with closet space. You’ll love the bright living room with carpeting, ceiling fan, and fresh white paint, plus the eat-in
Key facts
- Newer shed
- Manicured yard
- Mature trees
Tags
Property features AI
Finance
- HOA & community: Land lease of $395
Exterior
- Parking: Carport; Driveway; No garage
- Utilities: High-speed internet available; Public water connected; Sewer connected; Circuit breaker electric
- Home design: Single-story; Single wide mobile home; Existing/resale condition; Entry faces city street
- Construction: Vinyl siding; Asphalt roof; Pillar/post/pier and slab foundation; Built by Redman
- Exterior features: Blacktop driveway; Shed(s) / storage
Interior
- Kitchen: Gas oven; Gas range; Refrigerator; Eat-in kitchen with breakfast bar
- Bedrooms: 2 bedrooms on the main level
- Flooring: Carpet; Varies
- Bathrooms: 1 full bathroom on the main level
- Heating & cooling: Gas forced air heating; Central air conditioning
- Interior features: Breakfast bar; Ceiling fan(s); Den; Eat-in kitchen; Separate/formal living room; Bedroom on main level; 5 total rooms
- Laundry & utility: Washer and dryer on the main level; Gas water heater
Neighborhood map
What this means for you Summary
Snapshot
- This is a 2-bed/2.0-bath manufactured listed at $86k. Condition is rated average.
Deal economics
- At list price, monthly cash flow is $459 ($6k/yr) — positive.
- The deal already cash-flows at list — no discount required.
- Meets the 1% rule at list price ($1k rent vs $86k).
- Recommended offer: $85k (1.5% below list) — sets the bar for market timing.
- Cap rate 12.7% vs local median 4.8% in Waterloo — top-decile yield for the area; either an underpriced asset or a hidden risk that comps aren't pricing in. Stress-test before assuming the spread holds.
Location & tenants
- Location reads 75/100 on livability (#268 in NY, #4,240 nationally) — a middle-class / working-renter tenant base. Strengths: cost of living A+, housing A+, health & safety A+; Watch: schools C-, amenities F, commute F.
- Waterloo Central School District (town): math 37% / reading 43% proficiency, ranked #525 of 590 in NY (top 89%) — families likely to look elsewhere, expect single-tenant / working-renter base with shorter leases.
- Market conditions: 38 active listings in the ZIP; 48 units permitted in Seneca County in 2024 (0 in 5+ unit buildings).
Forward outlook
- Local home prices are declining (-3.0%/yr); year-one equity from $595 of loan paydown is wiped out by about $3k of value loss. Plan a longer hold.
- Seneca County population projected at -14% by 2050 — secular population decline; favor cash flow + early exit over multi-decade hold.
- At projected returns (-3.0% appreciation + 3.0% rent growth), your $24k cash investment doubles in ~6 years — after that, you're playing with house money.
Negotiation context
- It's been on market 21 days — a 2% lower offer ($85k) is reasonable based on typical stale-listing flexibility.
Questions for the listing agent
- Is there a deadline driving the sale (1031 exchange, divorce, estate, relocation)? That informs how much negotiation room exists.
- What's the average days-on-market for RENTAL listings here right now (not sales)? A rising rental-DOM trend means longer vacancies and softer asking-rent achievability than the comps imply.
- What's the recent tenant-quality profile in this submarket — average credit score on applications, eviction rate, late-payment / NSF rate, and stable-employment percentage? A property-management company in the area should have these aggregated.
- How much new for-sale + rental construction is in the pipeline within 1–3 miles? Heavy new supply typically softens prices + rents 12–24 months out; constrained supply supports both.
Investment metrics
- 1% rule
- 1.55% ✓
- Cap rate
- 12.70%
- Cash-on-cash
- 22.89%
- DSCR
- 2.02
- GRM
- 5.4
CMA / ARV
- ARV (on-the-fly)
- $89,760
- Comps found
- 1
Show comp detail 1 sale within ~0.75 mi
| Address | Dist | Beds/Ba | Sqft | Sold | Price | $/sf | Match |
|---|---|---|---|---|---|---|---|
| 14 Indian Hills Dr | 0.18mi | 2/2.0 | 1,064 (+1%) | 2mo | $90,000 | $85 | 89 |
Match score weights: distance 35% · size 25% · config 20% · recency 20%. Top-matched comps best support the ARV.
Projected returns pro-forma
-3.0% appreciation · 3.0% rent growth · sell at horizon
- IRR
- 15.8%
- Equity multiple
- 1.64×
- Total profit
- $15,333
- Equity at exit
- $12,823
- IRR
- 24.5%
- Equity multiple
- 3.12×
- Total profit
- $51,096
- Equity at exit
- $7,436
Cash invested: $24,080 (down + closing). Projections, not guarantees.
Landlord ↔ Tenant lean methodology
- Overall (STATE)
- 15 Strongly Tenant-Friendly
- State New York
- 15 Strongly Tenant-Friendly · D+10
- County
- — inherits STATE
- City
- — inherits STATE
ZIP-level market 13165
- Home prices YoY
- -20.7%
- Active inventory
- 38
- Price-to-rent
- 5.4×
Monthly cashflow live
- Estimated rent
- $1,334 medium interval (Pro) →
- Mortgage (P&I)
- −$451
- Tax est. 1.5%
- −$108 /mo · $1,290/yr
- Insurance
- −$36
- HOA
- −$0
- Vacancy / Maint / Mgmt
- −$280
- Net cashflow
- $459
Break-even live
UW: 25.0% down · 7.5% · 30yr · 1.5% tax · 5.0% vac · 8.0% maint · 8.0% mgmt
Financing live
Cash to close
- Down payment
- $21,500
- Closing costs
- $2,580
- Reserves months
- —
- Total cash needed
- —
Loan-product check · same deal, 3 products live
Conventional
25% down · 7.5% · 30yr
- Down + closing
- —
- Monthly P&I
- —
- Monthly cashflow
- —
- DSCR
- —
- Eligible?
- —
Personal DTI + credit; lowest rate.
DSCR
20% down · 8.5% · 30yr
- Down + closing
- —
- Monthly P&I
- —
- Monthly cashflow
- —
- DSCR
- —
- Eligible?
- —
No personal income docs; deal must DSCR.
Hard money
10% down · 12.0% · 12mo
- Down + closing
- —
- Monthly P&I
- —
- Monthly cashflow
- —
- DSCR
- —
- Eligible?
- —
Short-term bridge; refi at stabilization.
Listing history 15 events
-
2026-06-18days on market $86,000 Active 21 DOM
-
2026-06-17days on market $86,000 Active 20 DOM
-
2026-06-16days on market $86,000 Active 19 DOM
-
2026-06-15days on market $86,000 Active 18 DOM
-
2026-06-13days on market $86,000 Active 16 DOM
-
2026-06-12pricedays on market $86,000 Active 15 DOM
-
2026-06-09days on market $94,000 Active 12 DOM
-
2026-06-08days on market $94,000 Active 11 DOM
-
2026-06-07days on market $94,000 Active 10 DOM
-
2026-06-07days on market $94,000 Active 9 DOM
-
2026-06-04days on market $94,000 Active 6 DOM
-
2026-06-02days on market $94,000 Active 5 DOM
-
2026-06-01days on market $94,000 Active 4 DOM
-
2026-05-31days on market $94,000 Active 3 DOM
-
2026-05-28$94,000 Active
ⓘ Source: listings_history table (triggers on properties + properties_extension) + one-shot
backfill from property_details.listing_events for pre-trigger history.
Climate risk First Street
- Flood 1/10 Low FEMA zone X · 0% chance over 30 yrs
- Wildfire 1/10 Low
- Heat 3/10 Moderate 7 d/yr ≥97°F today · 15 d/yr by 30 yrs out
- Wind 1/10 Low 100% chance of damaging wind over 30 yrs
- Air quality 2/10 Low 0 unhealthy d/yr today · 1 by 30 yrs out
Nearby sold comps map
Loading sold comps map…
Walkable amenities ~0.75 mi
Loading nearby amenities…
Taxation est. · year 1
- Rental income
- $16,003
- − Mortgage interest
- −$4,817
- − Property taxes
- −$1,290
- − Insurance
- −$430
- − Repairs & maintenance
- −$1,280
- − Management
- −$1,280
- − Depreciation
- −$2,502
- Taxable income
- $4,404
- Est. tax owed @ 24.0%
- −$1,057
- After-tax cash flow
- $4,454/yr
For passive investors: Depreciation is non-cash, so a rental often shows a tax loss while cash-flowing — sheltering income. Rental losses are passive: they offset passive income freely, and up to $25,000/yr can offset ordinary (W-2) income if you actively participate and your MAGI is under $100k (phasing out to $0 by $150k); unused losses carry forward. On sale, claimed depreciation is recaptured at up to 25%, and gains may owe capital-gains tax (a 1031 exchange can defer both). Figures are a year-1 estimate at your 24.0% rate — not tax advice; consult a CPA.
Condition & rehab AI · 2 photos
A well-maintained single-wide manufactured home with good exterior and landscaping, but some minor repairs and touch-ups are needed to maximize its value.
Repairs flagged
- Minor Landscaping — Some areas of the yard could benefit from trimming
- Minor Paint — Some areas of the siding and trim could benefit from touch-up
Value-add opportunities
- Both Painting the exterior — Fresh paint enhances curb appeal and value
- Both Landscaping improvements — Well-maintained landscaping increases curb appeal and rental value
Renovation cost estimate screening
| Repair item | Severity | Est. cost |
|---|---|---|
| Landscaping · Some areas of the yard could benefit from trimming | Minor | $500–3,000 |
| Paint · Some areas of the siding and trim could benefit from touch-up | Minor | $500–3,000 |
| Total estimated repair cost · 2 items | $1,000–6,000 |
Value-add ROI direction
- Both Painting the exterior — Fresh paint enhances curb appeal and value ↑
- Both Landscaping improvements — Well-maintained landscaping increases curb appeal and rental value ↑
ⓘ Cost ranges are severity-bucket heuristics (US national rule-of-thumb). Get contractor quotes + a written scope before underwriting a rehab budget.
Schools (NCES district)
- District
- Waterloo Central School District
- NCES district ID
- 3600014
- Math proficiency
- 37% ▼ -9.00%
- Reading proficiency
- 43% ▲ 11.00%
- Median HH income
- $46,726
- Composite
- 34.16/100
- National rank
- #5278
- State rank
- #525 of 590 in NY
Livability — Waterloo
- Score
- 75/100
- State rank
- #268
- US rank
- #4240
Category grades
Schools grade is shown separately in the Schools card above.
Census & demographics
- Census place
- Waterloo, NY
- Population (ZIP)
- 9,429
Population outlook (Seneca County) Hauer SSP2
- Today (2025)
- 33,457 people
- By 2030
- 32,540 · -2.7%
- By 2040
- 30,680 · -8.3%
- By 2050
- 28,875 · -13.7%
- By 2075
- 24,757 · -26.0%
- By 2100
- 19,591 · -41.4%
Race, ethnicity, and origin ACS 2023
- Neighborhood character
- Predominantly White (89%)
- Race & ethnicity
- White 89% Two or more races 8% Hispanic / Latino 6% Black 1%
- Hispanic origin (detail)
- Mexican 1% Puerto Rican 2%
- Common ancestry
- Slovak 4% Iranian 3% Lithuanian 3%
- Foreign-born
- 4% · Canada, Jamaica
- Languages at home
- 93% English-only · Spanish 4% German/W. Germanic 2%
Political lean MEDSL · Seneca
- 2024 margin
- R (+11.8) · D 44.1% · R 55.9%
- 2008→2024 swing
- -14.4pp toward R · 2008: 2.6pp · 2024: -11.8pp
- All cycles
- 2024: R+11.8 2020: R+9.1 2016: R+12.1 2012: D+9.2 2008: D+2.6
Not yet ingested
- Civics
- —
Market trends
- HPI YoY
- ▼ -67.17%
- Current HPI
- 257.272
- Rent YoY
- —
- Metro
- —
- State GDP YoY
- ▲ 2.60%
- F500 in state
- 92
Industry mix (Fortune 500 HQ in NY)
| Industry | F500 HQs | Revenue |
|---|---|---|
| Financial Services | 10 | $950B |
|
||
| Consumer Goods | 9 | $162B |
|
||
| Insurance | 4 | $225B |
|
||
| Telecommunications | 2 | $144B |
|
||
| Pharmaceuticals | 2 | $112B |
|
||
| Media / Entertainment | 2 | $69B |
|
||
Price history
1 event — show timeline
- 2026-05-28 Listed $94,000 UNYREIS
Cash-flow waterfall
monthlySold comps — $/sqft
last 12 mo · ≤1 miLoading sold comps…