 Duplex
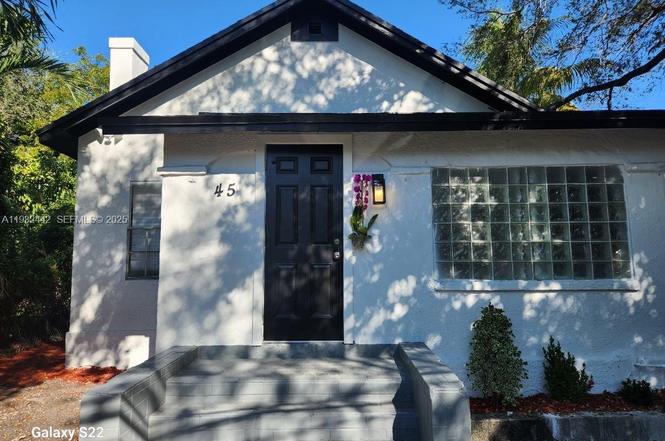
45 NE 60 St · Miami, FL
Flood risk 3/10 · Minor
- FEMA flood zone
- X (unshaded)
- Chance of flooding over 30 yrs
- 0.12%
- Est. flood insurance / yr
- $507 – $1,088
Fire risk 1/10 · Minimal
- Est. fire insurance / yr
- $947 – $1,759
Heat risk 10/10 · Severe
- Hot days now (above 103°F)
- 7 days/yr
- Hot days in 30 yrs
- 29 days/yr
Wind risk 10/10 · Severe
- Chance of severe wind over 30 yrs
- 99.0%
Air-quality risk 2/10 · Minimal
- Unhealthy air days now
- 1 days/yr
- Unhealthy air days in 30 yrs
- 1 days/yr
Risk factors via First Street. Map © Google.
Why this score? — see what drove the B+ grade
The composite is a weighted blend of 9 inputs, each scored 0–100. Each bar is that input's sub-score; the figure is the points it added to the 100-point composite (weight × sub-score).
- Cash flow +30.0/30.0
- 1% rule +10.0/10.0
- DSCR +10.0/10.0
- ARV discount +7.5/15.0
- Appreciation +5.1/10.0
- Schools +4.2/10.0
- Livability +3.9/5.0
- Rent growth +3.2/5.0
- Condition / age +2.5/5.0
$579,500
🖨 Deal sheet 📄 Offer letter ✓ Due diligence
Multi-family units
County records classify this as Multi-Family (2-4 Unit). Listing-text estimate: 2 units. confirmed
Listing remarks MLS
A gem waiting to be found... 3/2 and 1/1 detached. vacant and presently used as a storage for owners collection.Fairly new roof on both buildings. Fully fenced corner lot . Realtors please find your creative investors . Seller is offering concession to third party participants.Please call or text listing agent for access.
Key facts
- Separate duplex
- Turnkey asset
- Corner lot
Tags
Property features AI
Exterior
- Parking: Two total parking spaces (on-street)
- Utilities: Cable available; Public sewer
- Home design: Single-story building
- Construction: Block construction; Shingle roof; Resale property
- Exterior features: Less than quarter acre lot; On-street parking
Interior
- Bedrooms: One 1-bedroom unit; One 3-bedroom unit
- Flooring: Hardwood; Tile; Wood
- Bathrooms: One 1-bath unit; One 2-bath unit (both full bathrooms)
- Heating & cooling: Central heating; Central air conditioning
- Interior features: Hardwood, tile and wood flooring
Neighborhood map
What this means for you Summary
Snapshot
- This is a 2 × 2-bed/2.0-bath units multifamily listed at $580k.
Deal economics
- At list price, monthly cash flow is $3k ($40k/yr) — positive. Per door: $2k/mo.
- The deal already cash-flows at list — no discount required.
- Meets the 1% rule at list price ($9k rent vs $580k).
- Recommended offer: $510k (12.0% below list) — sets the bar for market timing.
- Cap rate 13.2% vs local median 1.9% in Miami — top-decile yield for the area; either an underpriced asset or a hidden risk that comps aren't pricing in. Stress-test before assuming the spread holds.
Location & tenants
- Location reads 78/100 on livability (#177 in FL, #2,724 nationally) — a middle-class / working-renter tenant base. Strengths: amenities A+, commute A+, health & safety A+; Watch: employment C-, crime F, cost of living F.
- Miami-Dade (suburban): math 45% / reading 54% proficiency, ranked #40 of 73 in FL (top 55%) — families likely to look elsewhere, expect single-tenant / working-renter base with shorter leases; 64% free/reduced lunch — lower-income household profile, screen leases tightly.
- Market conditions: Rents rising (+2.7%/yr); 757 active listings in the ZIP; solid renter incomes; 10,051 units permitted in Miami-Dade County in 2024 (7,758 in 5+ unit buildings).
Forward outlook
- In year one you build about $6k of equity ($4k loan paydown + $2k appreciation (0.3% local appreciation)).
- Miami-Dade County population projected at +28% by 2050 — long-run rental-demand tailwind backs the buy-and-hold thesis.
- At projected returns (0.3% appreciation + 2.7% rent growth), your $162k cash investment doubles in ~4 years — after that, you're playing with house money.
- By year 6, paydown + projected appreciation supports a ~$36k cash-out refi (75% LTV) — recoverable capital for the next deal without selling this one.
Negotiation context
- It's been on market 124 days — a 12% lower offer ($510k) is reasonable based on typical stale-listing flexibility.
- 3 sale attempts with the ask held roughly flat each time — persistent listings suggest the price (not the market) is what's stuck; bring a comps-based counter.
- Current owner paid $375k; list at $580k implies a 55% gain — meaningful room to come down on a strong offer.
Risks & watch-outs
- Watch-outs: built in 1939 — expect roof / HVAC / electrical / plumbing capex.
- Climate carrying-cost: severe wind risk, 99% chance of damaging wind over 30y; extreme-heat days projected 7→29/yr by 2055 (HVAC capex compounding) — expect insurance premiums to compound above CPI over the hold.
Questions for the listing agent
- It's been on market 124 days. Have you received any prior offers? Is the seller open to a 12% concession, seller financing, or rate buy-down credit?
- Can we see the unit-by-unit rent roll, current vacancy, and any below-market leases? What's the average tenancy length?
- What capital expenditures (roof, boiler, parking lot, exteriors) have been made in the last 5 years, and what's planned in the next 2?
- Built in 1939 — when were the roof, HVAC, electrical panel, plumbing, and water heater last replaced?
- Why hasn't it sold? Are there any deal-killer items the seller is aware of (foundation, flood, title, zoning, code violations)?
- Is there a deadline driving the sale (1031 exchange, divorce, estate, relocation)? That informs how much negotiation room exists.
- Schools are B-rated — typically a magnet for longer-tenancy family renters. What's the average tenant stay here, and is there a school-zone premium baked into asking?
- Crime grade is F in this area — have there been break-ins, vandalism, or insurance claims at this property in the last 3 years? What carrier currently insures it and at what premium?
- What's the average days-on-market for RENTAL listings here right now (not sales)? A rising rental-DOM trend means longer vacancies and softer asking-rent achievability than the comps imply.
- What's the recent tenant-quality profile in this submarket — average credit score on applications, eviction rate, late-payment / NSF rate, and stable-employment percentage? A property-management company in the area should have these aggregated.
- How much new apartment / multifamily construction is in the pipeline within 1–3 miles? Heavy new supply (>2% of stock underway) typically softens rents 12–24 months out; light construction supports rent growth.
Investment metrics
- 1% rule
- 1.55% ✓
- Cap rate
- 13.20%
- Cash-on-cash
- 24.68%
- DSCR
- 2.10
- GRM
- 5.4
CMA / ARV
No comps found within radius.
Projected returns pro-forma
0.27% appreciation · 2.73% rent growth · sell at horizon
- IRR
- 25.2%
- Equity multiple
- 2.24×
- Total profit
- $200,602
- Equity at exit
- $176,190
- IRR
- 28.6%
- Equity multiple
- 4.22×
- Total profit
- $522,937
- Equity at exit
- $218,218
Cash invested: $162,260 (down + closing). Projections, not guarantees.
Landlord ↔ Tenant lean methodology
- Overall (STATE)
- 87 Strongly Landlord-Friendly
- State Florida
- 87 Strongly Landlord-Friendly · R+3
- County
- — inherits STATE
- City
- — inherits STATE
ZIP-level market 33137
- Home prices YoY
- 0.1%
- Rents YoY
- 2.7%
- Active inventory
- 757
- Price-to-rent
- 10.7×
Monthly cashflow live
- Estimated rent
- $9,007 medium interval (Pro) →
- Mortgage (P&I)
- −$3,039
- Tax from tax record
- −$498 /mo · $5,974/yr
- Insurance
- −$241
- HOA
- −$0
- Vacancy / Maint / Mgmt
- −$1,891
- Net cashflow
- $3,337
Break-even live
2-unit breakdown (identical units grouped — click to expand)
| Units | Beds | Baths | Est. rent |
|---|---|---|---|
| 2× units | 2 | 2 | $9,008 |
| #1 | 2 | 2 | $4,504 |
| #2 | 2 | 2 | $4,504 |
| Total (2 units) | $9,007 | ||
UW: 25.0% down · 7.5% · 30yr · 1.5% tax · 5.0% vac · 8.0% maint · 8.0% mgmt
Financing live
Cash to close
- Down payment
- $144,875
- Closing costs
- $17,385
- Reserves months
- —
- Total cash needed
- —
Loan-product check · same deal, 3 products live
Conventional
25% down · 7.5% · 30yr
- Down + closing
- —
- Monthly P&I
- —
- Monthly cashflow
- —
- DSCR
- —
- Eligible?
- —
Personal DTI + credit; lowest rate.
DSCR
20% down · 8.5% · 30yr
- Down + closing
- —
- Monthly P&I
- —
- Monthly cashflow
- —
- DSCR
- —
- Eligible?
- —
No personal income docs; deal must DSCR.
Hard money
10% down · 12.0% · 12mo
- Down + closing
- —
- Monthly P&I
- —
- Monthly cashflow
- —
- DSCR
- —
- Eligible?
- —
Short-term bridge; refi at stabilization.
Listing history 20 events
-
2026-04-27status Pending
-
2026-04-09historical Active Under Contract
-
2026-03-15price $579,500
-
2026-03-13price $594,900
-
2026-03-03price $599,900
-
2026-02-26status Active
-
2026-02-25historical Active Under Contract
-
2026-02-18status Pending
-
2026-01-29price $585,000
-
2026-01-29price $500,000
-
2025-12-17$590,000 Active
-
2025-10-31soldstatus $375,000
-
2025-10-28soldstatus $375,000 324-char remark
Show marketing remark (324 chars)
A gem waiting to be found... 3/2 and 1/1 detached. vacant and presently used as a storage for owners collection.Fairly new roof on both buildings. Fully fenced corner lot . Realtors please find your creative investors . Seller is offering concession to third party participants.Please call or text listing agent for access.
-
2025-09-02$550,000 324-char remark
Show marketing remark (324 chars)
A gem waiting to be found... 3/2 and 1/1 detached. vacant and presently used as a storage for owners collection.Fairly new roof on both buildings. Fully fenced corner lot . Realtors please find your creative investors . Seller is offering concession to third party participants.Please call or text listing agent for access.
-
2000-08-04soldstatus $58,600
-
1996-05-29soldstatus $21,500
-
1990-02-21soldstatus $25,000
-
1987-06-01soldstatus $17,000
-
1983-11-01soldstatus $26,500
-
1980-06-01soldstatus $22,000
ⓘ Source: listings_history table (triggers on properties + properties_extension) + one-shot
backfill from property_details.listing_events for pre-trigger history.
Tax reassessment forecast FL · Resets to sale price
- Current annual tax
- $5,974 · $498/mo
- Projected year-2 tax
- $5,974 · $498/mo
- Expected delta
- $0/yr ($0/mo · 0.0%)
ⓘ Screening estimate from a state-policy table — verify with the county assessor before closing.
Climate risk First Street
- Flood 3/10 Moderate FEMA zone X (unshaded) · 12% chance over 30 yrs
- Wildfire 1/10 Low
- Heat 10/10 Extreme 7 d/yr ≥103°F today · 29 d/yr by 30 yrs out
- Wind 10/10 Extreme 99% chance of damaging wind over 30 yrs
- Air quality 2/10 Low 1 unhealthy d/yr today · 1 by 30 yrs out
Nearby sold comps map
Loading sold comps map…
Walkable amenities ~0.75 mi
Loading nearby amenities…
Taxation est. · year 1
- Rental income
- $108,084
- − Mortgage interest
- −$32,461
- − Property taxes
- −$5,974
- − Insurance
- −$2,898
- − Repairs & maintenance
- −$8,647
- − Management
- −$8,647
- − Depreciation
- −$16,858
- Taxable income
- $32,600
- Est. tax owed @ 24.0%
- −$7,824
- After-tax cash flow
- $32,223/yr
For passive investors: Depreciation is non-cash, so a rental often shows a tax loss while cash-flowing — sheltering income. Rental losses are passive: they offset passive income freely, and up to $25,000/yr can offset ordinary (W-2) income if you actively participate and your MAGI is under $100k (phasing out to $0 by $150k); unused losses carry forward. On sale, claimed depreciation is recaptured at up to 25%, and gains may owe capital-gains tax (a 1031 exchange can defer both). Figures are a year-1 estimate at your 24.0% rate — not tax advice; consult a CPA.
Schools (NCES district)
- District
- Miami-Dade
- NCES district ID
- 1200390
- Math proficiency
- 45% ▼ -16.00%
- Reading proficiency
- 54% ▼ -5.00%
- Median HH income
- $43,928
- Composite
- 41.76/100
- National rank
- #3397
- State rank
- #40 of 73 in FL
Livability — Miami
- Score
- 78/100
- State rank
- #177
- US rank
- #2724
Category grades
Schools grade is shown separately in the Schools card above.
Census & demographics
- Census place
- Miami, FL
- County
- Miami-Dade County · 2,697,751 people
- City population
- 827,308
- Metro
- Miami-Fort Lauderdale-Pompano Beach, FL
- Population (ZIP)
- 29,414
- Household income
- $94,036
- Rent vs Own
- Severe rent burden
- 3106.0
Population outlook (Miami-Dade County) Hauer SSP2
- Today (2025)
- 3,126,439 people
- By 2030
- 3,325,765 · +6.4%
- By 2040
- 3,697,561 · +18.3%
- By 2050
- 4,012,134 · +28.3%
- By 2075
- 4,605,612 · +47.3%
- By 2100
- 4,866,598 · +55.7%
Race, ethnicity, and origin ACS 2023
- Neighborhood character
- Diverse neighborhood (Simpson 0.63)
- Race & ethnicity
- Hispanic / Latino 54% Two or more races 25% White 24% Black 16% Asian 2%
- Hispanic origin (detail)
- Mexican 1% Puerto Rican 5% Cuban 10% Dominican 3% Salvadoran 3%
- Common ancestry
- Hispanic 8% Estonian 2% Lithuanian 2%
- Foreign-born
- 47% · Canada, Jamaica, Dominican Republic
- Languages at home
- 34% English-only · Spanish 49% French/Haitian/Cajun 8% Other Indo-European 5%
Political lean MEDSL · Miami-Dade
- 2024 margin
- R (+11.4) · D 43.9% · R 55.4%
- 2008→2024 swing
- -27.6pp toward R · 2008: 16.1pp · 2024: -11.4pp
- All cycles
- 2024: R+11.4 2020: D+7.3 2016: D+29.6 2012: D+23.7 2008: D+16.1
Not yet ingested
- Civics
- —
Market trends
- HPI YoY
- ▲ 0.27%
- Current HPI
- 385.1514
- Rent YoY
- ▲ 2.73%
- Metro
- Miami-Fort Lauderdale-Pompano Beach, FL
- State GDP YoY
- ▲ 3.28%
- F500 in state
- 36
Industry mix (Fortune 500 HQ in FL)
| Industry | F500 HQs | Revenue |
|---|---|---|
| Industrial Technology | 2 | $29B |
|
||
| Insurance | 2 | $17B |
|
||
| Retail | 1 | $60B |
|
||
| Technology Distribution | 1 | $58B |
|
||
| Homebuilding | 1 | $35B |
|
||
| Technology Manufacturing | 1 | $35B |
|
||
Price history
+2534.1% since first listed20 events — show timeline
- 2026-04-27 Pending — MARMLS
- 2026-04-09 Contingent — MARMLS
- 2026-03-15 Price Changed $579,500 MARMLS
- 2026-03-13 Price Changed $594,900 MARMLS
- 2026-03-03 Price Changed $599,900 MARMLS
- 2026-02-26 Relisted — MARMLS
- 2026-02-25 Contingent — MARMLS
- 2026-02-18 Pending — MARMLS
- 2026-01-29 Price Changed $585,000 MARMLS
- 2026-01-29 Price Changed $500,000 MARMLS
- 2025-12-17 Listed $590,000 MARMLS
- 2025-10-31 Sold (Public Records) $375,000 Public Records
- 2025-10-28 Sold (MLS) $375,000 Beaches MLS
- 2025-09-02 Listed $550,000 Beaches MLS
- 2000-08-04 Sold (Public Records) $58,600 Public Records
- 1996-05-29 Sold (Public Records) $21,500 Public Records
- 1990-02-21 Sold (Public Records) $25,000 Public Records
- 1987-06-01 Sold (Public Records) $17,000 Public Records
- 1983-11-01 Sold (Public Records) $26,500 Public Records
- 1980-06-01 Sold (Public Records) $22,000 Public Records
Property tax history
+12.5%/yrLatest (2025): $5,974 · +7.3% YoY. Source: county tax records.
Cash-flow waterfall
monthlySold comps — $/sqft
last 12 mo · ≤1 miLoading sold comps…