 🏷️ Likely Rental
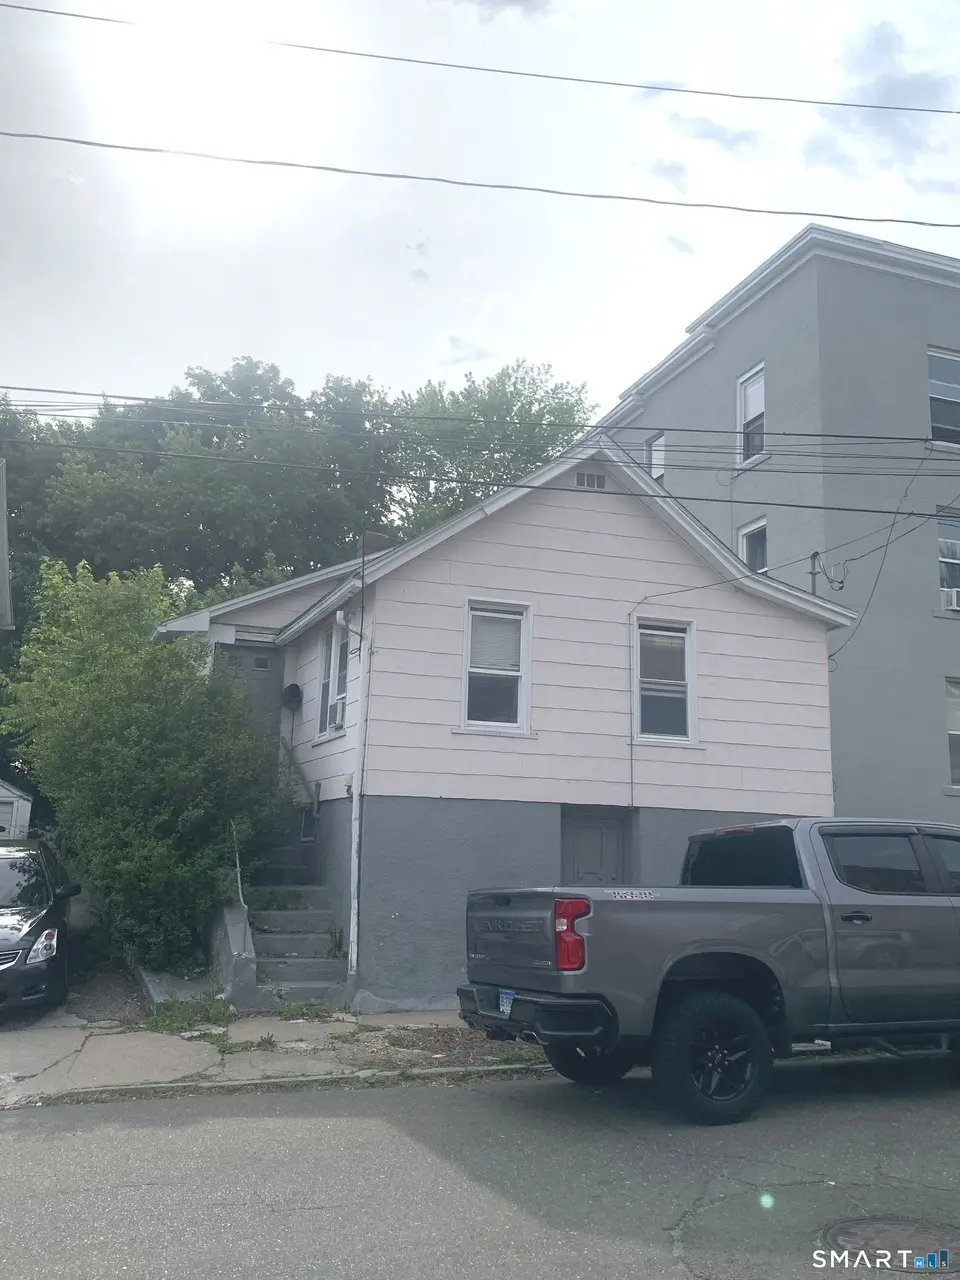
52 Hawkins St · Derby, CT
Flood risk 1/10 · Minimal
- FEMA flood zone
- X (unshaded)
- Chance of flooding over 30 yrs
- 0.0%
- Est. flood insurance / yr
- $473 – $860
Fire risk 1/10 · Minimal
- Est. fire insurance / yr
- $829 – $1,539
Heat risk 6/10 · Moderate
- Hot days now (above 98°F)
- 7 days/yr
- Hot days in 30 yrs
- 17 days/yr
Wind risk 6/10 · Moderate
- Chance of severe wind over 30 yrs
- 27.0%
Air-quality risk 4/10 · Minor
- Unhealthy air days now
- 4 days/yr
- Unhealthy air days in 30 yrs
- 6 days/yr
Risk factors via First Street. Map © Google.
Why this score? — see what drove the B- grade
The composite is a weighted blend of 9 inputs, each scored 0–100. Each bar is that input's sub-score; the figure is the points it added to the 100-point composite (weight × sub-score).
- Cash flow +25.8/30.0
- ARV discount +15.0/15.0
- DSCR +8.6/10.0
- 1% rule +7.2/10.0
- Livability +3.7/5.0
- Schools +2.6/10.0
- Rent growth +2.5/5.0
- Condition / age +2.5/5.0
- Appreciation +0.0/10.0
$140,000
🖨 Deal sheet 📄 Offer letter ✓ Due diligence
Listing remarks MLS
One Level Living In This Affordable 3 Bedroom Ranch-Currentlrented For $1000 Per Month. Nice Buy!
Key facts
- Private back yard
- 2,962 sq ft lot
- 2 garage spots
Tags
Property features AI
Finance
- Other: Home warranty offered
Exterior
- Parking: Detached garage; Driveway parking; Six total parking spaces; Two-car garage
- Utilities: Public water connected; Public sewer (in street); Oil fuel tank located in basement
- Home design: Single-family home
- Construction: Frame construction; Concrete foundation; Asphalt shingle roof; Vinyl siding
- Exterior features: Level lot; Paved driveway
Interior
- Bedrooms: Three bedrooms
- Bathrooms: One full bathroom
- Heating & cooling: Hot water heating (oil-fired); Window unit cooling; 30-gallon hot water tank
- Interior features: Six total rooms; Full basement
Neighborhood map
What this means for you Summary
Snapshot
- This is a 2-bed/1.0-bath single-family listed at $140k.
Deal economics
- At list price, monthly cash flow is $339 ($4k/yr) — positive.
- The deal already cash-flows at list — no discount required.
- Meets the 1% rule at list price ($2k rent vs $140k).
- Cap rate 9.2% vs local median 4.0% in Derby — top-decile yield for the area; either an underpriced asset or a hidden risk that comps aren't pricing in. Stress-test before assuming the spread holds.
Location & tenants
- Location reads 74/100 on livability (#64 in CT, #4,574 nationally) — a middle-class / working-renter tenant base. Strengths: housing A+, health & safety A+, cost of living B; Watch: crime D+, employment D+, schools D.
- Derby School District (suburban): math 22% / reading 36% proficiency, ranked #127 of 153 in CT (top 83%) — low school quality limits family demand, transient renter base, plan for 1-2y turnover.
- Market conditions: 39 active listings in the ZIP; 25 comparable units currently listed for rent nearby; rentals at typical pace (median 19d on market — plan ~3-4 weeks tenant-placement turnaround); solid renter incomes; 502 units permitted in Naugatuck Valley Planning Region in 2024 (171 in 5+ unit buildings).
Forward outlook
- Local home prices are declining (-3.0%/yr); year-one equity from $968 of loan paydown is wiped out by about $4k of value loss. Plan a longer hold.
Negotiation context
- Only 5 days on market — expect competitive offers; lowballing is unlikely to land.
- 3 sale attempts since 33y ago with the ask held roughly flat each time — persistent listings suggest the price (not the market) is what's stuck; bring a comps-based counter.
- Current owner paid $95k; 47% above their basis — modest negotiation headroom, anchor on the comps not their cost.
Risks & watch-outs
- Watch-outs: built in 1900 — expect roof / HVAC / electrical / plumbing capex.
- Climate carrying-cost: major wind risk, 27% chance of damaging wind over 30y; extreme-heat days projected 7→17/yr by 2055 (HVAC capex compounding) — expect insurance premiums to compound above CPI over the hold.
Questions for the listing agent
- Built in 1900 — when were the roof, HVAC, electrical panel, plumbing, and water heater last replaced?
- Is there a deadline driving the sale (1031 exchange, divorce, estate, relocation)? That informs how much negotiation room exists.
- Schools are D-rated, which usually means shorter tenancies and higher turnover. Who's the typical renter profile here, and what's been the actual vacancy rate?
- Crime grade is D in this area — have there been break-ins, vandalism, or insurance claims at this property in the last 3 years? What carrier currently insures it and at what premium?
- What's the average days-on-market for RENTAL listings here right now (not sales)? A rising rental-DOM trend means longer vacancies and softer asking-rent achievability than the comps imply.
- What's the recent tenant-quality profile in this submarket — average credit score on applications, eviction rate, late-payment / NSF rate, and stable-employment percentage? A property-management company in the area should have these aggregated.
- How much new for-sale + rental construction is in the pipeline within 1–3 miles? Heavy new supply typically softens prices + rents 12–24 months out; constrained supply supports both.
Investment metrics
- 1% rule
- 1.22% ✓
- Cap rate
- 9.20%
- Cash-on-cash
- 10.38%
- DSCR
- 1.46
- GRM
- 6.8
CMA / ARV
- ARV (on-the-fly)
- $175,143
- Comps found
- 1
Show comp detail 1 sale within ~0.75 mi
| Address | Dist | Beds/Ba | Sqft | Sold | Price | $/sf | Match |
|---|---|---|---|---|---|---|---|
| 50 Oak St | 0.12mi | 2/1.0 | 843 (+14%) | 8mo | $200,000 | $237 | 64 |
Match score weights: distance 35% · size 25% · config 20% · recency 20%. Top-matched comps best support the ARV.
Projected returns pro-forma
-3.0% appreciation · 3.0% rent growth · sell at horizon
- IRR
- -0.7%
- Equity multiple
- 0.97×
- Total profit
- $-1,040
- Equity at exit
- $20,874
- IRR
- 9.0%
- Equity multiple
- 1.69×
- Total profit
- $27,112
- Equity at exit
- $12,105
Cash invested: $39,200 (down + closing). Projections, not guarantees.
Landlord ↔ Tenant lean methodology
- Overall (STATE)
- 27 Tenant-Leaning
- State Connecticut
- 27 Tenant-Leaning · D+7
- County
- — inherits STATE
- City
- — inherits STATE
ZIP-level market 06418
- Home prices YoY
- -19.5%
- Active inventory
- 39
- Price-to-rent
- 6.8×
Monthly cashflow live
- Estimated rent
- $1,708 high interval (Pro) →
- Mortgage (P&I)
- −$734
- Tax from tax record
- −$218 /mo · $2,613/yr
- Insurance
- −$58
- HOA
- −$0
- Vacancy / Maint / Mgmt
- −$359
- Net cashflow
- $339
Break-even live
UW: 25.0% down · 7.5% · 30yr · 1.5% tax · 5.0% vac · 8.0% maint · 8.0% mgmt
Financing live
Cash to close
- Down payment
- $35,000
- Closing costs
- $4,200
- Reserves months
- —
- Total cash needed
- —
Loan-product check · same deal, 3 products live
Conventional
25% down · 7.5% · 30yr
- Down + closing
- —
- Monthly P&I
- —
- Monthly cashflow
- —
- DSCR
- —
- Eligible?
- —
Personal DTI + credit; lowest rate.
DSCR
20% down · 8.5% · 30yr
- Down + closing
- —
- Monthly P&I
- —
- Monthly cashflow
- —
- DSCR
- —
- Eligible?
- —
No personal income docs; deal must DSCR.
Hard money
10% down · 12.0% · 12mo
- Down + closing
- —
- Monthly P&I
- —
- Monthly cashflow
- —
- DSCR
- —
- Eligible?
- —
Short-term bridge; refi at stabilization.
Rent comps 25 comps
| Address | Beds | Baths | Sqft | Rent | $/sqft | DOM | Units | Dist |
|---|---|---|---|---|---|---|---|---|
| 180 Olivia St Unit 2B Derby, CT | 1.0 | 1.0 | 700 | $1,300 | $1.86 | 2d | 1 | 0.08mi |
| 27 8th St Unit first floor Derby, CT | 2.0 | 1.0 | 750 | $2,150 | $2.87 | 19d | 1 | 0.16mi |
| 58 Minerva St Derby, CT | 1.0 | 1.0 | 579 | $1,500 | $2.59 | 21d | 1 | 0.20mi |
| 137 Minerva St Unit 135 Derby, CT | 1.0 | 1.0 | 462 | $1,400 | $3.03 | 2d | 1 | 0.23mi |
| 74 4th St Unit 16 B Derby, CT | 1.0 | 1.0 | 600 | $1,400 | $2.33 | 43d | 1 | 0.25mi |
| 59 Elizabeth St Unit 59A Derby, CT | 1.0 | 1.0 | 579 | $1,500 | $2.59 | 23d | 1 | 0.32mi |
| 281 Canal St E Shelton, CT | 2.0 | 1.0–2.0 | 935 | $3,200 | $3.42 | 2d | 1 | 0.35mi |
| 45 Minerva St Unit 45-104 Derby, CT | 1.0 | 1.0 | 700 | $1,500 | $2.14 | 23d | 1 | 0.36mi |
| 45 Minerva St Derby, CT | 1.0 | 1.0 | 700 | $1,500 | $2.14 | 21d | 1 | 0.36mi |
| 185 Canal St Shelton, CT | 1.0–2.0 | 1.0–2.0 | 987 | $6,276 | $6.36 | 10d | 1 | 0.40mi |
| 565 Howe Ave Unit 1 F Shelton, CT | 1.0 | 1.0 | 700 | $1,495 | $2.14 | 2d | 1 | 0.42mi |
| 31 Atwater Ave Unit W Derby, CT | 1.0 | 1.0 | 750 | $1,750 | $2.33 | 19d | 1 | 0.44mi |
| 502 Howe Ave Unit 113 Shelton, CT | 1.0 | 1.0 | 670 | $1,700 | $2.54 | 3d | 1 | 0.50mi |
| 502 Howe Ave Unit 112 Shelton, CT | 1.0 | 1.0 | 673 | $1,775 | $2.64 | 3d | 1 | 0.50mi |
| 500 Howe Ave Unit 301 Shelton, CT | 1.0 | 1.0 | 590 | $1,550 | $2.63 | 23d | 1 | 0.51mi |
| 45 Derby Ave Derby, CT | 2.0 | 1.0 | 700 | $1,700 | $2.43 | 43d | 2 | 0.82mi |
| 50 Derby Ave Derby, CT | 2.0 | 1.0 | 700 | $1,600 | $2.29 | 23d | 1 | 0.84mi |
| 26 Cedric Ave Derby, CT | 2.0 | 1.0 | 617 | $1,300 | $2.11 | 11d | 1 | 0.92mi |
| 219 Howe Ave Unit 3L Shelton, CT | 2.0 | 1.0 | 700 | $1,650 | $2.36 | 43d | 1 | 0.93mi |
| 209 Howe Ave Shelton, CT | 1.0 | 1.0 | 650 | $1,500 | $2.31 | 43d | 1 | 0.94mi |
| 199 Howe Ave Unit 203 Shelton, CT | 2.0 | 1.0 | 725 | $1,650 | $2.28 | 14d | 1 | 0.95mi |
| 174 Coram Ave Unit 2B Shelton, CT | 2.0 | 1.0 | 700 | $1,950 | $2.79 | 23d | 1 | 0.98mi |
| 87 Kneen St Unit 3rd floor Shelton, CT | 2.0 | 1.0 | 725 | $1,350 | $1.86 | 11d | 1 | 1.09mi |
| 15 W Main St Ansonia, CT | 1.0 | 1.0 | 550 | $1,500 | $2.73 | 11d | 2 | 1.37mi |
| 202 Main St Unit 206-6 Ansonia, CT | 1.0 | 1.0 | 600 | $1,500 | $2.50 | 43d | 1 | 1.43mi |
Listing history 5 events
-
2026-06-17days on market $140,000 Active 5 DOM
-
2026-06-16days on market $140,000 Active 4 DOM
-
2026-06-15days on market $140,000 Active 3 DOM
-
2026-06-14remarks 114-char remark
-
2026-06-14$140,000 Active 1 DOM
ⓘ Source: listings_history table (triggers on properties + properties_extension) + one-shot
backfill from property_details.listing_events for pre-trigger history.
Tax reassessment forecast CT · Partial reset (capped growth)
- Current annual tax
- $2,613 · $218/mo
- Projected year-2 tax
- $2,804 · $234/mo
- Expected delta
- +$192/yr (+$16/mo · 7.3%)
ⓘ Screening estimate from a state-policy table — verify with the county assessor before closing.
Climate risk First Street
- Flood 1/10 Low FEMA zone X (unshaded) · 0% chance over 30 yrs
- Wildfire 1/10 Low
- Heat 6/10 Major 7 d/yr ≥98°F today · 17 d/yr by 30 yrs out
- Wind 6/10 Major 27% chance of damaging wind over 30 yrs
- Air quality 4/10 Moderate 4 unhealthy d/yr today · 6 by 30 yrs out
Nearby sold comps map
Loading sold comps map…
Walkable amenities ~0.75 mi
Loading nearby amenities…
Taxation est. · year 1
- Rental income
- $20,496
- − Mortgage interest
- −$7,842
- − Property taxes
- −$2,613
- − Insurance
- −$700
- − Repairs & maintenance
- −$1,640
- − Management
- −$1,640
- − Depreciation
- −$4,073
- Taxable income
- $1,989
- Est. tax owed @ 24.0%
- −$477
- After-tax cash flow
- $3,591/yr
For passive investors: Depreciation is non-cash, so a rental often shows a tax loss while cash-flowing — sheltering income. Rental losses are passive: they offset passive income freely, and up to $25,000/yr can offset ordinary (W-2) income if you actively participate and your MAGI is under $100k (phasing out to $0 by $150k); unused losses carry forward. On sale, claimed depreciation is recaptured at up to 25%, and gains may owe capital-gains tax (a 1031 exchange can defer both). Figures are a year-1 estimate at your 24.0% rate — not tax advice; consult a CPA.
Schools (NCES district)
- District
- Derby School District
- NCES district ID
- 0901110
- Math proficiency
- 22% ▼ -8.00%
- Reading proficiency
- 36% ▼ -1.00%
- Median HH income
- $52,988
- Composite
- 25.61/100
- National rank
- #7410
- State rank
- #127 of 153 in CT
Livability — Derby
- Score
- 74/100
- State rank
- #64
- US rank
- #4574
Category grades
Schools grade is shown separately in the Schools card above.
Census & demographics
- Census place
- Derby, CT
- County
- New Haven County · 688,236 people
- City population
- 12,205
- Metro
- New Haven-Milford, CT
- Population (ZIP)
- 12,205
- Household income
- $78,542
- Rent vs Own
- Severe rent burden
- 711.0
Population outlook (Naugatuck Valley County) Hauer SSP2
- By 2040
- 496,846
Race, ethnicity, and origin ACS 2023
- Neighborhood character
- Diverse neighborhood (Simpson 0.59)
- Race & ethnicity
- White 60% Hispanic / Latino 21% Black 10% Two or more races 8% Asian 2%
- Hispanic origin (detail)
- Puerto Rican 12% Dominican 3%
- Common ancestry
- Romanian 8% Russian 3% Slovak 2%
- Foreign-born
- 12% · Canada, China, Jamaica
- Languages at home
- 78% English-only · Spanish 16% Other Indo-European 2% Russian/Polish/Slavic 2%
Political lean MEDSL · Naugatuck Valley
- 2024 margin
- Lean R (+7.4) · D 45.6% · R 53.0% · Other 1.4%
- All cycles
- 2024: R+7.4
Not yet ingested
- Civics
- —
Market trends
- HPI YoY
- ▼ -49.06%
- Current HPI
- 202.3832
- Rent YoY
- —
- Metro
- New Haven-Milford, CT
- State GDP YoY
- ▲ 1.06%
- F500 in state
- 38
Industry mix (Fortune 500 HQ in CT)
| Industry | F500 HQs | Revenue |
|---|---|---|
| Industrial Machinery | 4 | $38B |
|
||
| Insurance | 3 | $71B |
|
||
| Financial Services | 2 | $25B |
|
||
| Transportation / Logistics | 2 | $18B |
|
||
| Healthcare | 1 | $247B |
|
||
| Telecommunications | 1 | $55B |
|
||
Price history
+75.0% since first listed8 events — show timeline
- 2026-06-12 Listed $140,000 Smart MLS
- 2005-03-22 Sold (Public Records) $95,000 Public Records
- 2004-05-04 Sold (Public Records) $80,000 Public Records
- 2004-05-03 Sold (MLS) $80,000 Smart MLS
- 2003-10-02 Listed $89,000 Smart MLS
- 1994-03-22 Listing Removed — Smart MLS
- 1993-09-22 Listed $88,888 Smart MLS
- 1987-04-29 Sold (Public Records) $80,000 Public Records
Property tax history
+1.3%/yrLatest (2022): $2,613 · +0.0% YoY. Source: county tax records.
Cash-flow waterfall
monthlySold comps — $/sqft
last 12 mo · ≤1 miLoading sold comps…