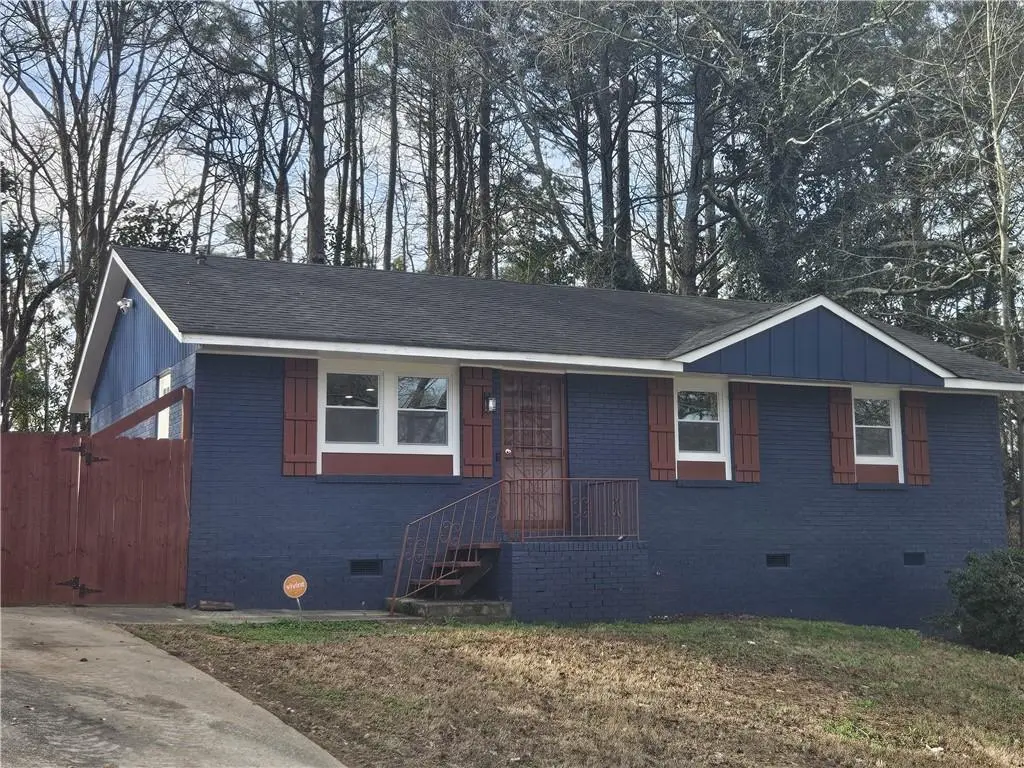
1258 Kipling St SE · Atlanta, GA
Flood risk 1/10 · Minimal
- FEMA flood zone
- X (unshaded)
- Chance of flooding over 30 yrs
- 0.0%
- Est. flood insurance / yr
- $473 – $860
Fire risk 3/10 · Minor
- Est. fire insurance / yr
- $963 – $1,789
Heat risk 5/10 · Moderate
- Hot days now (above 105°F)
- 7 days/yr
- Hot days in 30 yrs
- 17 days/yr
Wind risk 5/10 · Moderate
- Chance of severe wind over 30 yrs
- 25.0%
Air-quality risk 4/10 · Minor
- Unhealthy air days now
- 4 days/yr
- Unhealthy air days in 30 yrs
- 6 days/yr
Risk factors via First Street. Map © Google.
Why this score? — see what drove the D grade
The composite is a weighted blend of 9 inputs, each scored 0–100. Each bar is that input's sub-score; the figure is the points it added to the 100-point composite (weight × sub-score).
- ARV discount +15.0/15.0
- Cash flow +8.5/30.0
- Livability +4.2/5.0
- Rent growth +3.3/5.0
- Schools +2.7/10.0
- Condition / age +2.5/5.0
- DSCR +2.3/10.0
- 1% rule +1.9/10.0
- Appreciation +0.0/10.0
$264,500
🖨 Deal sheet (PDF) 📄 Offer letter ✓ Due diligence
Listing remarks MLS
This owner is motivated to sell so bring your best offer! Beautifully fully renovated Atlanta home featuring all new updates throughout. This home offers spacious living areas and a thoughtfully designed layout. The oversized primary suite includes direct access to a private deck, creating the perfect retreat to relax and enjoy the outdoors. The home features brand new bathrooms with modern finishes, adding a fresh and updated feel. The expansive walk-in closet in the primary suite offers plenty of space for dressers and additional storage, providing both comfort and functionality. With everything newly renovated, this home is move-in ready and designed for modern living. Situated on an R4 zoned lot, the property offers flexibility and future potential for homeowners or investors. Conveniently located near major highways, shopping, dining, and downtown Atlanta.
Key facts
- Private deck
- Fully renovated
- R4 zoned lot
Tags
Property features AI
Exterior
- Parking: Driveway; Open parking available
- Utilities: Public water; Public sewer; Electric service including 220 volts; Electricity available
- Home design: One level; Updated/remodeled condition
- Construction: Brick and cement siding construction; Shingle roof; Raised foundation
- Exterior features: Private yard; Back yard fencing; Asphalt road frontage on a city street; Please use GPS for directions
Interior
- Kitchen: Solid surface counters; Gas range
- Bedrooms: Four main-level bedrooms; Oversized master bedroom
- Flooring: Hardwood flooring; Laminate flooring
- Bathrooms: Two full bathrooms (both on the main level); Master bathroom with other/unspecified features
- Heating & cooling: Central heating; Natural gas heating; Central air conditioning
- Interior features: Other interior features; Double pane windows; No common walls
- Laundry & utility: Laundry closet
Neighborhood map
What this means for you Summary
Snapshot
- This is a 3-bed/1.0-bath single-family listed at $264k.
Deal economics
- At list price, monthly cash flow is $-231 ($-3k/yr) — negative.
- To cash-flow at today's rent, offer at most $224k (15.4% below list).
- To meet the 1% rule (rent ≥ 1% of price), the offer needs to be $183k (30.6% below list).
- Recommended offer: $183k (30.6% below list) — sets the bar for 1% rule.
- Cap rate 5.2% vs local median 3.1% in Atlanta — top-decile yield for the area; either an underpriced asset or a hidden risk that comps aren't pricing in. Stress-test before assuming the spread holds.
Location & tenants
- Location reads 83/100 on livability (#6 in GA, #919 nationally) — a professional / high-income tenant draw. Strengths: amenities A+, commute A+, housing A+; Watch: cost of living C-.
- Atlanta Public Schools (urban): math 28% / reading 35% proficiency, ranked #80 of 174 in GA (top 46%) — families likely to look elsewhere, expect single-tenant / working-renter base with shorter leases; 71% free/reduced lunch — lower-income household profile, screen leases tightly.
- Zoned schools: Thomas Heathe Slater Elementary School (math 2% / reading 8%, grade F, #1,160 of 1,228 statewide, top 98%, 569 students, 100% FRL); Judson Price Middle School (math 2% / reading 8%, grade F, #462 of 470 statewide, top 99%, 283 students, 100% FRL); Carver High School Early College (math 10% / reading 24%, grade F, #269 of 424 statewide, top 65%, 575 students, 100% FRL) — zoned schools average 100% FRL vs 71% district-wide (29 pts higher); higher-poverty schools than district average — tighter screening recommended.
- Zoned-school proficiency averages 9% at this address vs 32% district-wide (-22 pts) — the specific schools serving this property underperform the Atlanta Public Schools average; the district grade overstates school quality for this exact location.
- Market conditions: Rents rising (+3.2%/yr); 391 active listings in the ZIP; 12 comparable units currently listed for rent nearby; rentals at typical pace (median 26d on market — plan ~3-4 weeks tenant-placement turnaround); 11,565 units permitted in Fulton County in 2024 (8,159 in 5+ unit buildings).
- This rent runs 43% of the median local income ($51k/yr) — at the standard rent-burdened threshold; future hikes will face affordability resistance.
Forward outlook
- Local home prices are declining (-3.0%/yr); year-one equity from $2k of loan paydown is wiped out by about $8k of value loss. Plan a longer hold.
- Fulton County population projected at +38% by 2050 — long-run rental-demand tailwind backs the buy-and-hold thesis.
Negotiation context
- It's been on market 19 days — a 2% lower offer ($261k) is reasonable based on typical stale-listing flexibility.
- 5 sale attempts; this cycle's ask has dropped $24k (8%) from the opening price — seller is motivated, your offer sets the floor, not the list.
- Current owner paid $118k; list at $264k implies a 124% gain — meaningful room to come down on a strong offer.
Risks & watch-outs
- Climate carrying-cost: moderate wind risk, 25% chance of damaging wind over 30y; extreme-heat days projected 7→17/yr by 2055 (HVAC capex compounding) — expect insurance premiums to compound above CPI over the hold.
Questions for the listing agent
- What do current leases actually rent for vs. the listed asking? Can we see a recent rent roll and the last 12 months of T-12 income?
- Built in 1969 — when were the roof, HVAC, electrical panel, plumbing, and water heater last replaced?
- Is there a deadline driving the sale (1031 exchange, divorce, estate, relocation)? That informs how much negotiation room exists.
- The area grade is low — what's the realistic commute time and amenity access for the typical tenant pool here? Any planned neighborhood developments (good or bad) we should know about?
- What's the average days-on-market for RENTAL listings here right now (not sales)? A rising rental-DOM trend means longer vacancies and softer asking-rent achievability than the comps imply.
- What's the recent tenant-quality profile in this submarket — average credit score on applications, eviction rate, late-payment / NSF rate, and stable-employment percentage? A property-management company in the area should have these aggregated.
- How much new for-sale + rental construction is in the pipeline within 1–3 miles? Heavy new supply typically softens prices + rents 12–24 months out; constrained supply supports both.
Investment metrics
- 1% rule
- 0.69% ✗
- Cap rate
- 5.24%
- Cash-on-cash
- -3.74%
- DSCR
- 0.83
- GRM
- 12.0
CMA / ARV
- ARV (median comp)
- $341,625
- List price
- $264,500
- Delta
- -20.97%
- Verdict
- UNDERPRICED
- Comps
- 20 within 1.0 mi
Show comp detail 12 sales within ~0.75 mi
| Address | Dist | Beds/Ba | Sqft | Sold | Price | $/sf | Match |
|---|---|---|---|---|---|---|---|
| 1258 Kipling St SE | 0.00mi | 3/1.0 | 936 (0%) | 7mo | $118,000 | $126 | 94 |
| 2118 Kipling Cir SE | 0.17mi | 3/1.0 | 910 (-3%) | 4mo | $92,000 | $101 | 84 |
| 2006 Phillips Dr SE | 0.18mi | 3/1.0 | 1,000 (+7%) | 5mo | $100,000 | $100 | 77 |
| 1087 Hillcrest Dr SE | 0.34mi | 2/1.0 (-1) | 979 (+5%) | 7mo | $261,000 | $267 | 66 |
| 2040 Forrest Park Rd SE | 0.45mi | 3/1.0 | 984 (+5%) | 9mo | $170,000 | $173 | 63 |
| 1895 Thomasville Dr SE | 0.46mi | 3/1.0 | 983 (+5%) | 9mo | $98,000 | $100 | 63 |
| 1079 Stonewall Dr SE | 0.43mi | 3/1.0 | 1,008 (+8%) | 8mo | $140,000 | $139 | 61 |
| 1991 Turner Rd SE | 0.29mi | 3/2.0 | 1,036 (+11%) | 6mo | $198,000 | $191 | 60 |
| 1154 Penn Ct | 0.61mi | 3/1.0 | 1,000 (+7%) | 1mo | $188,300 | $188 | 59 |
| 938 Rebel Forest Dr SE | 0.74mi | 3/1.0 | 1,000 (+7%) | 4mo | $185,000 | $185 | 50 |
| 2294 Forrest Park Rd SE | 0.61mi | 3/2.0 | 1,008 (+8%) | 9mo | $175,000 | $174 | 47 |
| 1130 Rebel Forest Dr SE | 0.75mi | 3/2.0 | 1,025 (+10%) | 9mo | $217,000 | $212 | 38 |
Match score weights: distance 35% · size 25% · config 20% · recency 20%. Top-matched comps best support the ARV.
Projected returns pro-forma
-3.0% appreciation · 3.23% rent growth · sell at horizon
- IRR
- -22.4%
- Equity multiple
- 0.23×
- Total profit
- $-57,210
- Equity at exit
- $39,438
- IRR
- -16.1%
- Equity multiple
- 0.09×
- Total profit
- $-67,264
- Equity at exit
- $22,869
Cash invested: $74,060 (down + closing). Projections, not guarantees.
Landlord ↔ Tenant lean methodology
- Overall (STATE)
- 90 Strongly Landlord-Friendly
- State Georgia
- 90 Strongly Landlord-Friendly · R+3
- County
- — inherits STATE
- City
- — inherits STATE
ZIP-level market 30315
- Rents YoY
- 3.2%
- Active inventory
- 391
- Price-to-rent
- 12.0×
Monthly cashflow live
- Estimated rent
- $1,835 high interval (Pro) →
- Mortgage (P&I)
- −$1,387
- Tax from tax record
- −$183 /mo · $2,196/yr
- Insurance
- −$110
- HOA
- −$0
- Vacancy / Maint / Mgmt
- −$385
- Net cashflow
- $-231
Break-even live
Sensitivity live
| Price | -10% $-81 | -5% $-156 | +0% $-231 | +5% $-306 | +10% $-381 |
|---|---|---|---|---|---|
| Rent | -10% $-376 | -5% $-303 | +0% $-231 | +5% $-159 | +10% $-86 |
| Rate | -1.0pp $-98 | -0.5pp $-164 | base $-231 | +0.5pp $-300 | +1.0pp $-369 |
UW: 25.0% down · 7.5% · 30yr · 1.5% tax · 5.0% vac · 8.0% maint · 8.0% mgmt
Financing live
Cash to close
- Down payment
- $66,125
- Closing costs
- $7,935
- Reserves months
- —
- Total cash needed
- —
Loan-product check · same deal, 3 products live
Conventional
25% down · 7.5% · 30yr
- Down + closing
- —
- Monthly P&I
- —
- Monthly cashflow
- —
- DSCR
- —
- Eligible?
- —
Personal DTI + credit; lowest rate.
DSCR
20% down · 8.5% · 30yr
- Down + closing
- —
- Monthly P&I
- —
- Monthly cashflow
- —
- DSCR
- —
- Eligible?
- —
No personal income docs; deal must DSCR.
Hard money
10% down · 12.0% · 12mo
- Down + closing
- —
- Monthly P&I
- —
- Monthly cashflow
- —
- DSCR
- —
- Eligible?
- —
Short-term bridge; refi at stabilization.
Rent comps 12 comps
| Address | Beds | Baths | Sqft | Rent | $/sqft | DOM | Units | Dist |
|---|---|---|---|---|---|---|---|---|
| 1979 Turner Rd SE Atlanta, GA | 3.0 | 1.0 | 808 | $1,595 | $1.97 | 12d | 1 | 0.28mi |
| 1979 Turner Rd SE Atlanta, GA | 3.0 | 1.0 | 808 | $1,595 | $1.97 | 0d | 1 | 0.28mi |
| 1037 Rebel Forest Dr SE Atlanta, GA | 3.0 | 2.0 | 1075 | $1,750 | $1.63 | 26d | 1 | 0.76mi |
| 972 Welch St SE Atlanta, GA | 3.0 | 2.0 | 1100 | $900 | $0.82 | 7d | 1 | 0.82mi |
| 871 Hargis St SE Atlanta, GA | 2.0 | 2.0 | 1040 | $1,800 | $1.73 | 26d | 1 | 0.86mi |
| 1940 Fisher Rd SE Atlanta, GA | 2.0 | 1.0 | 760 | $1,300 | $1.71 | 26d | 1 | 1.07mi |
| 752 McDonough Blvd SE Atlanta, GA | 3.0 | 2.0 | 1120 | $1,895 | $1.69 | 0d | 1 | 1.13mi |
| 752 McDonough Blvd SE Atlanta, GA | 3.0 | 2.0 | 1120 | $1,895 | $1.69 | 26d | 1 | 1.13mi |
| 1316 Moreland Ave SE Atlanta, GA | 2.0 | 2.0 | 866 | $2,026 | $2.34 | 45d | 1 | 1.17mi |
| 1296 Moreland Ave SE Atlanta, GA | 1.0–2.0 | 1.0–2.0 | 1000 | $2,135 | $2.13 | 1d | 22 | 1.28mi |
| 2087 Lakewood Trl SE Atlanta, GA | 3.0 | 2.5 | 1056 | $2,256 | $2.14 | 26d | 1 | 1.37mi |
| 386 Lindsey Dr SE Atlanta, GA | 3.0 | 1.0 | 1040 | $1,793 | $1.72 | 0d | 1 | 1.42mi |
Listing history 33 events
-
2026-06-21days on market $264,500 Active 19 DOM
-
2026-06-18days on market $264,500 Active 16 DOM
-
2026-06-17price $264,500 Active 15 DOM
Show marketing remark (879 chars)
This owner is motivated to sell so bring your best offer! Beautifully fully renovated Atlanta home featuring all new updates throughout. This home offers spacious living areas and a thoughtfully designed layout. The oversized primary suite includes direct access to a private deck, creating the perfect retreat to relax and enjoy the outdoors. The home features brand new bathrooms with modern finishes, adding a fresh and updated feel. The expansive walk-in closet in the primary suite offers plenty of space for dressers and additional storage, providing both comfort and functionality. With everything newly renovated, this home is move-in ready and designed for modern living. Situated on an R4 zoned lot, the property offers flexibility and future potential for homeowners or investors. Conveniently located near major highways, shopping, dining, and downtown Atlanta.
-
2026-06-17days on market $271,900 Active 15 DOM
Show marketing remark (879 chars)
This owner is motivated to sell so bring your best offer! Beautifully fully renovated Atlanta home featuring all new updates throughout. This home offers spacious living areas and a thoughtfully designed layout. The oversized primary suite includes direct access to a private deck, creating the perfect retreat to relax and enjoy the outdoors. The home features brand new bathrooms with modern finishes, adding a fresh and updated feel. The expansive walk-in closet in the primary suite offers plenty of space for dressers and additional storage, providing both comfort and functionality. With everything newly renovated, this home is move-in ready and designed for modern living. Situated on an R4 zoned lot, the property offers flexibility and future potential for homeowners or investors. Conveniently located near major highways, shopping, dining, and downtown Atlanta.
-
2026-06-16days on market $271,900 Active 14 DOM
-
2026-06-15days on market $271,900 Active 13 DOM
-
2026-06-13days on market $271,900 Active 11 DOM
-
2026-06-13pricedays on market $271,900 Active 10 DOM
-
2026-06-09days on market $289,000 Active 7 DOM
-
2026-06-08days on market $289,000 Active 6 DOM
-
2026-06-07days on market $289,000 Active 5 DOM
-
2026-06-04days on market $289,000 Active 2 DOM
-
2026-06-02pricedays on market $289,000 Active 1 DOM
-
2026-05-31days on market $270,000 Active 77 DOM
-
2026-04-21price $270,000 890-char remark
-
2026-04-21price $270,000 890-char remark
-
2026-04-13price $275,000 890-char remark
-
2026-04-13price $275,000 890-char remark
-
2026-03-26price $285,000 890-char remark
-
2026-03-26price $285,000 890-char remark
-
2026-03-15$295,000 New 890-char remark
-
2026-03-15$295,000 Active 890-char remark
-
2025-11-18soldstatus $118,000
-
2025-11-17soldstatus $118,000 Sold
-
2025-11-17soldstatus $118,000 Closed
-
2025-11-08status Pending
-
2025-11-07status Under Contract
-
2025-11-07historical Active Under Contract
-
2025-11-02price $124,900
-
2025-11-02price $124,900
-
2025-10-23$129,000 Active
-
2025-10-22$129,000 New
-
2025-10-03soldstatus $95,000
ⓘ Source: listings_history table (triggers on properties + properties_extension) + one-shot
backfill from property_details.listing_events for pre-trigger history.
Tax reassessment forecast GA · Resets to sale price
- Current annual tax
- $2,196 · $183/mo
- Projected year-2 tax
- $2,433 · $203/mo
- Expected delta
- +$237/yr (+$20/mo · 10.8%)
ⓘ Screening estimate from a state-policy table — verify with the county assessor before closing.
Climate risk First Street
- Flood 1/10 Low FEMA zone X (unshaded) · 0% chance over 30 yrs
- Wildfire 3/10 Moderate
- Heat 5/10 Major 7 d/yr ≥105°F today · 17 d/yr by 30 yrs out
- Wind 5/10 Major 25% chance of damaging wind over 30 yrs
- Air quality 4/10 Moderate 4 unhealthy d/yr today · 6 by 30 yrs out
Nearby sold comps map
Loading sold comps map…
Walkable amenities ~0.75 mi
Loading nearby amenities…
Taxation est. · year 1
- Rental income
- $22,014
- − Mortgage interest
- −$14,816
- − Property taxes
- −$2,196
- − Insurance
- −$1,322
- − Repairs & maintenance
- −$1,761
- − Management
- −$1,761
- − Depreciation
- −$7,695
- Taxable loss
- −$7,537
- Est. tax savings @ 24.0%
- +$1,809
- After-tax cash flow
- $-963/yr
For passive investors: Depreciation is non-cash, so a rental often shows a tax loss while cash-flowing — sheltering income. Rental losses are passive: they offset passive income freely, and up to $25,000/yr can offset ordinary (W-2) income if you actively participate and your MAGI is under $100k (phasing out to $0 by $150k); unused losses carry forward. On sale, claimed depreciation is recaptured at up to 25%, and gains may owe capital-gains tax (a 1031 exchange can defer both). Figures are a year-1 estimate at your 24.0% rate — not tax advice; consult a CPA.
Schools (NCES district)
- District
- Atlanta Public Schools
- NCES district ID
- 1300120
- Math proficiency
- 28% ▼ -6.00%
- Reading proficiency
- 35% ▼ -2.00%
- Median HH income
- $48,306
- Composite
- 27.27/100
- National rank
- #7006
- State rank
- #80 of 174 in GA
Livability — Atlanta
- Score
- 83/100
- State rank
- #6
- US rank
- #919
Category grades
Schools grade is shown separately in the Schools card above.
Census & demographics
- Census place
- Atlanta, GA
- County
- Fulton County · 1,094,430 people
- City population
- 629,525
- Metro
- Atlanta-Sandy Springs-Alpharetta, GA
- Population (ZIP)
- 34,264
- Household income
- $50,822
- Rent vs Own
- Severe rent burden
- 2962.0
Population outlook (Fulton County) Hauer SSP2
- Today (2025)
- 1,203,707 people
- By 2030
- 1,299,706 · +8.0%
- By 2040
- 1,488,256 · +23.6%
- By 2050
- 1,664,580 · +38.3%
- By 2075
- 2,036,072 · +69.2%
- By 2100
- 2,222,402 · +84.6%
Race, ethnicity, and origin ACS 2023
- Neighborhood character
- Predominantly Black (72%)
- Race & ethnicity
- Black 72% White 14% Hispanic / Latino 10% Two or more races 4%
- Hispanic origin (detail)
- Mexican 4%
- Common ancestry
- Romanian 1% Italian 1% Lithuanian 1%
- Foreign-born
- 5% · Canada
- Languages at home
- 90% English-only · Spanish 9% French/Haitian/Cajun 1%
Political lean MEDSL · Fulton
- 2024 margin
- Solid D (+44.9) · D 71.9% · R 27.0% · Other 1.1%
- 2008→2024 swing
- +9.8pp toward D · 2008: 35.0pp · 2024: 44.9pp
- All cycles
- 2024: D+44.9 2020: D+46.4 2016: D+42.1 2012: D+29.6 2008: D+35.0
Not yet ingested
- Civics
- —
Market trends
- HPI YoY
- ▼ -281.87%
- Current HPI
- 176.673
- Rent YoY
- ▲ 3.23%
- Metro
- Atlanta-Sandy Springs-Alpharetta, GA
- State GDP YoY
- ▲ 2.66%
- F500 in state
- 28
Industry mix (Fortune 500 HQ in GA)
| Industry | F500 HQs | Revenue |
|---|---|---|
| Paper / Packaging | 2 | $29B |
|
||
| Retail | 1 | $160B |
|
||
| Transportation / Logistics | 1 | $91B |
|
||
| Airlines | 1 | $62B |
|
||
| Consumer Goods | 1 | $47B |
|
||
| Utilities | 1 | $25B |
|
||
Price history
+178.4% since first listed22 events — show timeline
- 2026-06-17 Price Changed $264,500 GAMLS
- 2026-06-17 Price Changed $264,500 FMLS
- 2026-06-10 Price Changed $271,900 GAMLS
- 2026-06-10 Price Changed $271,900 FMLS
- 2026-06-01 Listed $289,000 FMLS
- 2026-06-01 Listed $289,000 GAMLS
- 2026-05-31 Listing Removed — GAMLS
- 2026-04-21 Price Changed $270,000 GAMLS
- 2026-04-13 Price Changed $275,000 GAMLS
- 2026-03-26 Price Changed $285,000 GAMLS
- 2026-03-15 Listed $295,000 GAMLS
- 2025-11-18 Sold (Public Records) $118,000 Public Records
- 2025-11-17 Sold (MLS) $118,000 FMLS
- 2025-11-17 Sold (MLS) $118,000 GAMLS
- 2025-11-08 Pending — FMLS
- 2025-11-07 Pending — GAMLS
- 2025-11-07 Contingent — FMLS
- 2025-11-02 Price Changed $124,900 FMLS
- 2025-11-02 Price Changed $124,900 GAMLS
- 2025-10-23 Listed $129,000 FMLS
- 2025-10-22 Listed $129,000 GAMLS
- 2025-10-03 Sold (Public Records) $95,000 Public Records
Property tax history
+12.1%/yrLatest (2025): $2,196 · -22.8% YoY. Source: county tax records.
Cash-flow waterfall
monthlySold comps — $/sqft
last 12 mo · ≤1 miLoading sold comps…