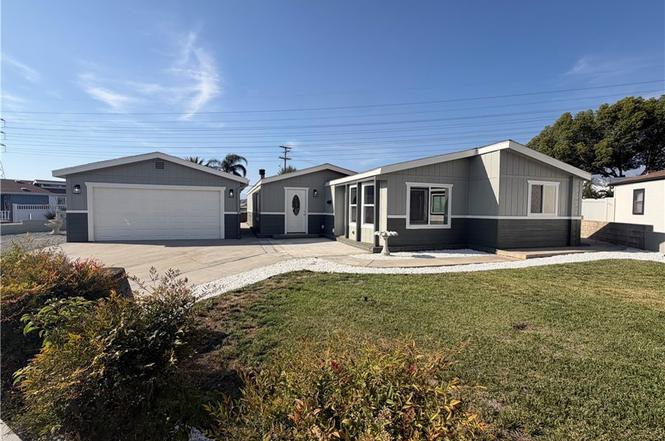
10961 Desert Lawn Dr #26 · Calimesa, CA
Flood risk 1/10 · Minimal
- FEMA flood zone
- X (unshaded)
- Chance of flooding over 30 yrs
- 0.0%
- Est. flood insurance / yr
- $507 – $1,088
Fire risk 10/10 · Severe
- Est. fire insurance / yr
- $659 – $1,223
Heat risk 6/10 · Moderate
- Hot days now (above 101°F)
- 7 days/yr
- Hot days in 30 yrs
- 20 days/yr
Wind risk 1/10 · Minimal
- Chance of severe wind over 30 yrs
- —
Air-quality risk 10/10 · Severe
- Unhealthy air days now
- 34 days/yr
- Unhealthy air days in 30 yrs
- 40 days/yr
Risk factors via First Street. Map © Google.
Why this score? — see what drove the C- grade
The composite is a weighted blend of 9 inputs, each scored 0–100. Each bar is that input's sub-score; the figure is the points it added to the 100-point composite (weight × sub-score).
- Cash flow +25.9/30.0
- DSCR +8.7/10.0
- 1% rule +6.9/10.0
- Schools +4.0/10.0
- Livability +2.8/5.0
- Rent growth +2.5/5.0
- Condition / age +2.5/5.0
- ARV discount +0.0/15.0
- Appreciation +0.0/10.0
$269,900
🖨 Deal sheet 📄 Offer letter ✓ Due diligence
Listing remarks
Gorgeous 3-bedroom 2 bath home in a beautiful 55+ community not to mention its on a corner lot!!! This home has had a custom make over inside and out: new easy close cabinets with quartz counter tops, recess lighting, new kitchen appliances, custom tile work, walk in shower, refaced fireplace, new dual glaze windows, Luxury Vinyl tile flooring with a lifetime warranty, new paint inside and out, new A/C & Furnace & other enhancements. The kitchen island has additional storage space if needed and the dining area is large enough to accommodate an 8 place dinning set. This beauty is appx. 1800+ square feet with a 2-car garage, front yard will take minimal maintenance, the side lot i
Key facts
- Recess lighting
- Custom tile work
- Quartz counter tops
Tags
Property features AI
Finance
- Other: Park name: Plantation on The Lake; Neighborhood amenities: lake, park, ravine, biking, street lighting, curbs, gutters, storm drains, preserve/public land
- Financial info: Land lease: $1,081 monthly (park); Manager approval required; Pets allowed with breed restrictions
- HOA & community: Part of an association (senior community); Association amenities include: pool, spa, clubhouse, gym/exercise room, billiard room, picnic area, outdoor cooking area, fire pit, recreational multipurpose room, pickleball, dog park; call for rules
Exterior
- Parking: Garage (2 parking spaces, 2 garage spaces)
- Security: Fire and smoke detection system; Carbon monoxide detectors
- Utilities: Well water; Public sewer; Water available; Sewer available; Natural gas available; Electricity available; Cable available; Telephone in street
- Home design: Single-story (one level); Front entry; Mobile home remains; Model 4563K
- Construction: Composition roof; Masonite and drywall walls; Pier jacks foundation; Built by builder (year built source: Builder)
- Exterior features: Concrete patio; Community pool; Sprinklers in front; Corner lot; Stone skirt
Interior
- Kitchen: Gas range; Microwave; Dishwasher; Water heater unit; Quartz counters
- Bedrooms: Primary bedroom with walk-in closet
- Flooring: Laminated flooring
- Bathrooms: One full bath and one half bath; Walk-in shower; Shower in tub; Double sinks
- Heating & cooling: Central cooling; Forced air / central furnace; Fireplace
- Interior features: Turnkey, updated/remodeled; Unfurnished; Ceiling fan; Double pane windows; Quartz counters; Fire and smoke detection system; Carbon monoxide detectors; Community spa
- Laundry & utility: Dedicated laundry room (individual room)
Neighborhood map
What this means for you Summary
Snapshot
- This is a 2-bed/2.0-bath manufactured listed at $270k.
Deal economics
- At list price, monthly cash flow is $663 ($8k/yr) — positive.
- The deal already cash-flows at list — no discount required.
- Meets the 1% rule at list price ($3k rent vs $270k).
- Cap rate 9.2% vs local median 6.7% in Calimesa — top-decile yield for the area; either an underpriced asset or a hidden risk that comps aren't pricing in. Stress-test before assuming the spread holds.
Location & tenants
- Location reads 55/100 on livability (#865 in CA) — a working-class tenant base; expect higher turnover. Strengths: housing A+, crime A-, employment B; Watch: health & safety D+, schools D, amenities F.
- Beaumont Unified (suburban): math 32% / reading 60% proficiency, ranked #168 of 517 in CA (top 32%) — families likely to look elsewhere, expect single-tenant / working-renter base with shorter leases.
- Market conditions: 67 active listings in the ZIP; 1 comparable units currently listed for rent nearby; 9,195 units permitted in Riverside County in 2024 (1,512 in 5+ unit buildings).
Forward outlook
- Local home prices are declining (-3.0%/yr); year-one equity from $2k of loan paydown is wiped out by about $8k of value loss. Plan a longer hold.
- Riverside County population projected at +22% by 2050 — long-run rental-demand tailwind backs the buy-and-hold thesis.
Negotiation context
- Only 2 days on market — expect competitive offers; lowballing is unlikely to land.
- 4 sale attempts; this cycle's ask is 173% above the opening price — seller raised mid-cycle; expect resistance to lowballs.
Risks & watch-outs
- Climate carrying-cost: severe wildfire risk; extreme-heat days projected 7→20/yr by 2055 (HVAC capex compounding) — expect insurance premiums to compound above CPI over the hold.
Questions for the listing agent
- Is there a deadline driving the sale (1031 exchange, divorce, estate, relocation)? That informs how much negotiation room exists.
- Schools are D-rated, which usually means shorter tenancies and higher turnover. Who's the typical renter profile here, and what's been the actual vacancy rate?
- What's the average days-on-market for RENTAL listings here right now (not sales)? A rising rental-DOM trend means longer vacancies and softer asking-rent achievability than the comps imply.
- What's the recent tenant-quality profile in this submarket — average credit score on applications, eviction rate, late-payment / NSF rate, and stable-employment percentage? A property-management company in the area should have these aggregated.
- How much new for-sale + rental construction is in the pipeline within 1–3 miles? Heavy new supply typically softens prices + rents 12–24 months out; constrained supply supports both.
Investment metrics
- 1% rule
- 1.19% ✓
- Cap rate
- 9.24%
- Cash-on-cash
- 10.52%
- DSCR
- 1.47
- GRM
- 7.0
CMA / ARV
- ARV (on-the-fly)
- $220,564
- Comps found
- 12
Show comp detail 12 sales within ~0.75 mi
| Address | Dist | Beds/Ba | Sqft | Sold | Price | $/sf | Match |
|---|---|---|---|---|---|---|---|
| 10961 Desert Lawn Dr #21 | 0.00mi | 3/2.0 (+1) | 1,660 (+1%) | 4mo | $250,000 | $151 | 90 |
| 10961 Desert Lawn Dr #394 | 0.00mi | 2/2.0 | 1,612 (-2%) | 8mo | $255,000 | $158 | 90 |
| 10961 Desert Lawn Dr #466 | 0.00mi | 3/2.0 (+1) | 1,600 (-3%) | 1mo | $200,000 | $125 | 90 |
| 10961 Desert Lawn Dr #79 | 0.00mi | 3/2.0 (+1) | 1,700 (+3%) | 1mo | $90,000 | $53 | 88 |
| 10961 Desert Lawn Dr #82 | 0.00mi | 2/2.0 | 1,560 (-5%) | 3mo | $265,000 | $170 | 88 |
| 10961 Desert Lawn Dr #453 | 0.00mi | 3/2.0 (+1) | 1,586 (-4%) | 3mo | $228,000 | $144 | 87 |
| 10961 Desert Lawn Dr #331 | 0.19mi | 2/2.0 | 1,675 (+2%) | 5mo | $217,000 | $130 | 84 |
| 10961 Desert Lawn Dr #162 | 0.00mi | 2/2.0 | 1,440 (-12%) | 1mo | $120,000 | $83 | 78 |
| 10961 Desert Lawn Dr #451 | 0.28mi | 2/2.0 | 1,612 (-2%) | 6mo | $235,000 | $146 | 78 |
| 10961 Desert Lawn Dr #243 | 0.00mi | 3/2.0 (+1) | 1,820 (+11%) | 4mo | $215,000 | $118 | 74 |
| 10961 Desert Lawn Dr #380 | 0.19mi | 2/2.0 | 1,823 (+11%) | 3mo | $245,000 | $134 | 70 |
| 10961 Desert Lawn #433 | 0.00mi | 3/2.0 (+1) | 1,890 (+15%) | 0mo | $250,000 | $132 | 70 |
Match score weights: distance 35% · size 25% · config 20% · recency 20%. Top-matched comps best support the ARV.
Projected returns pro-forma
-3.0% appreciation · 3.0% rent growth · sell at horizon
- IRR
- -0.5%
- Equity multiple
- 0.98×
- Total profit
- $-1,474
- Equity at exit
- $40,243
- IRR
- 9.2%
- Equity multiple
- 1.70×
- Total profit
- $53,268
- Equity at exit
- $23,336
Cash invested: $75,572 (down + closing). Projections, not guarantees.
Landlord ↔ Tenant lean methodology
- Overall (STATE)
- 18 Strongly Tenant-Friendly
- State California
- 18 Strongly Tenant-Friendly · D+13
- County
- — inherits STATE
- City
- — inherits STATE
ZIP-level market 92320
- Home prices YoY
- -22.2%
- Active inventory
- 67
- Price-to-rent
- 7.0×
Monthly cashflow live
- Estimated rent
- $3,200 medium interval (Pro) →
- Mortgage (P&I)
- −$1,415
- Tax est. 1.5%
- −$337 /mo · $4,048/yr
- Insurance
- −$112
- HOA
- −$0
- Vacancy / Maint / Mgmt
- −$672
- Net cashflow
- $663
Break-even live
UW: 25.0% down · 7.5% · 30yr · 1.5% tax · 5.0% vac · 8.0% maint · 8.0% mgmt
Financing live
Cash to close
- Down payment
- $67,475
- Closing costs
- $8,097
- Reserves months
- —
- Total cash needed
- —
Loan-product check · same deal, 3 products live
Conventional
25% down · 7.5% · 30yr
- Down + closing
- —
- Monthly P&I
- —
- Monthly cashflow
- —
- DSCR
- —
- Eligible?
- —
Personal DTI + credit; lowest rate.
DSCR
20% down · 8.5% · 30yr
- Down + closing
- —
- Monthly P&I
- —
- Monthly cashflow
- —
- DSCR
- —
- Eligible?
- —
No personal income docs; deal must DSCR.
Hard money
10% down · 12.0% · 12mo
- Down + closing
- —
- Monthly P&I
- —
- Monthly cashflow
- —
- DSCR
- —
- Eligible?
- —
Short-term bridge; refi at stabilization.
Rent comps 1 comps
| Address | Beds | Baths | Sqft | Rent | $/sqft | DOM | Units | Dist |
|---|---|---|---|---|---|---|---|---|
| 35258 Vernon Dr Beaumont, CA | 3.0 | 1.5 | 1990 | $3,200 | $1.61 | 1d | 1 | 0.86mi |
Listing history 3 events
-
2026-06-18days on market $269,900 Coming Soon 2 DOM
-
2026-06-17remarks 691-char remark
-
2026-06-17$269,900 Coming Soon 1 DOM
ⓘ Source: listings_history table (triggers on properties + properties_extension) + one-shot
backfill from property_details.listing_events for pre-trigger history.
Climate risk First Street
- Flood 1/10 Low FEMA zone X (unshaded) · 0% chance over 30 yrs
- Wildfire 10/10 Extreme
- Heat 6/10 Major 7 d/yr ≥101°F today · 20 d/yr by 30 yrs out
- Wind 1/10 Low
- Air quality 10/10 Extreme 34 unhealthy d/yr today · 40 by 30 yrs out
Nearby sold comps map
Loading sold comps map…
Walkable amenities ~0.75 mi
Loading nearby amenities…
Taxation est. · year 1
- Rental income
- $38,400
- − Mortgage interest
- −$15,119
- − Property taxes
- −$4,048
- − Insurance
- −$1,350
- − Repairs & maintenance
- −$3,072
- − Management
- −$3,072
- − Depreciation
- −$7,852
- Taxable income
- $3,888
- Est. tax owed @ 24.0%
- −$933
- After-tax cash flow
- $7,020/yr
For passive investors: Depreciation is non-cash, so a rental often shows a tax loss while cash-flowing — sheltering income. Rental losses are passive: they offset passive income freely, and up to $25,000/yr can offset ordinary (W-2) income if you actively participate and your MAGI is under $100k (phasing out to $0 by $150k); unused losses carry forward. On sale, claimed depreciation is recaptured at up to 25%, and gains may owe capital-gains tax (a 1031 exchange can defer both). Figures are a year-1 estimate at your 24.0% rate — not tax advice; consult a CPA.
Schools (NCES district)
- District
- Beaumont Unified
- NCES district ID
- 0604290
- Math proficiency
- 32% ▼ -4.00%
- Reading proficiency
- 60% ▲ 11.00%
- Median HH income
- $60,635
- Composite
- 40.37/100
- National rank
- #3736
- State rank
- #168 of 517 in CA
Livability — Calimesa
- Score
- 55/100
- State rank
- #865
- US rank
- #23579
Category grades
Schools grade is shown separately in the Schools card above.
Census & demographics
- Census place
- Calimesa, CA
- City population
- 10,680
- Population (ZIP)
- 10,680
Population outlook (Riverside County) Hauer SSP2
- Today (2025)
- 2,664,475 people
- By 2030
- 2,802,692 · +5.2%
- By 2040
- 3,050,904 · +14.5%
- By 2050
- 3,256,783 · +22.2%
- By 2075
- 3,655,058 · +37.2%
- By 2100
- 3,766,594 · +41.4%
Race, ethnicity, and origin ACS 2023
- Neighborhood character
- Diverse neighborhood (Simpson 0.57)
- Race & ethnicity
- White 57% Hispanic / Latino 31% Two or more races 12% Asian 3% Black 3% Native American 1%
- Hispanic origin (detail)
- Mexican 27%
- Common ancestry
- Italian 2% Slovak 1% Lithuanian 1%
- Foreign-born
- 7% · Canada
- Languages at home
- 85% English-only · Spanish 12% Tagalog/Filipino 2%
Political lean MEDSL · Riverside
- 2024 margin
- Toss-up / Even · D 48.0% · R 49.3% · Other 2.6%
- 2008→2024 swing
- -3.6pp toward R · 2008: 2.3pp · 2024: -1.3pp
- All cycles
- 2024: R+1.3 2020: D+8.0 2016: D+4.3 2012: R+0.4 2008: D+2.3
Not yet ingested
- Civics
- —
Market trends
- HPI YoY
- ▼ -104.13%
- Current HPI
- 364.3627
- Rent YoY
- —
- Metro
- —
- State GDP YoY
- ▲ 3.21%
- F500 in state
- 116
Industry mix (Fortune 500 HQ in CA)
| Industry | F500 HQs | Revenue |
|---|---|---|
| Technology | 27 | $1,492B |
|
||
| Financial Services | 3 | $174B |
|
||
| Retail | 3 | $44B |
|
||
| Insurance | 3 | $26B |
|
||
| Media / Entertainment | 2 | $115B |
|
||
| Pharmaceuticals / Biotech | 2 | $62B |
|
||
Price history
+116.1% since first listed10 events — show timeline
- 2026-06-16 Coming Soon $269,900 CRMLS
- 2025-11-14 Relisted — SDMLS
- 2025-09-26 Pending — SDMLS
- 2025-09-26 Listing Removed — SDMLS
- 2025-09-12 Price Changed $89,000 SDMLS
- 2025-08-28 Listed $99,000 SDMLS
- 2025-08-21 Listing Removed — CRMLS
- 2025-07-24 Listing Removed — CRMLS
- 2025-07-23 Listed $119,900 CRMLS
- 2025-07-21 Listed $124,900 CRMLS
Property tax history
-2.8%/yrLatest (2025): $528 · +2.0% YoY. Source: county tax records.
Cash-flow waterfall
monthlySold comps — $/sqft
last 12 mo · ≤1 miLoading sold comps…